The Local Lowdown: October 2026
Michelle Kim | November 1, 2026

Michelle Kim | November 1, 2026
Quick Take:
*National Association of REALTORS® data is released two months behind, so we estimate the most recent month's data when possible and appropriate.
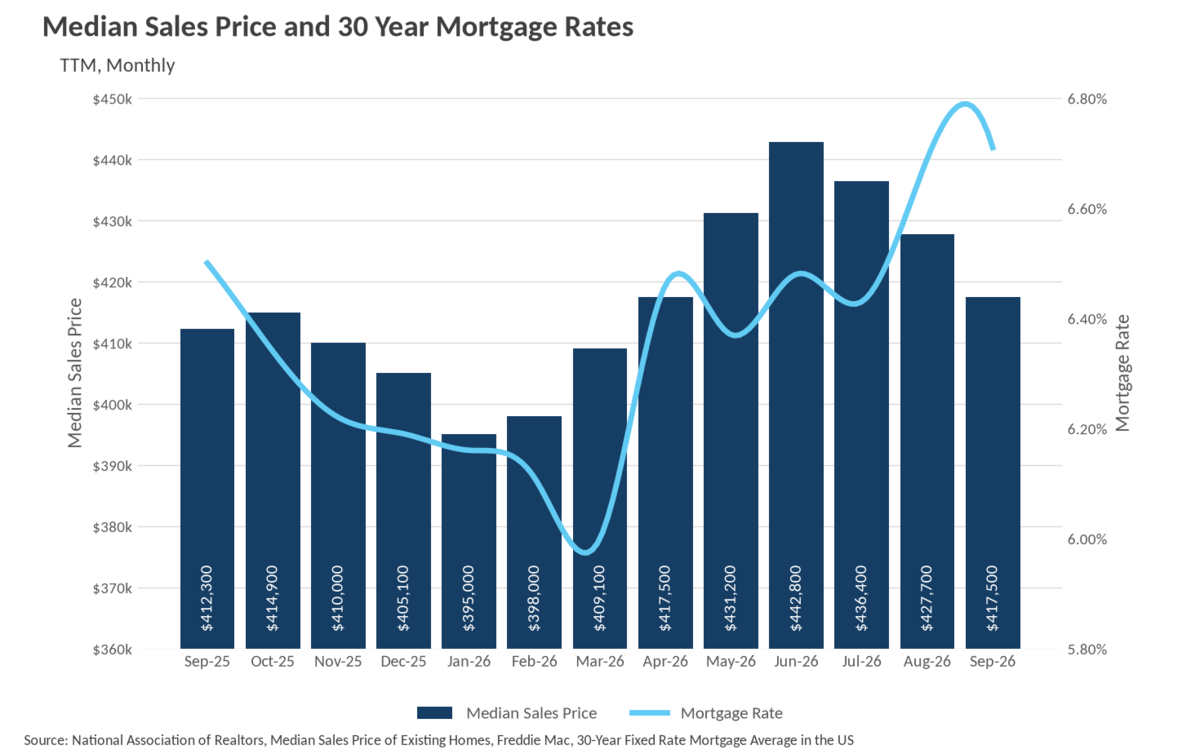
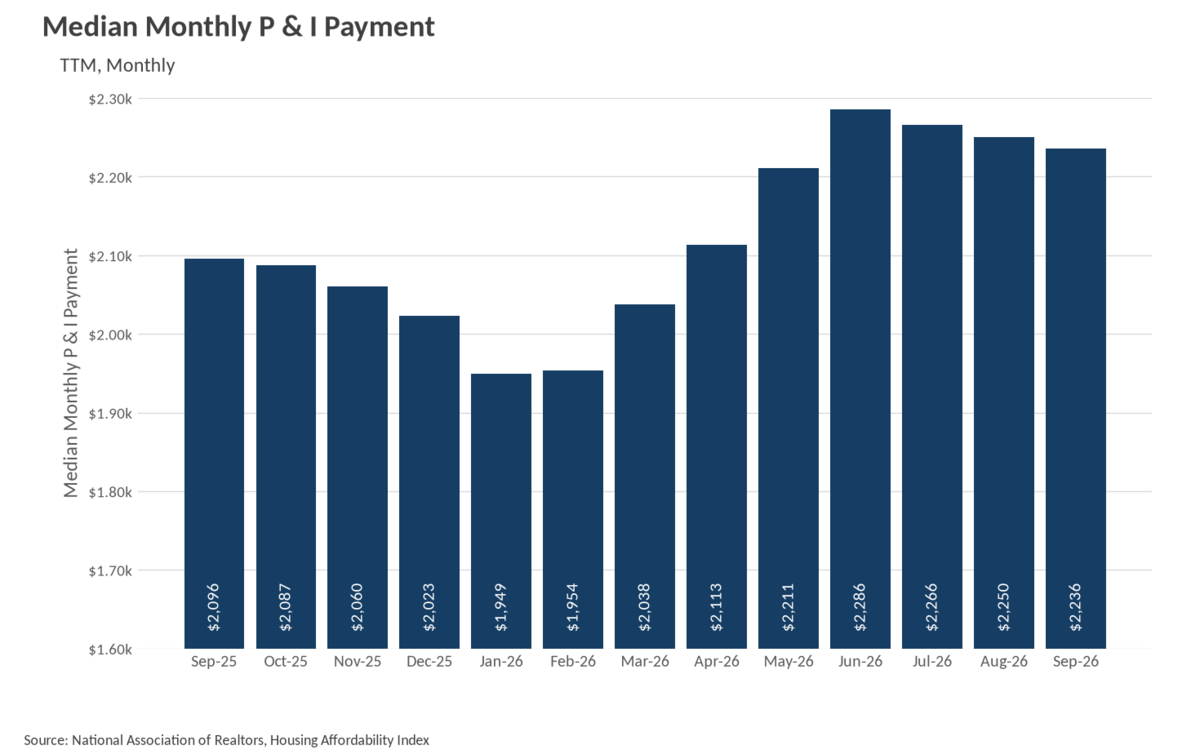
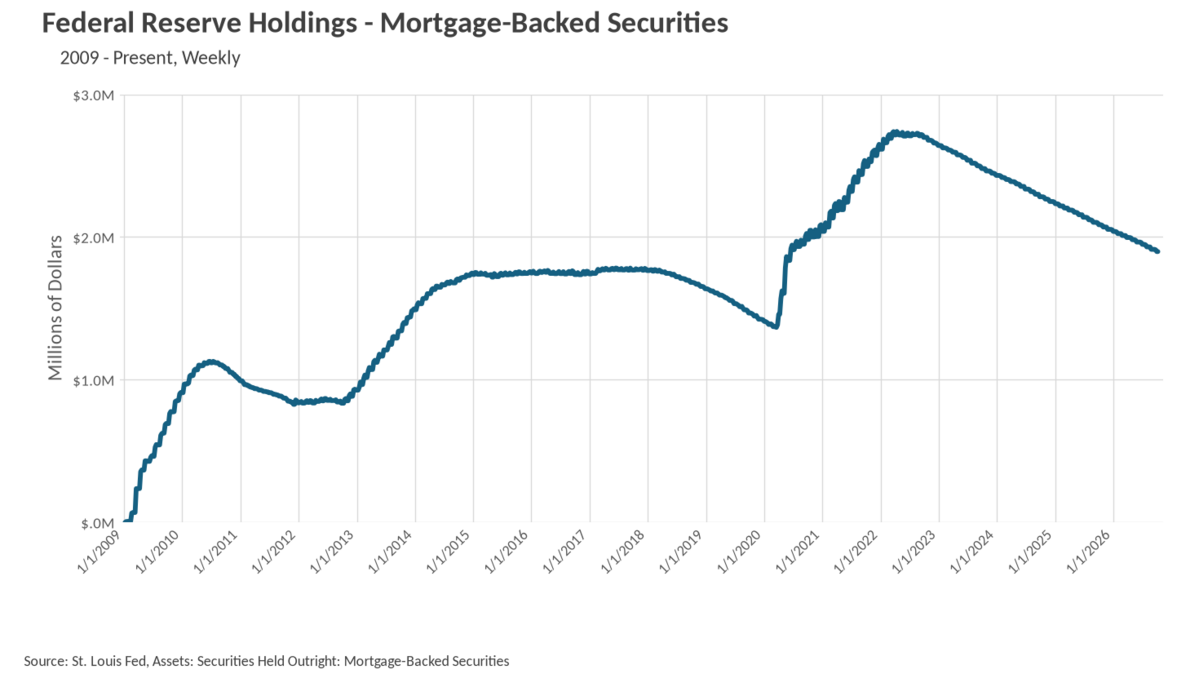
After a five-month run that carried the median sale price from $395,000 in January to a peak of $442,800 in June, prices have now retreated for three consecutive months. In September, the median home sold for $417,500, a 2.39% decline from August's $427,700 and a 5.71% drop from the June high. The one silver lining is that prices are still holding above last year's level, up 1.26% from the $412,300 median we saw in September 2025. Some of this seasonal softening is normal, as the back half of the year typically brings cooler pricing, but the affordability story is doing real damage here. Mortgage rates climbed to 6.71% in September and then jumped sharply to 7.28% in October, a full 128 basis points above the 6.00% low we saw back in March. Even with prices falling, the median monthly P&I payment sits at $2,236, which is 6.68% higher than the $2,096 buyers were paying a year ago and nearly $300 above January's $1,949. In other words, lower prices have not translated into lower payments, and with rates now pushing above 7%, the affordability squeeze is likely to intensify before it eases. Worth watching on that front: the Federal Reserve has continued to let its mortgage-backed securities holdings run off, with the balance falling from roughly $2.04 trillion in January to about $1.90 trillion in October, which removes a meaningful source of demand from the mortgage market.
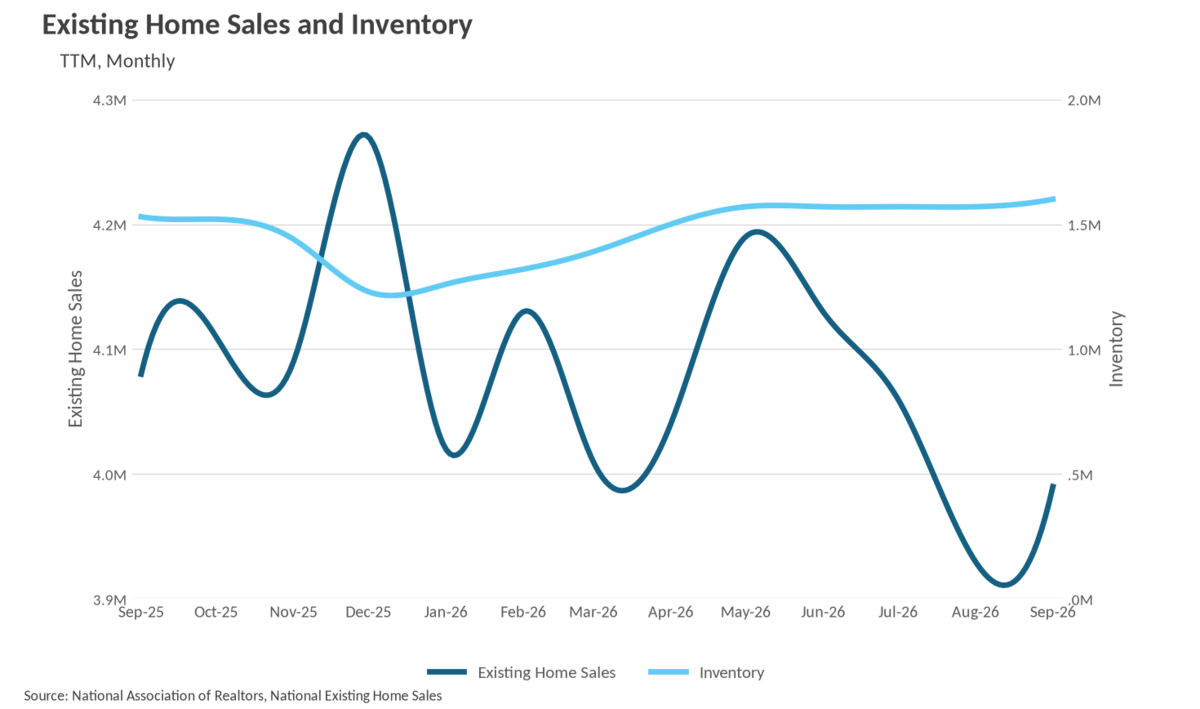
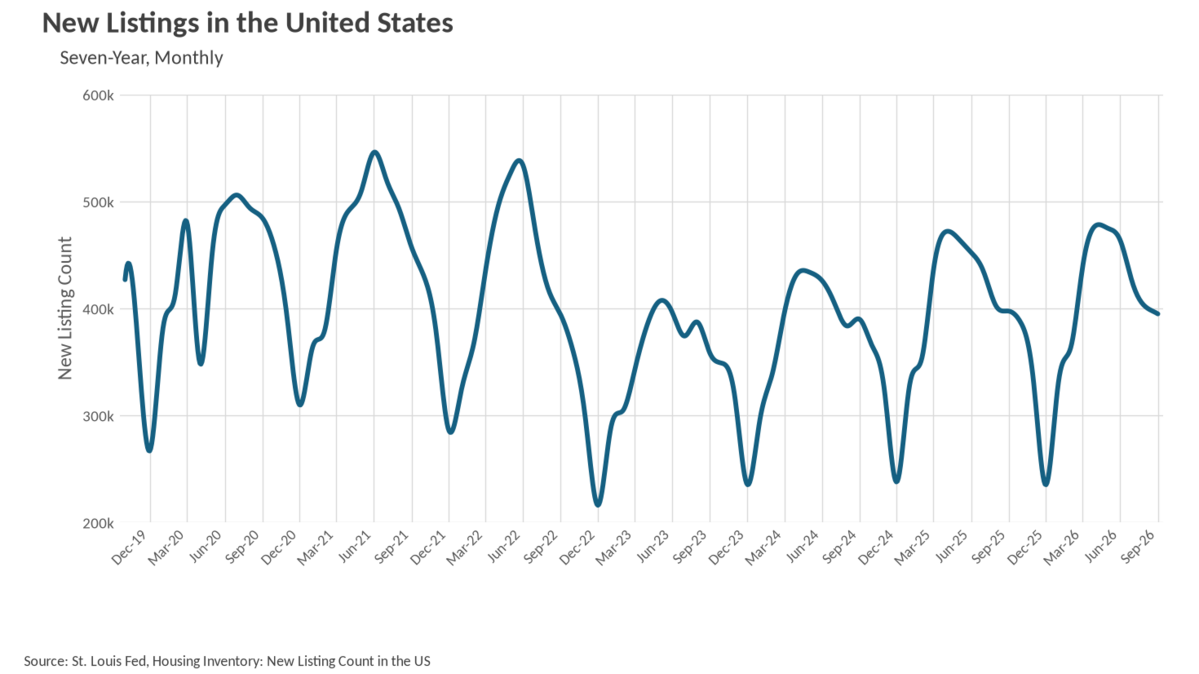
For four straight months, from May through August, inventory sat frozen at 1,570,000 homes. That changed in September, when inventory climbed to 1,600,000, a 1.91% month-over-month increase and a 4.58% gain over the 1,530,000 homes available at this time last year. This is the highest inventory level we have seen in well over a year, and notably it is rising at a point in the calendar when supply usually begins to contract. The new listings data tells a slightly different story, though. September brought 394,830 new listings to market, down 1.72% from August and down 0.65% from the 397,428 we saw in September 2025. So the inventory build is not coming from a flood of new sellers. Instead, it reflects homes sitting on the market longer and failing to clear at current prices. That is a meaningful distinction, because it suggests the supply increase is a demand problem rather than a supply surge, and it helps explain why prices have been drifting lower since June.
Existing home sales came in at 3,990,000 in September, a 1.53% increase from August's 3,930,000, which was the weakest reading in this entire data series. That modest uptick is welcome, but the year-over-year comparison is less encouraging: sales are down 2.21% from the 4,080,000 pace recorded in September 2025. The trend over the past several months has been clearly downward, with sales falling from 4,190,000 in May to 4,130,000 in June, 4,060,000 in July, and then 3,930,000 in August before September's small rebound. The timing lines up almost perfectly with the climb in mortgage rates, which bottomed at 6.00% in March and have risen in nearly every month since. Buyers who were energized by cheaper financing in the spring are now facing a very different math problem. With October rates at 7.28%, it is difficult to build a case for a meaningful rebound in transaction volume in the near term, though lower prices combined with the widest selection of homes in more than a year could tempt patient buyers who have been waiting on the sidelines.
When determining whether a market is a buyers’ market or a sellers’ market, we look to the Months of Supply Inventory (MSI) metric. The state of California has historically averaged around three months of MSI, so any area with at or around three months of MSI is considered a balanced market. Any market that has lower than three months of MSI is considered a seller’s market, whereas markets with more than three months of MSI are considered buyers’ markets.
Nationally, the math now points squarely toward a buyers' market. With 1,600,000 homes available in September against an annualized sales pace of 3,990,000, the national market is carrying roughly 4.8 months of supply, comfortably above the three-month balance point and up from about 4.5 months at this time last year. Inventory is growing, sales are running below last year's pace, and prices have fallen three months in a row, which is exactly the combination you would expect in a market where buyers hold the leverage. The caveat, of course, is that having leverage and being able to use it are two different things. With rates at 7.28% in October and the median P&I payment nearly 7% higher than a year ago, many buyers simply cannot act on the discounts now available to them. Sellers, for their part, should expect longer marketing times and should price realistically rather than anchoring to June's peak. As always, real estate is a highly localized asset, which is why you should check out what's going on in your local market below in the Local Lowdown!
Stay up to date on the latest real estate trends.
Michelle Kim | November 1, 2026
Quick Take: Median home sale prices have declined for the third straight month, slipping to $417,500 in September, though they remain slightly above where they were a … Read more

Michelle Kim | November 1, 2026
Quick Take: Median single-family prices climbed year over year in three of four counties, led by Sonoma County at 7.79% growth, while Solano County slipped 5.74%. Inve… Read more

Michelle Kim | November 1, 2026
Quick Take: Single-family prices are holding roughly flat year over year, with Alameda County at $1,250,000 and Contra Costa County at $850,500, both easing modestly f… Read more

Michelle Kim | November 1, 2026

Michelle Kim | November 1, 2026
Quick Take: The single-family median sale price jumped back above $2 million in September, finishing 18.4% higher than a year ago at $2,054,000. Inventory rebounded se… Read more

Michelle Kim | November 1, 2026
Quick Take: Single-family prices held up across most of the Bay Area in September, led by San Francisco at $2,054,000 (up 18.39% year over year) and San Mateo County a… Read more
You’ve got questions and we can’t wait to answer them.