The Local Lowdown: October 2026
Michelle Kim | November 1, 2026

Michelle Kim | November 1, 2026
Quick Take:
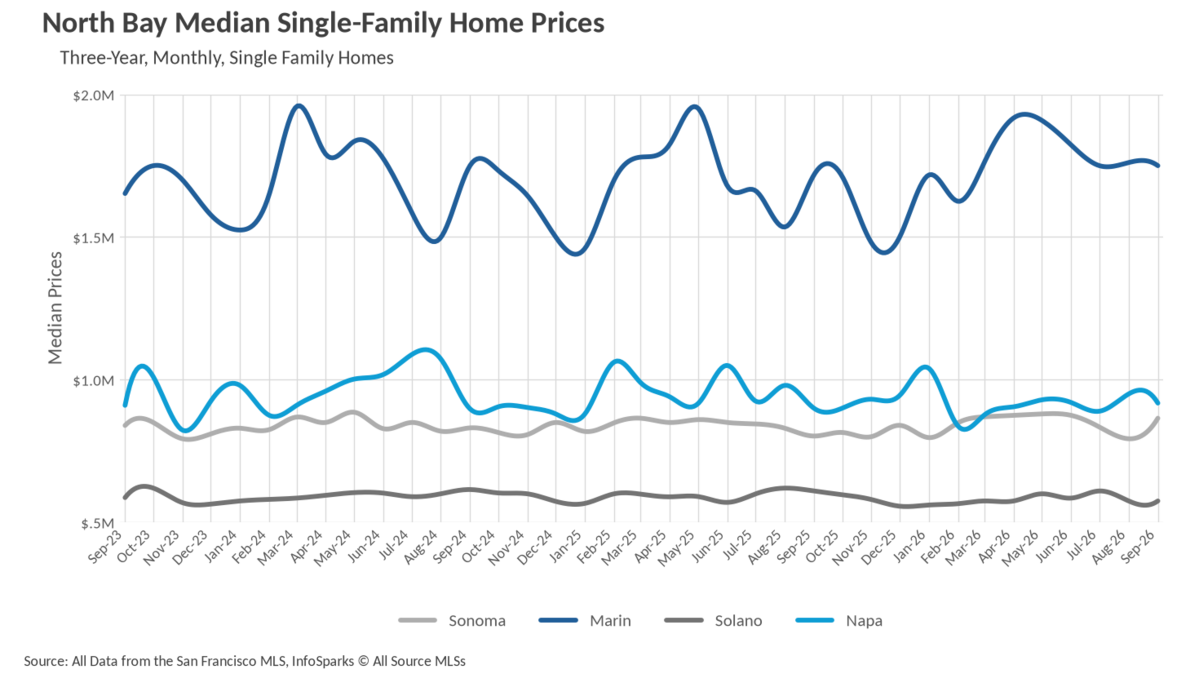
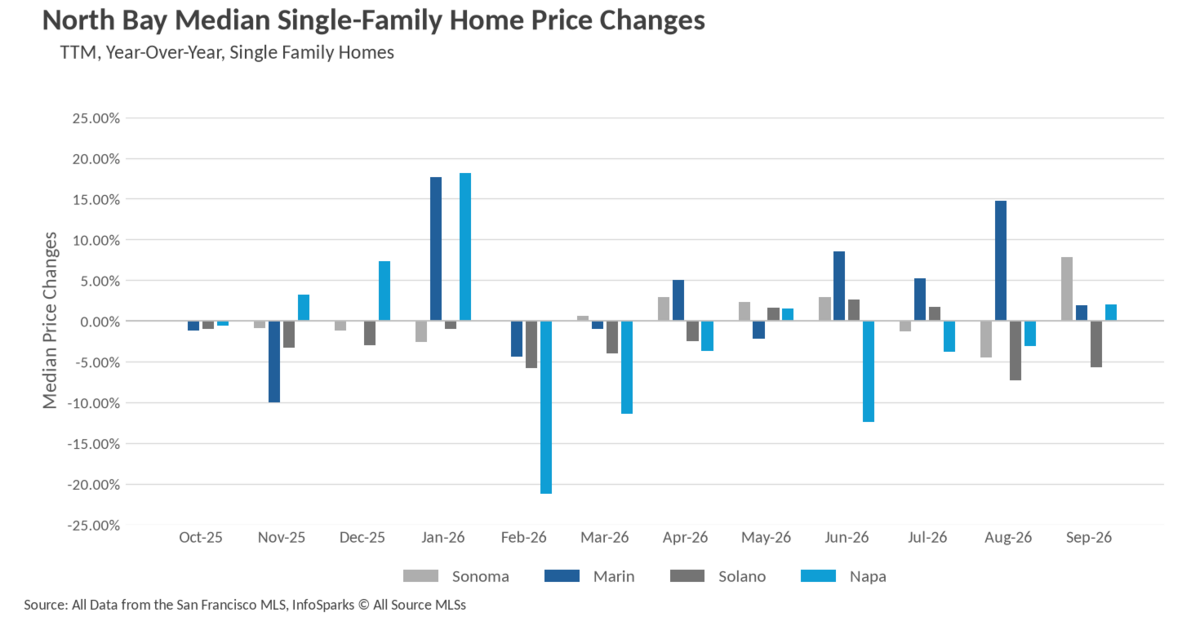
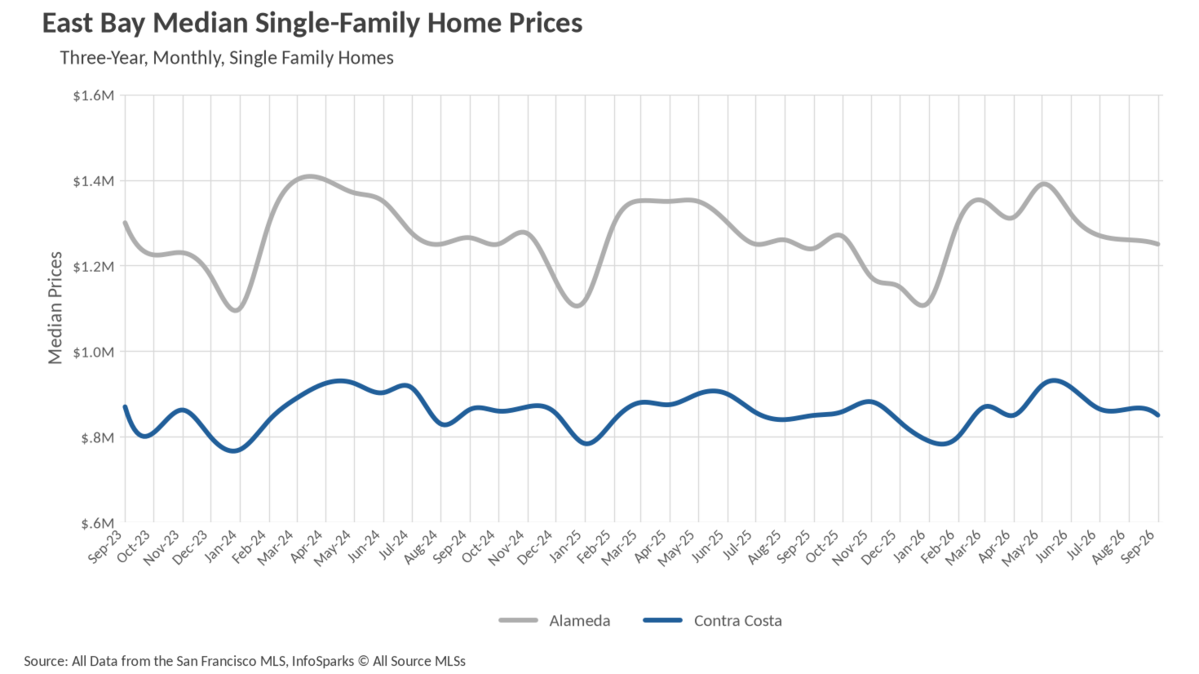
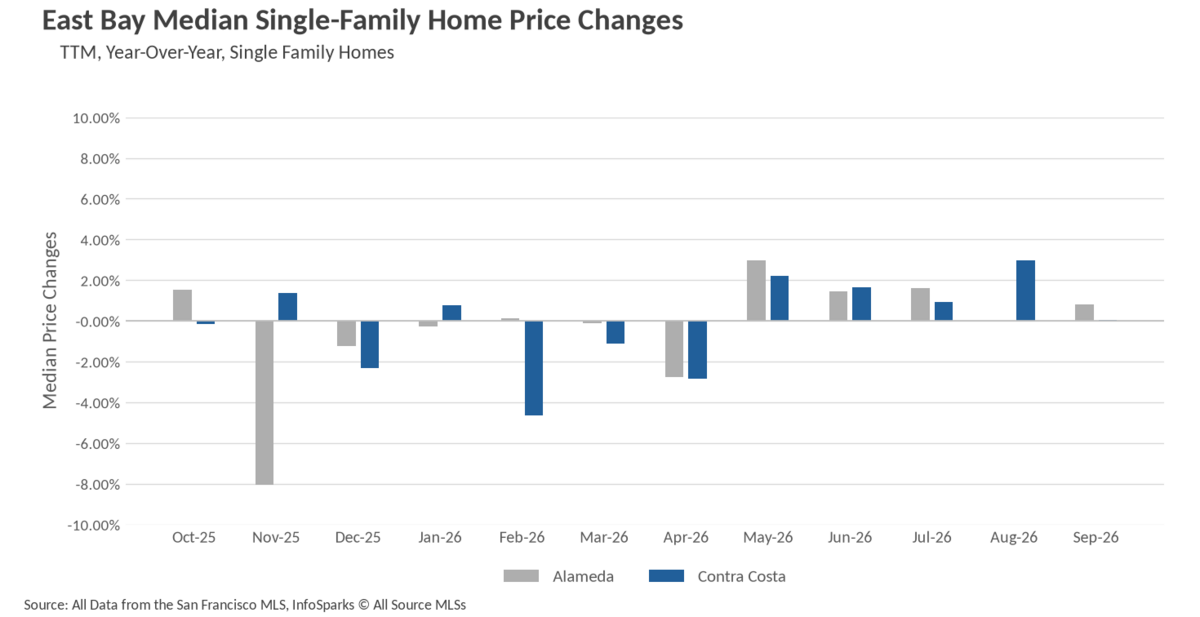
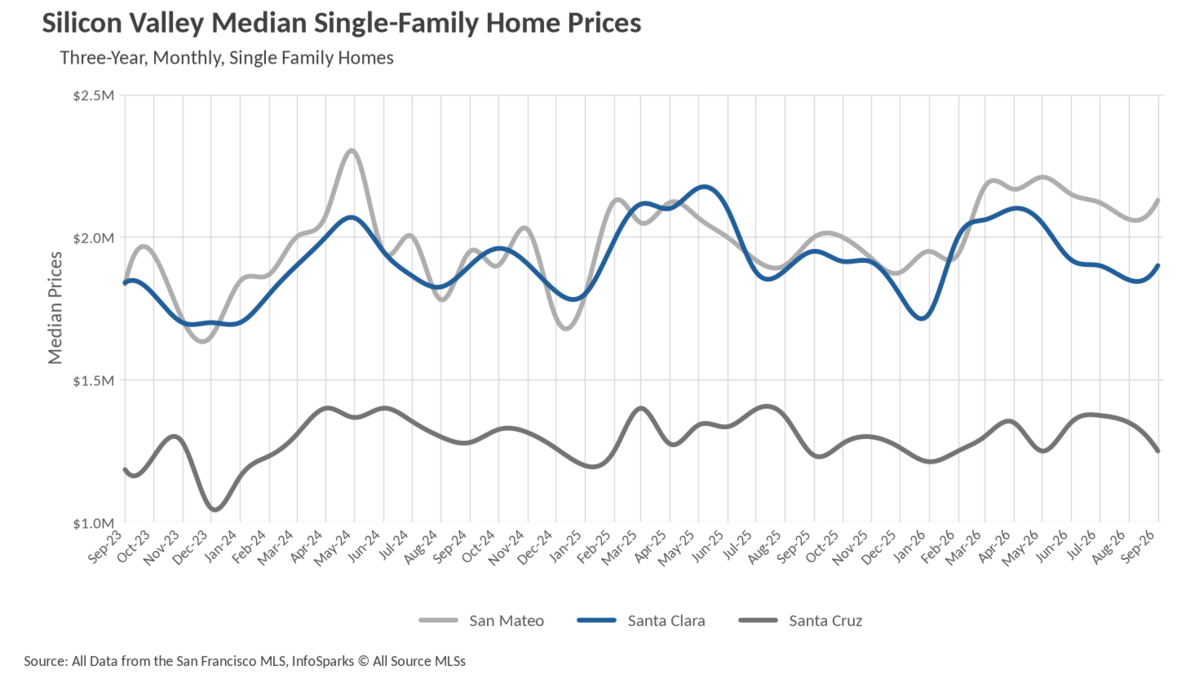
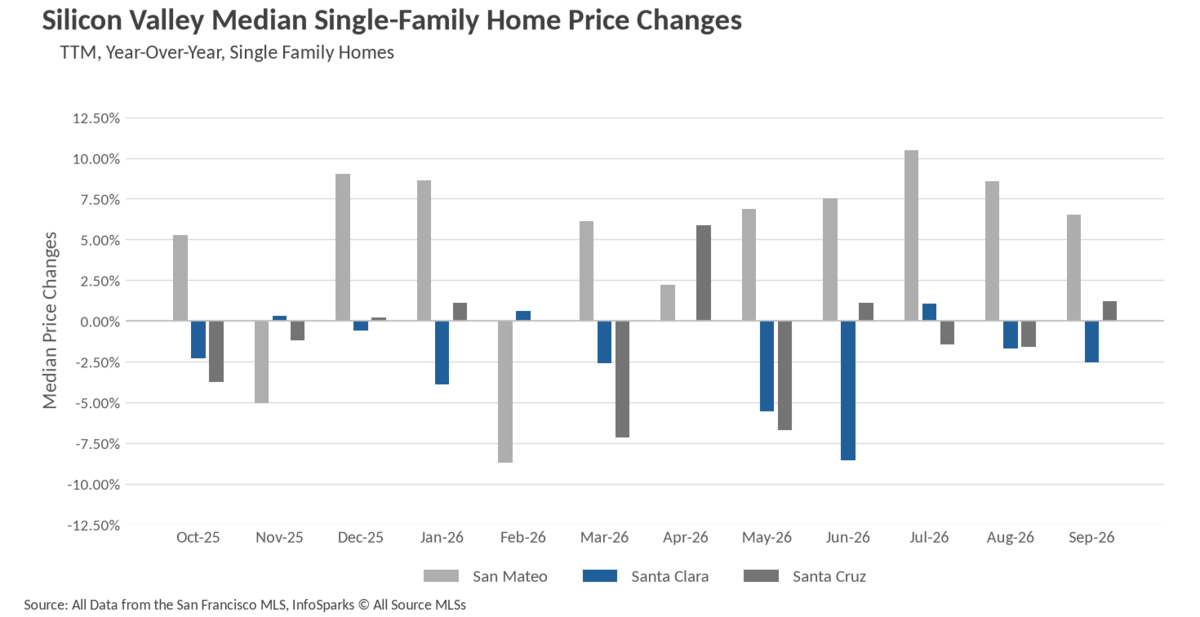
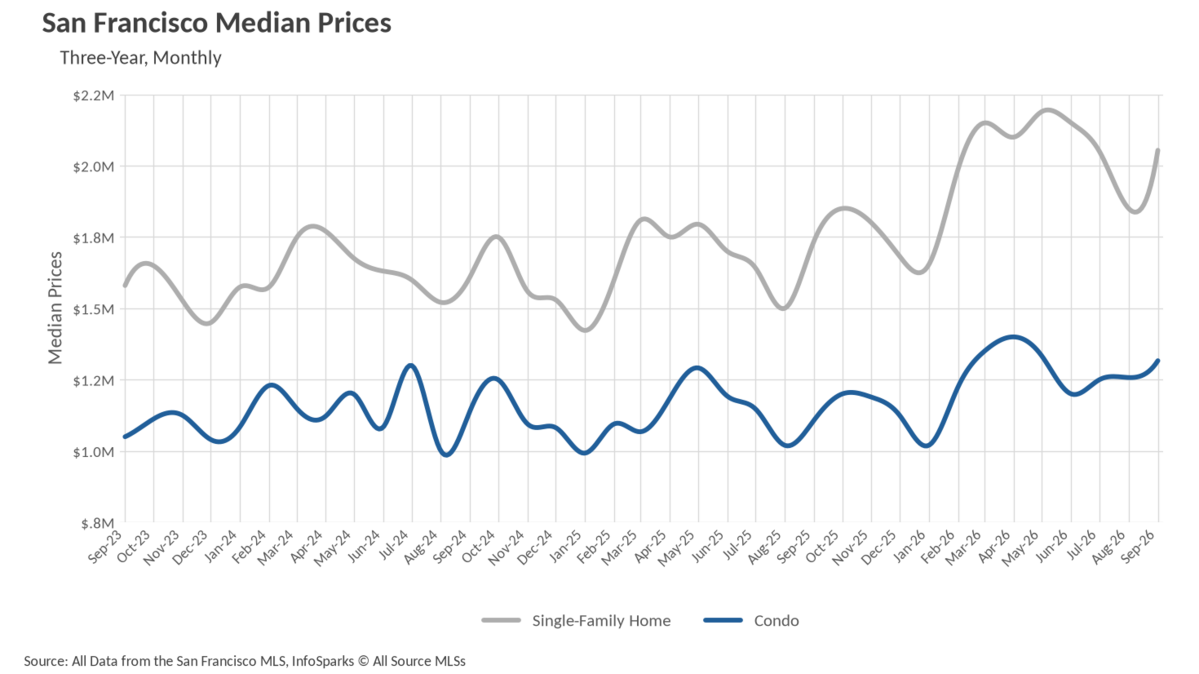
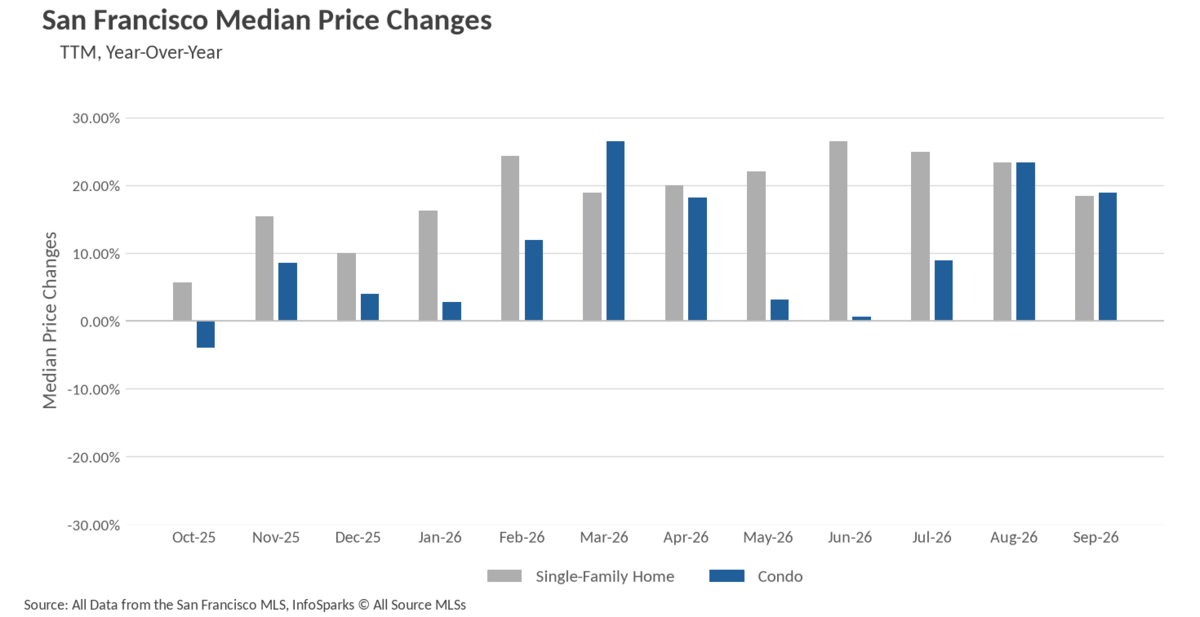
The headline from September is that detached housing across the Bay Area is still finding buyers at or above last year's prices, while attached housing outside of San Francisco and Alameda County is absorbing the pressure. San Francisco delivered the most dramatic single-family move, recovering from a soft August to post a median of $2,054,000, an 11.03% monthly jump and 18.39% above last September. San Mateo County remains the region's priciest market at $2,129,000, up 6.50% year over year, and Sonoma County turned in the strongest percentage gain in the North Bay at $865,000, a 7.79% annual increase and a 9.08% rebound from August. Marin County held at $1,750,000, Napa reached $918,000, and Santa Cruz County posted $1,250,000, all modestly higher than a year ago. The flat-to-lower group is smaller but worth noting: Santa Clara County slipped 2.56% to $1,900,000, Alameda County was essentially unchanged at $1,250,000, Contra Costa County was flat at $850,500, and Solano County gave back 5.74% to $575,000.
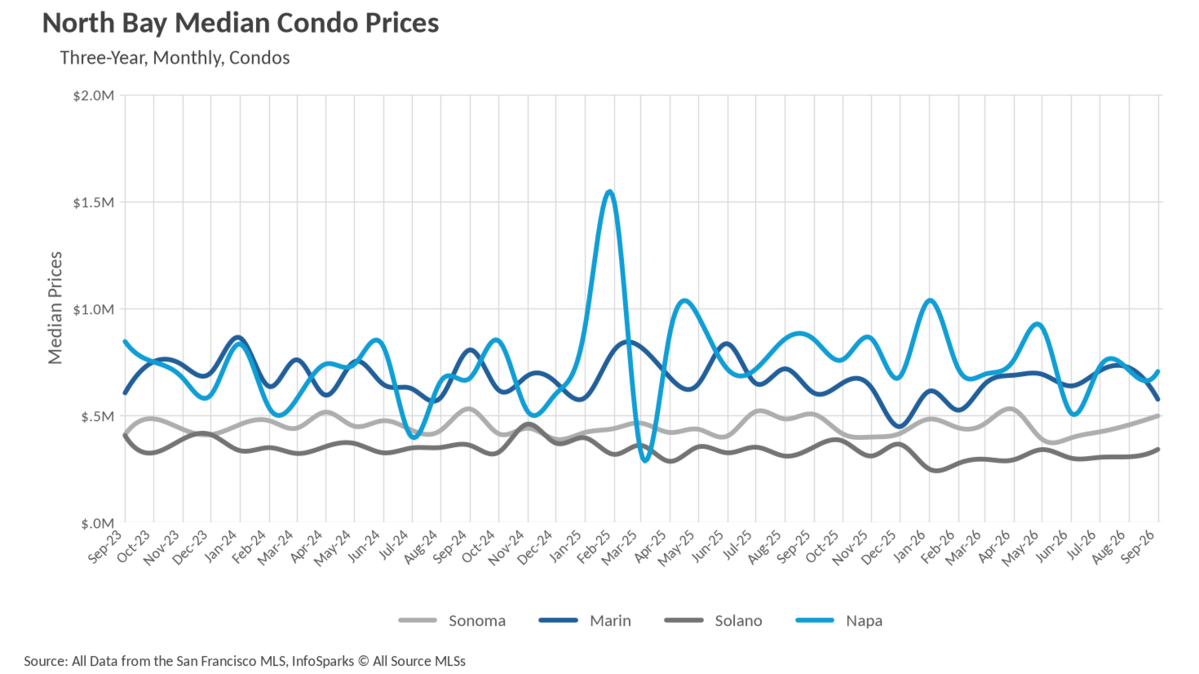
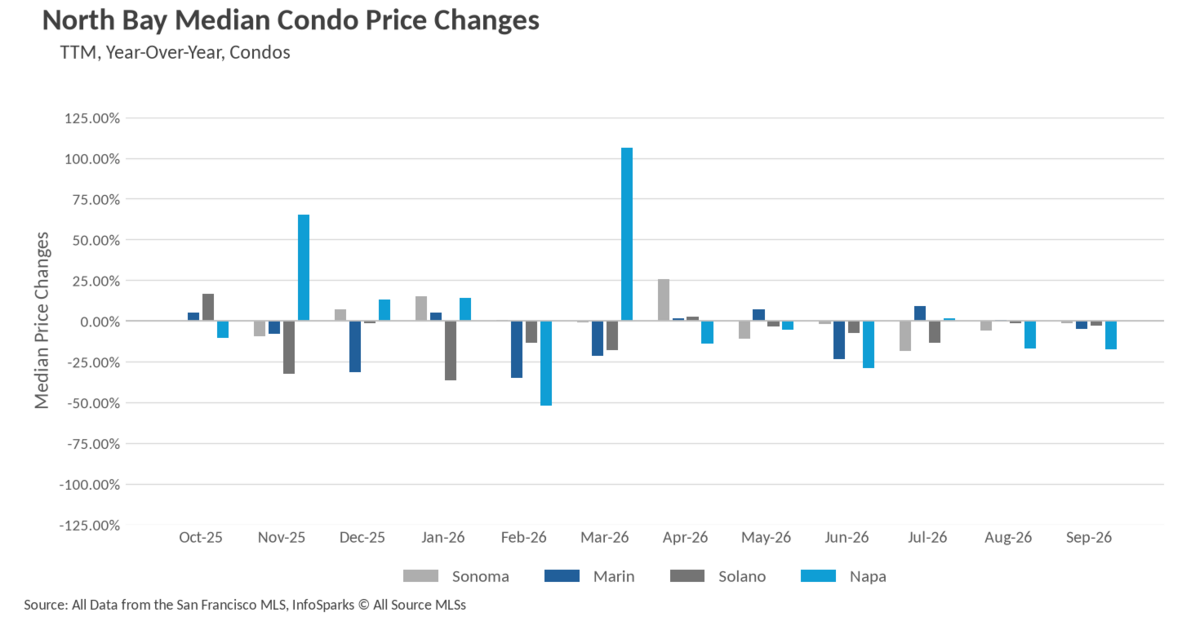
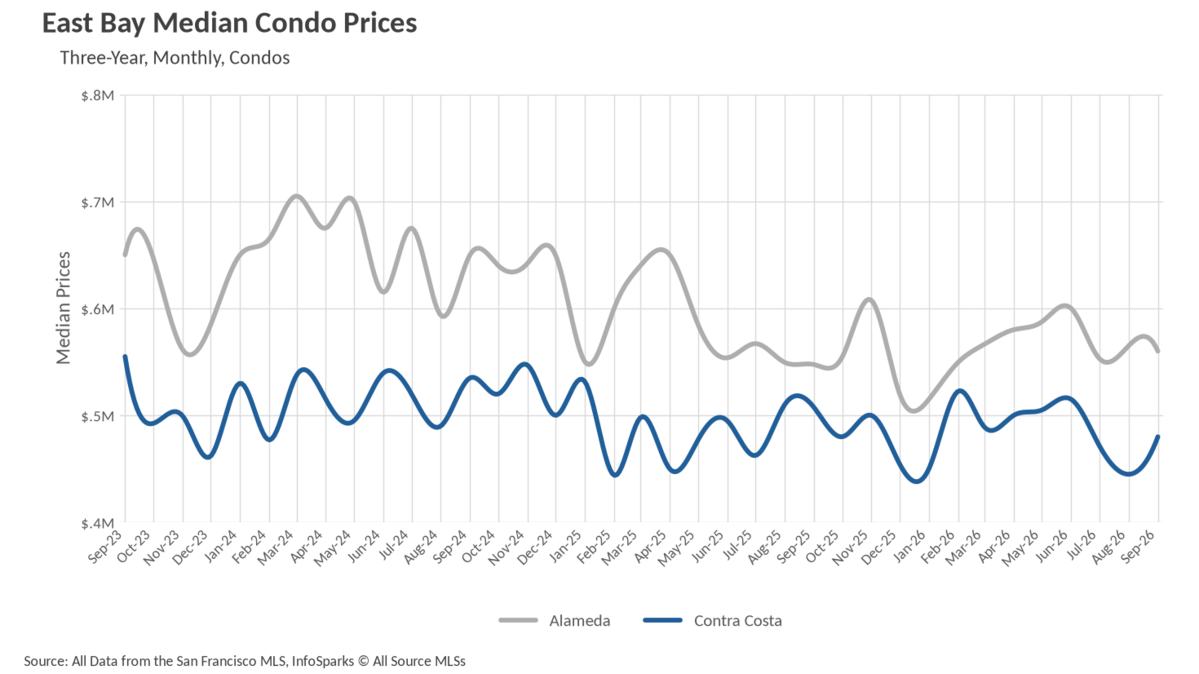
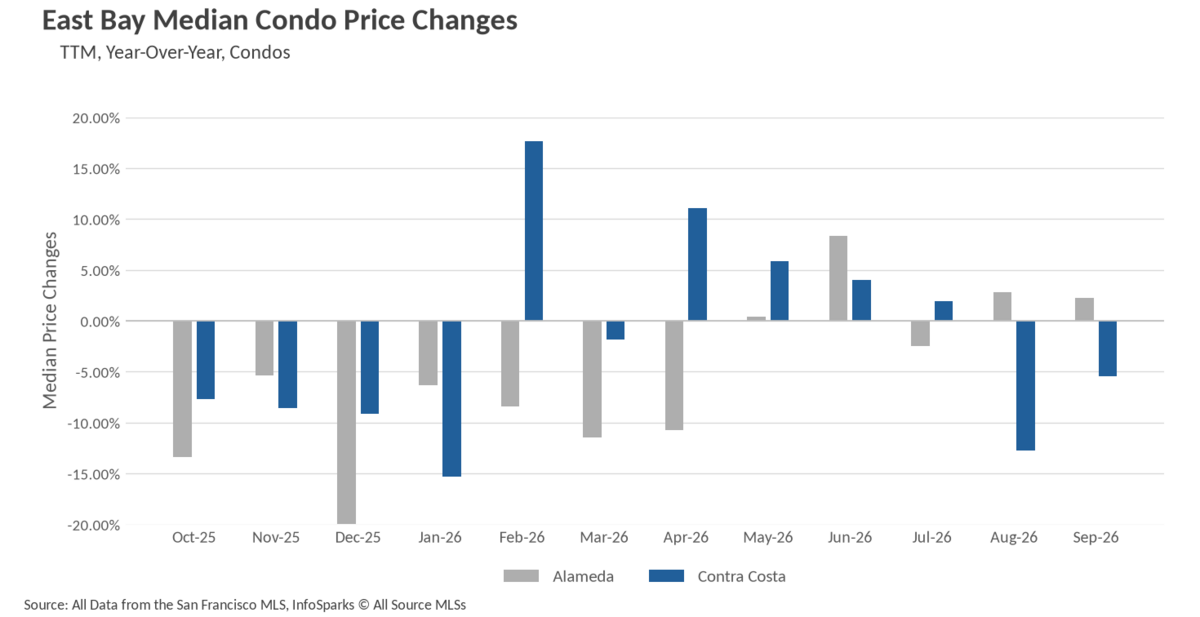
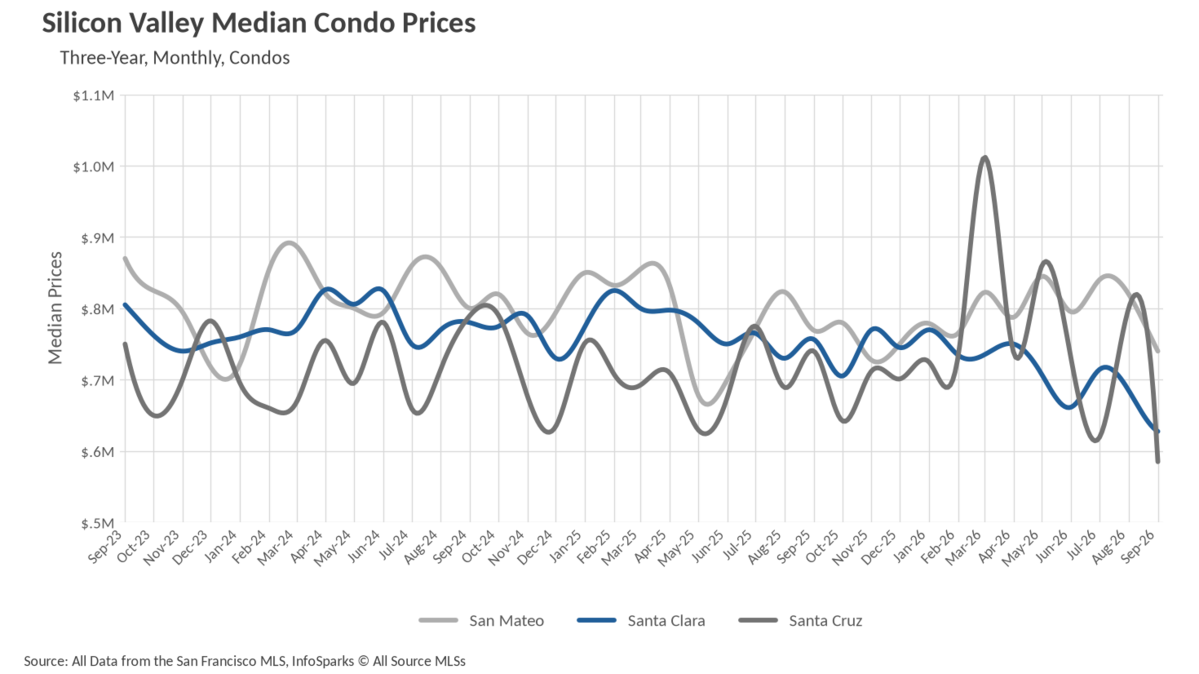
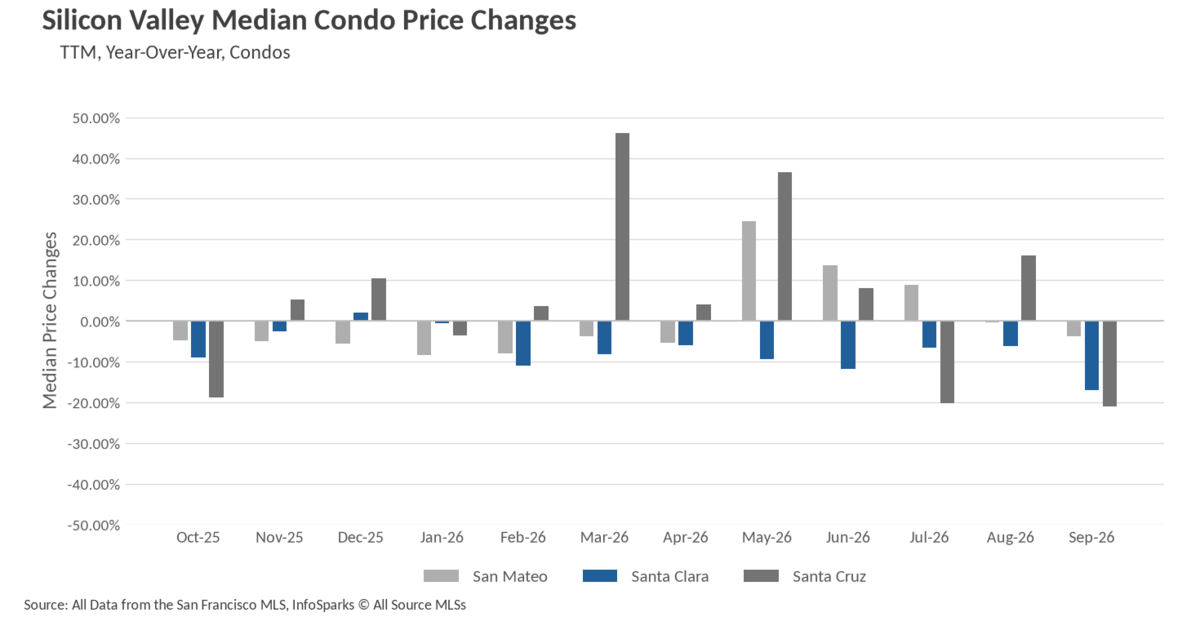
Condos are where the divergence becomes stark. San Francisco condos climbed to a median of $1,316,500, their third consecutive monthly gain and an 18.87% year-over-year increase, while Alameda County condos rose 2.28% to $560,000. Everywhere else the direction was down. Santa Cruz County condos fell 20.95% to $585,000, Napa County dropped 17.54% to $705,000, and Santa Clara County declined 17.05% to $627,500, its lowest reading in three years of data. Milder declines showed up in Contra Costa (down 5.42% to $480,000), Marin (down 4.88% to $575,000), San Mateo (down 3.77% to $740,000), Solano (down 3.13% to $341,000), and Sonoma (down 1.49% to $497,500). The regional story, then, is not a weakening market so much as a market where buyers are paying up for detached homes and for the urban core, and negotiating hard for almost everything else.
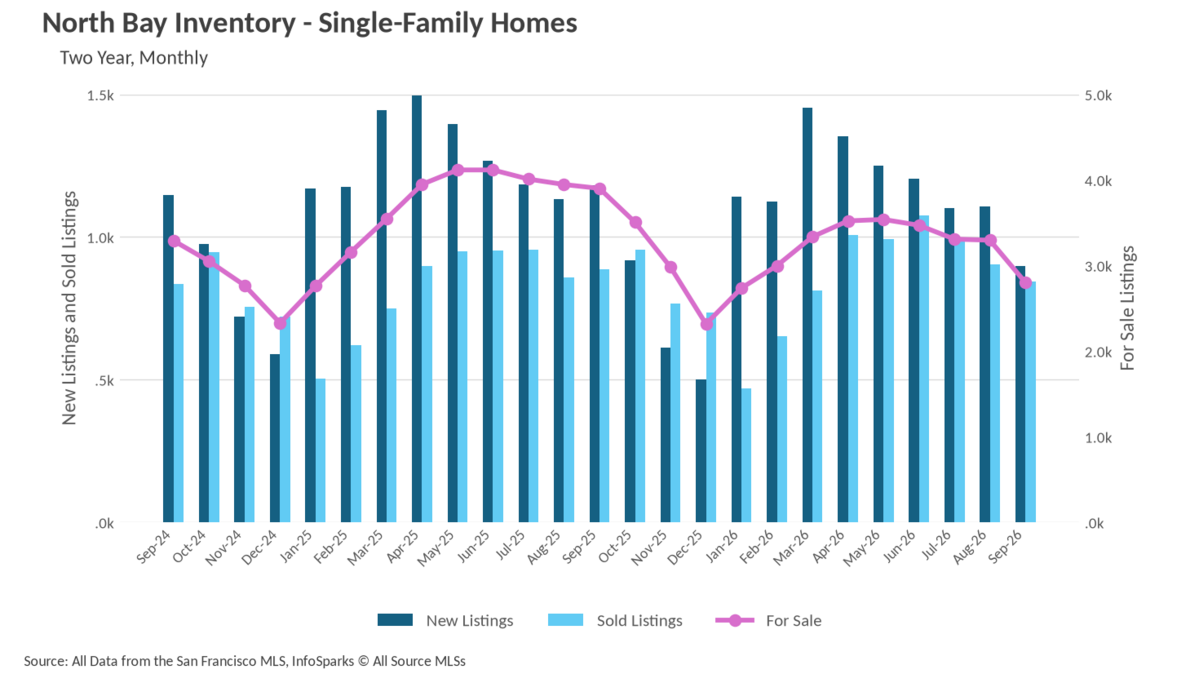
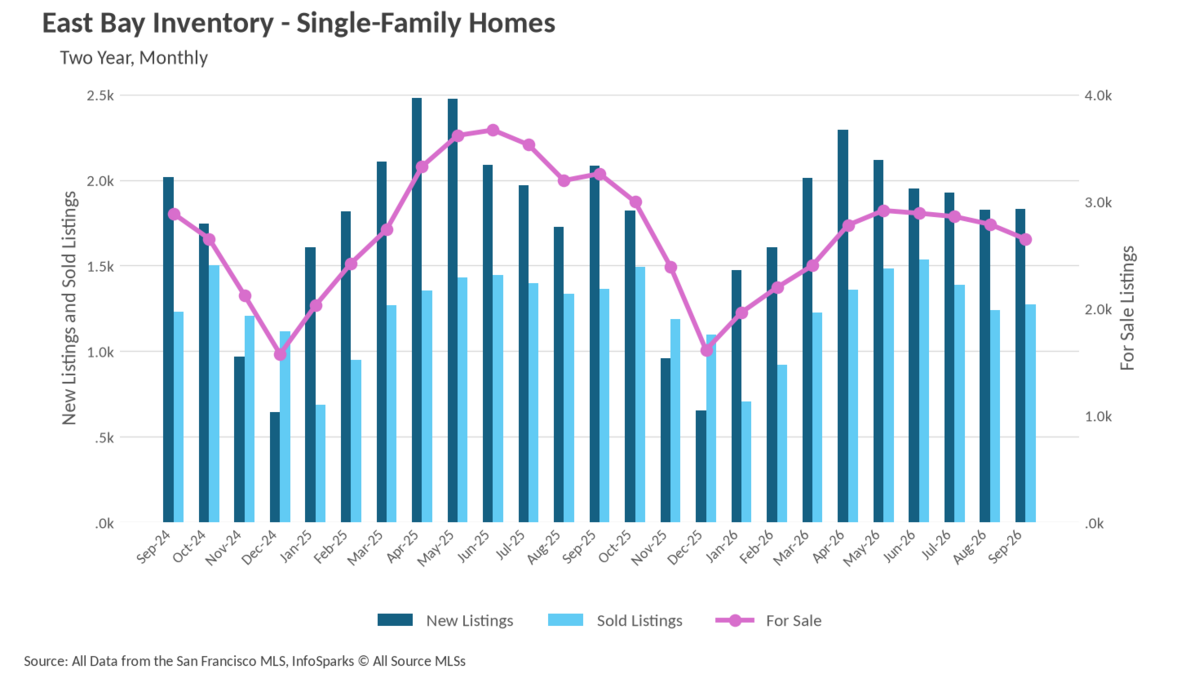
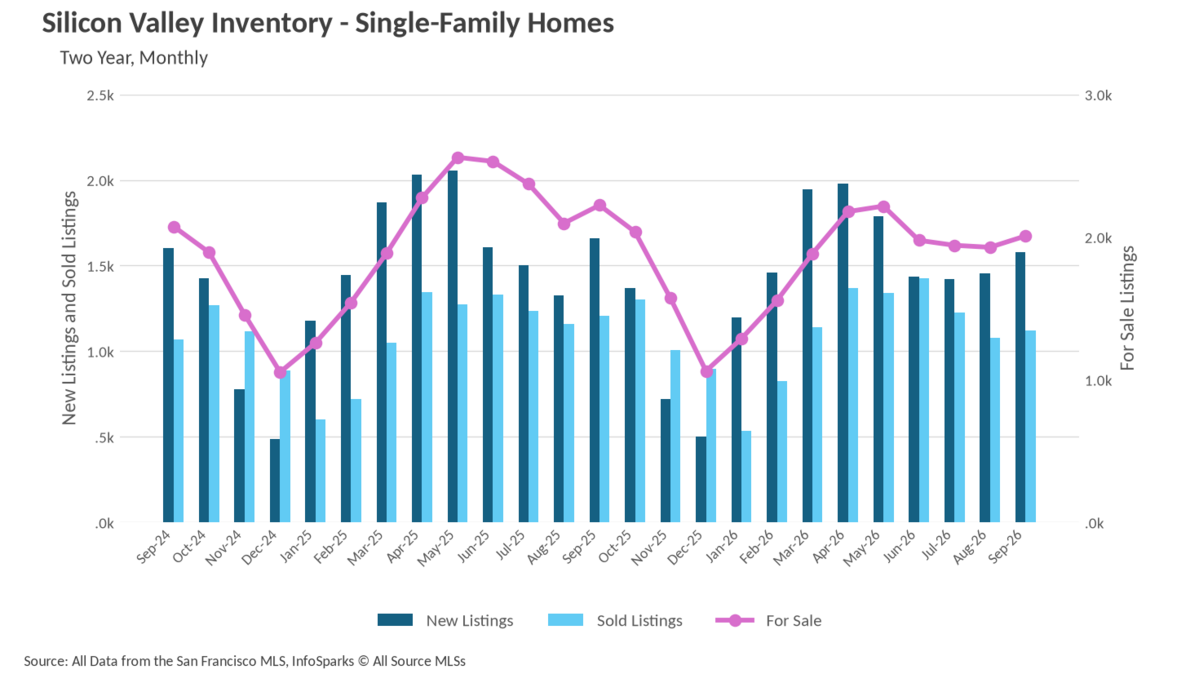
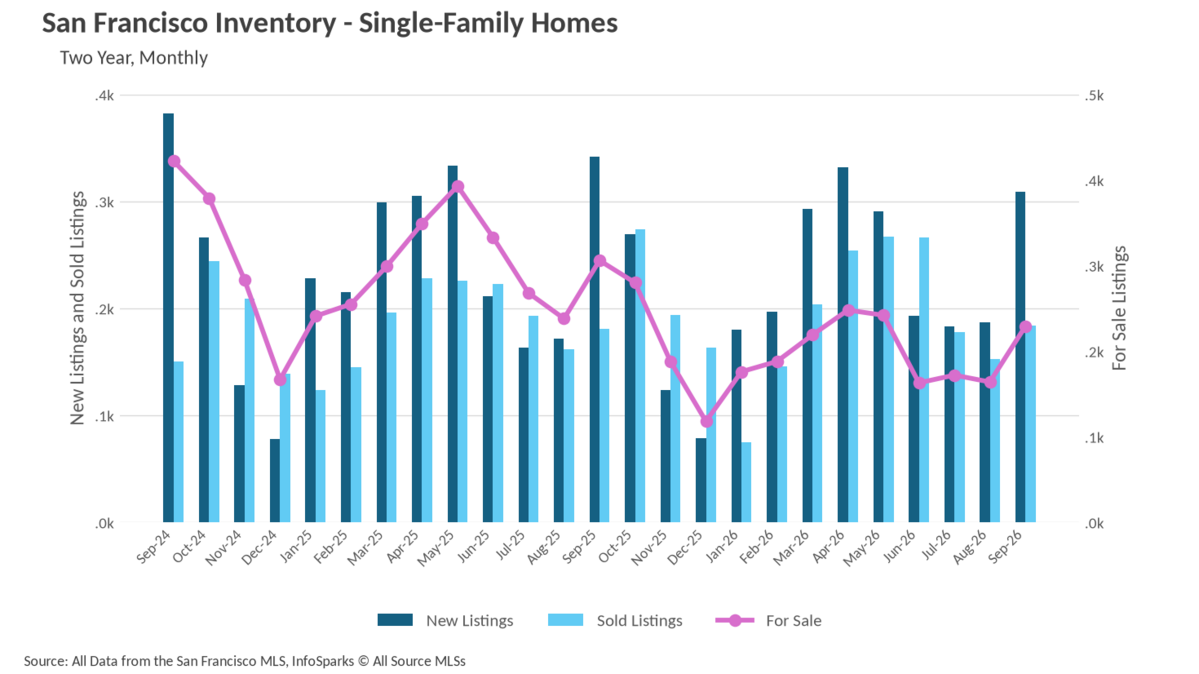
If one number explains September, it is the inventory count. Single-family homes for sale fell in every corner of the region, with the North Bay leading the contraction at 2,803 units, down 28.15% from 3,901 a year ago and down nearly 15% from August alone. San Francisco's 229 listings were off 25.16% year over year despite a healthy seasonal rebound from August's 164. The East Bay carried 2,648 single-family listings, an 18.75% annual decline, and Silicon Valley's 2,007 listings were down 9.72%. Add it up and the region offered roughly 2,000 fewer detached homes than it did last September.
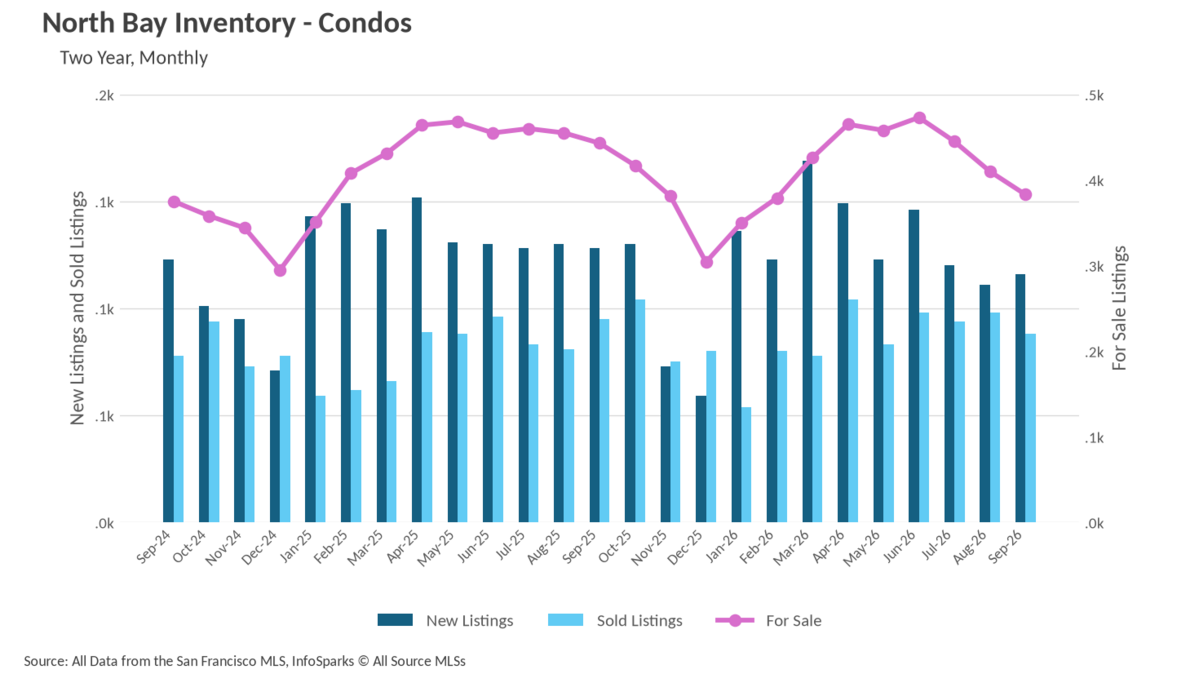
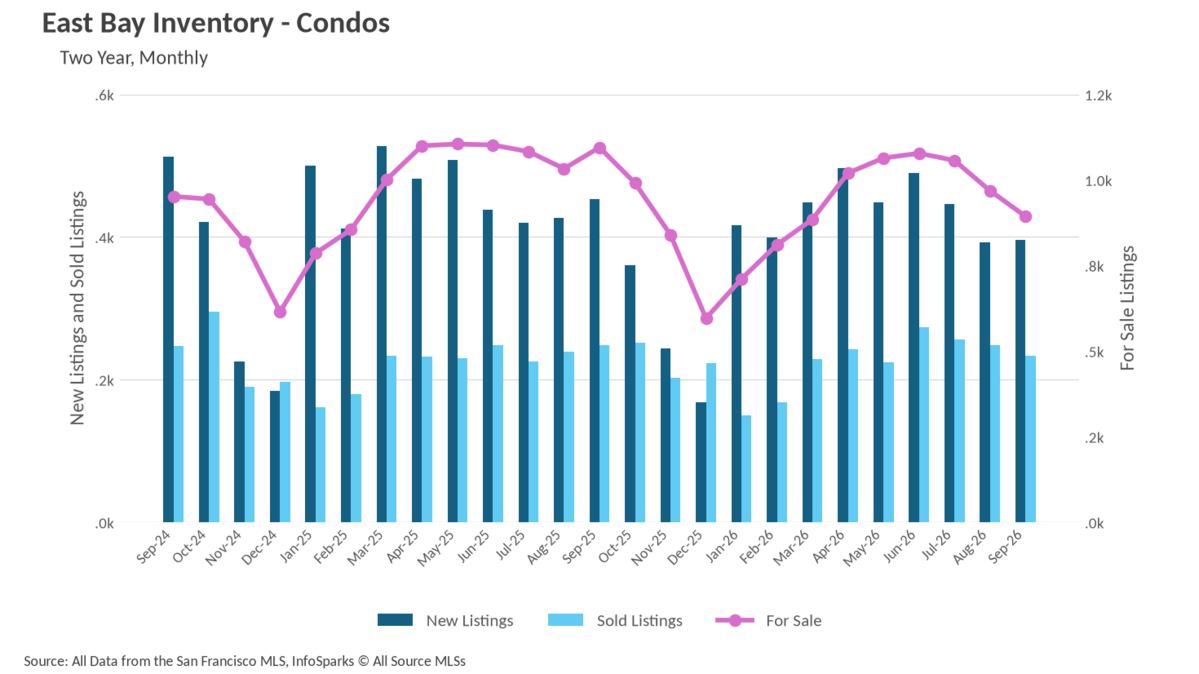
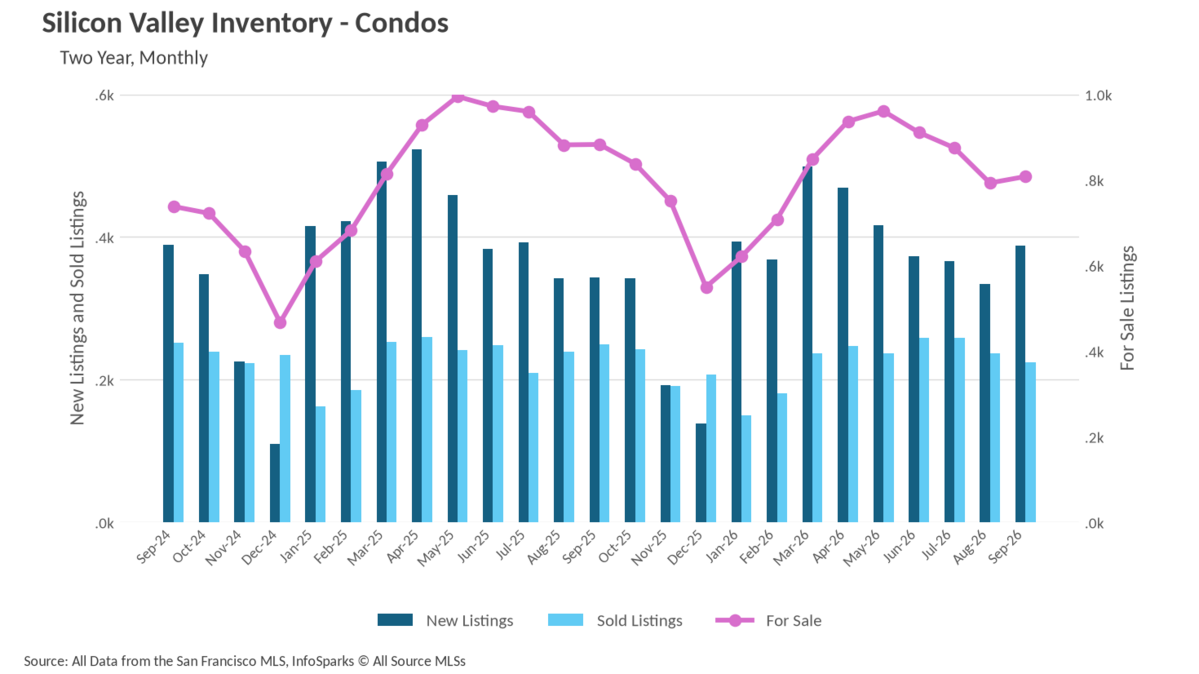
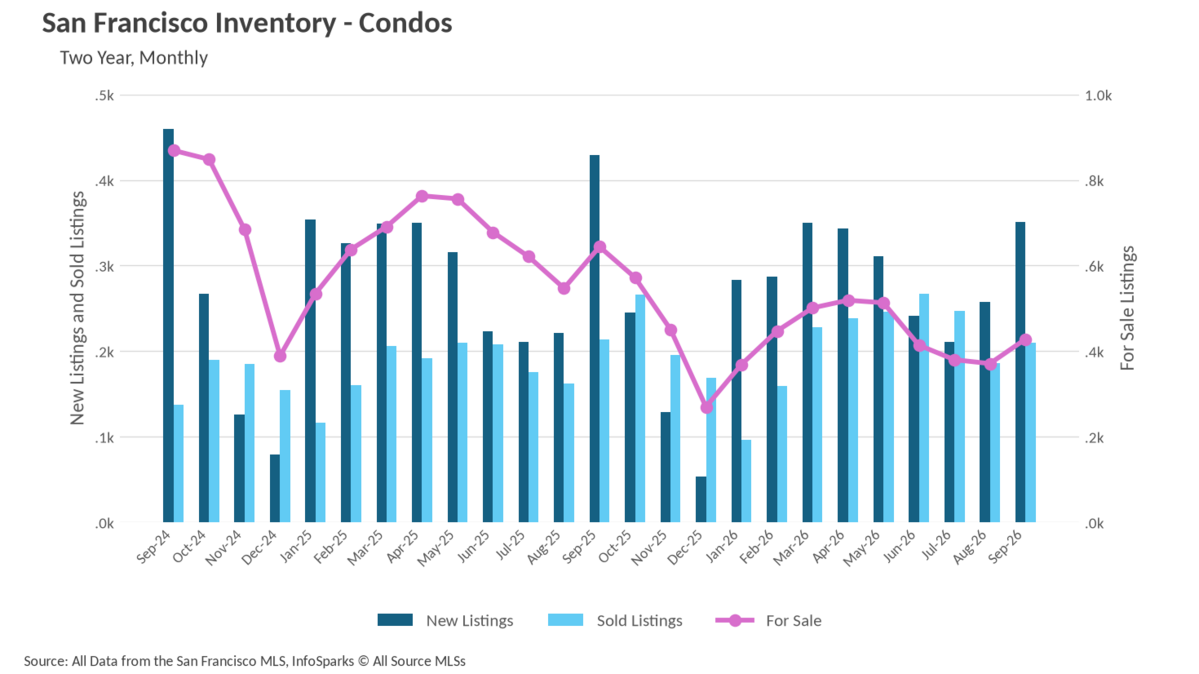
Condo supply followed the same path. San Francisco posted the steepest drop at 428 units, down 33.54% from 644, with the East Bay down 18.36% to 894, the North Bay down 13.54% to 383, and Silicon Valley down 8.49% to 808. The driver is sellers, not buyers. New single-family listings fell 24.05% in the North Bay, 12.06% in the East Bay, 9.65% in San Francisco, and 4.88% in Silicon Valley, while closed sales held far steadier, off just 4.96% in the North Bay, 6.67% in the East Bay, 7.13% in Silicon Valley, and essentially flat in San Francisco at 184 versus 181. When listings contract faster than sales, prices tend to hold, and that is precisely what the September medians show. The one bright spot for buyers is that fall restocking did arrive, with for-sale counts rising month over month in both San Francisco and Silicon Valley and new listing activity picking up in both markets.
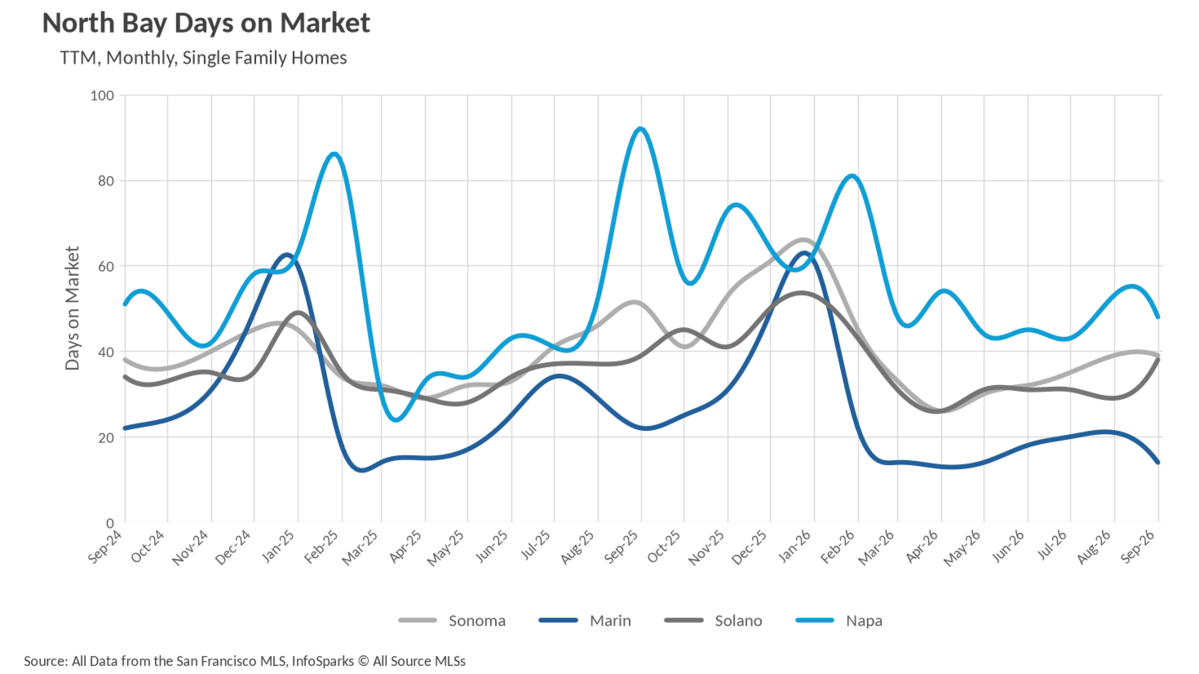
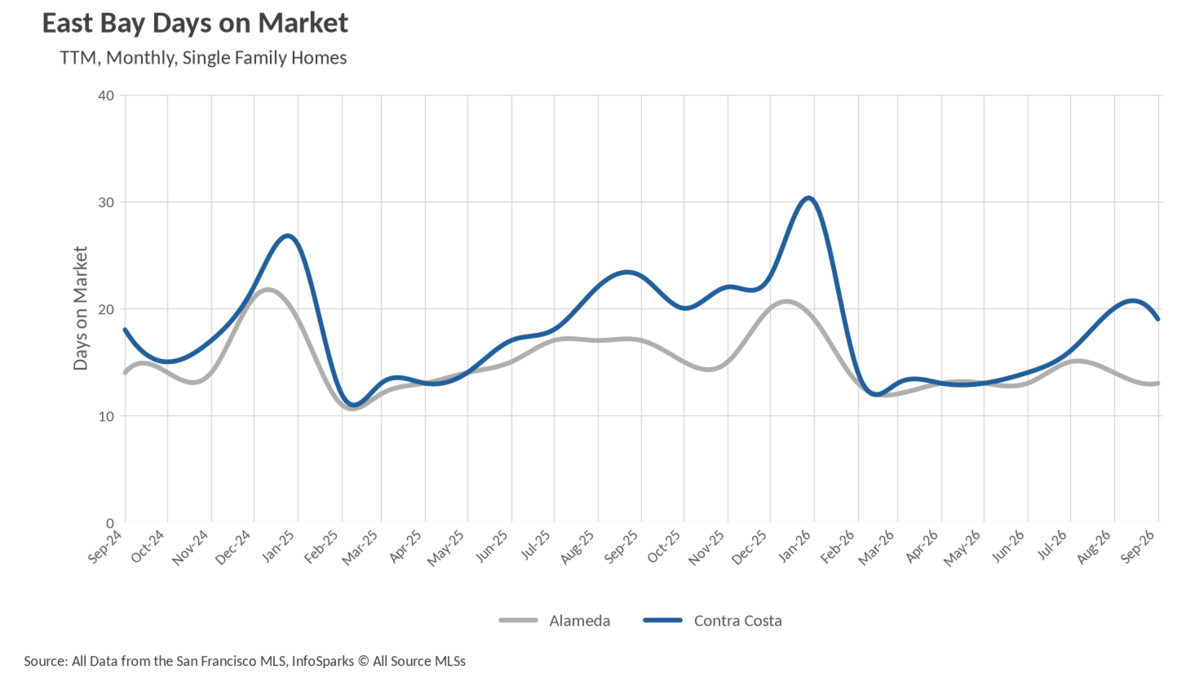
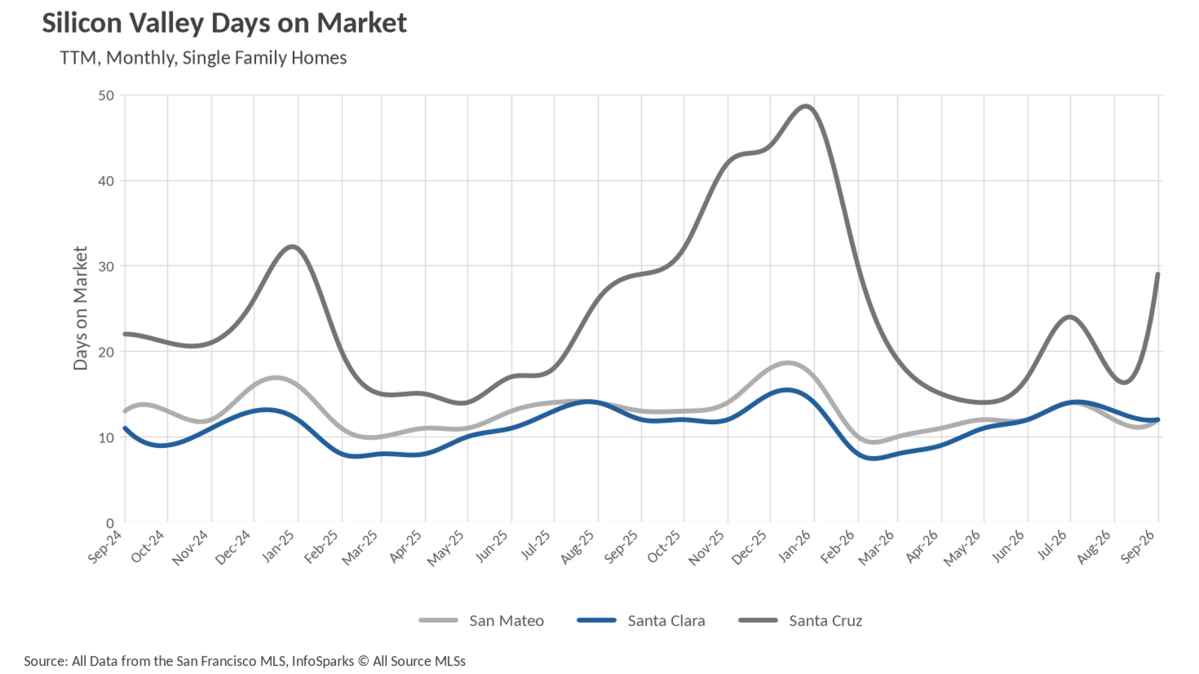
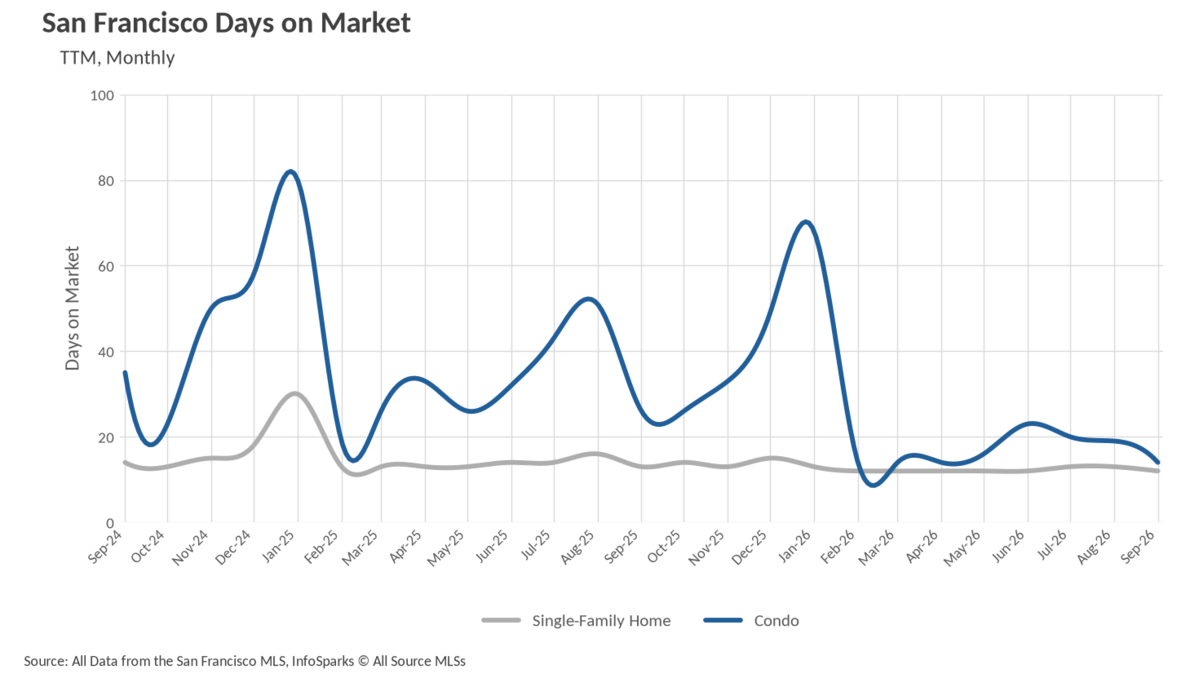
Marketing times tightened almost everywhere. San Francisco, San Mateo County, and Santa Clara County all averaged 12 days for single-family homes, Alameda County came in at 13 days, and Marin County posted just 14 days, a 36.36% improvement over last September and the fastest pace Marin has recorded in two years. Contra Costa County followed at 19 days, down 17.39% year over year. The slower markets are the ones you would expect given geography and price point: Santa Cruz County at 29 days, Solano at 38, Sonoma at 39, and Napa at 48, though Napa's figure represents the single most dramatic improvement in the region, down 47.83% from 92 days a year ago.
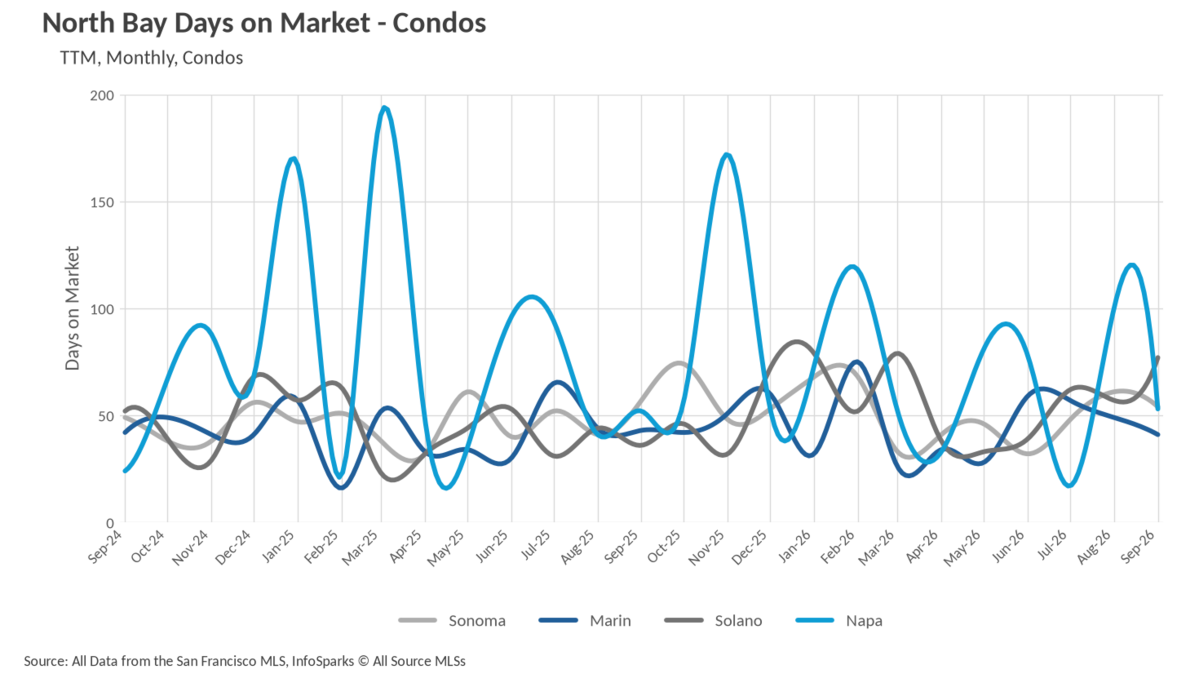
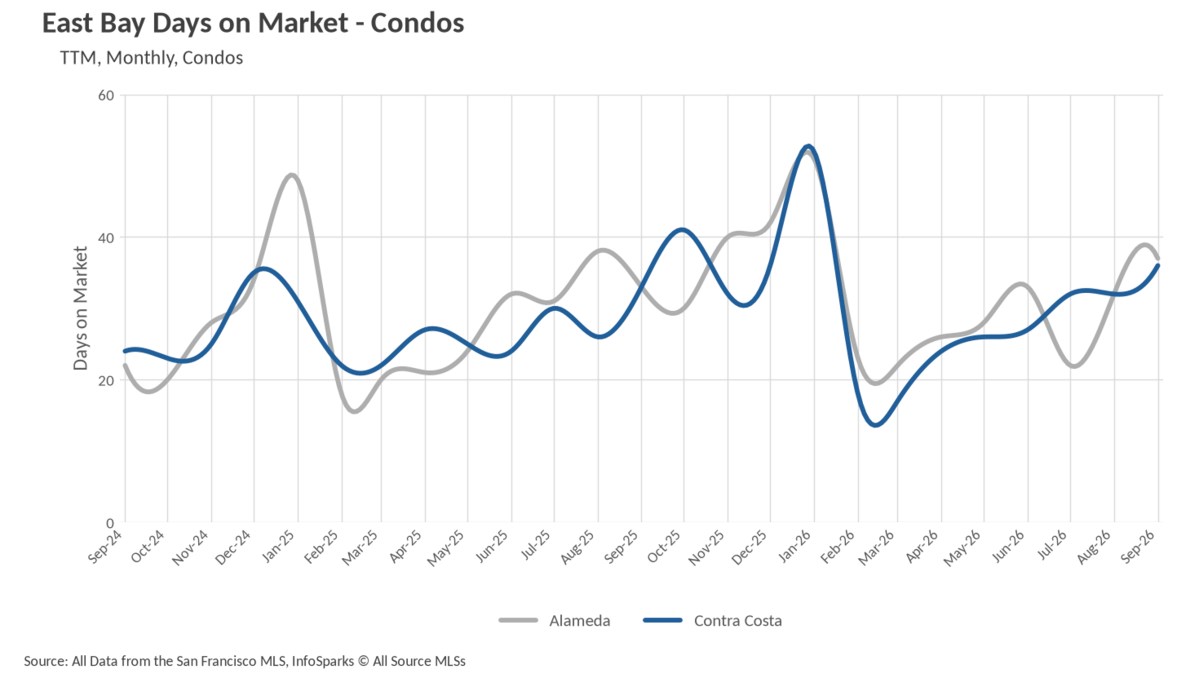
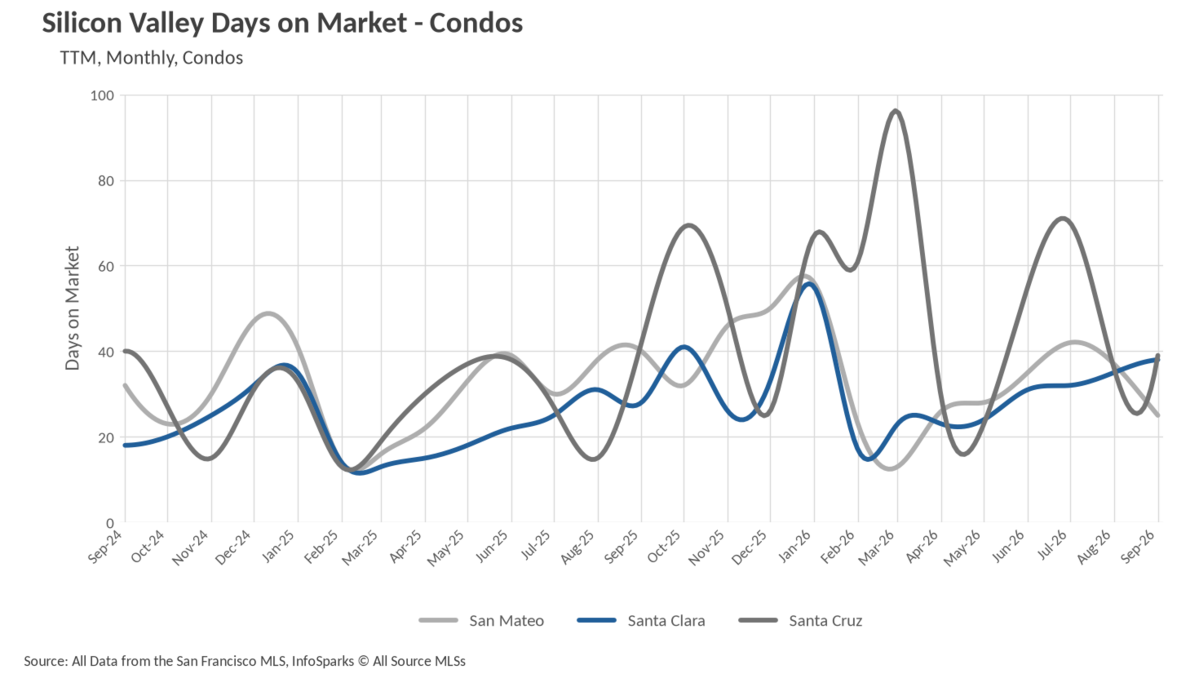
The condo picture is far more varied, and it maps closely to the pricing story. San Francisco condos sold in an average of 14 days, a 46.15% improvement from 26 days last September and one of the fastest readings in that market's history, essentially closing the gap with detached homes. San Mateo County condos improved 37.50% to 25 days. From there the pace lengthens considerably: Contra Costa at 36 days, Alameda at 37 (up 12.12% year over year), Santa Clara at 38 (up 35.71%), Santa Cruz at 39, Marin at 41, Napa at 53, Sonoma at 54, and Solano at 77 days, more than double last September's 36. Buyers shopping for attached homes outside the city still have the luxury of time that detached-home buyers simply do not.
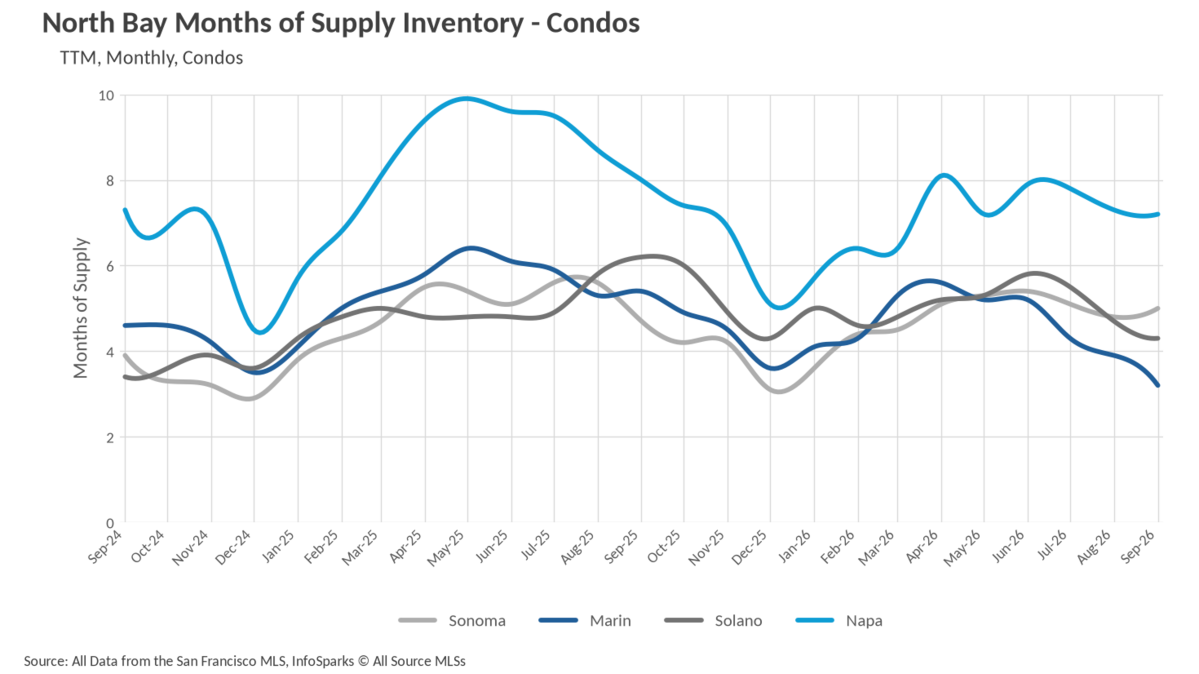
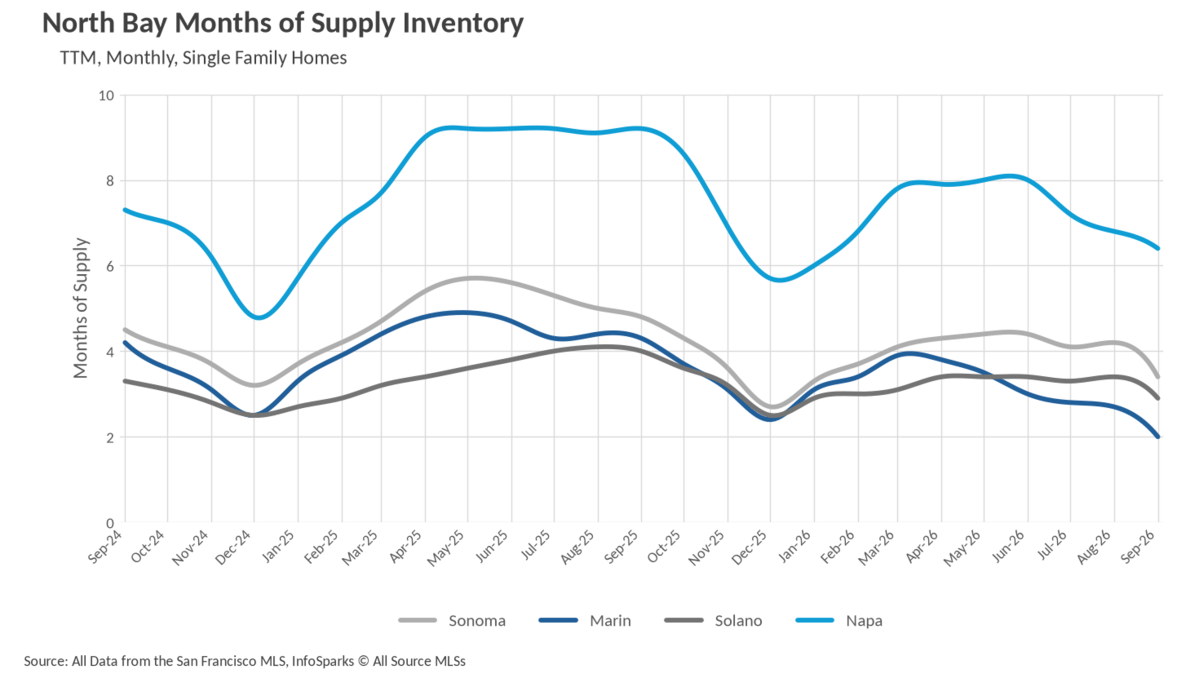
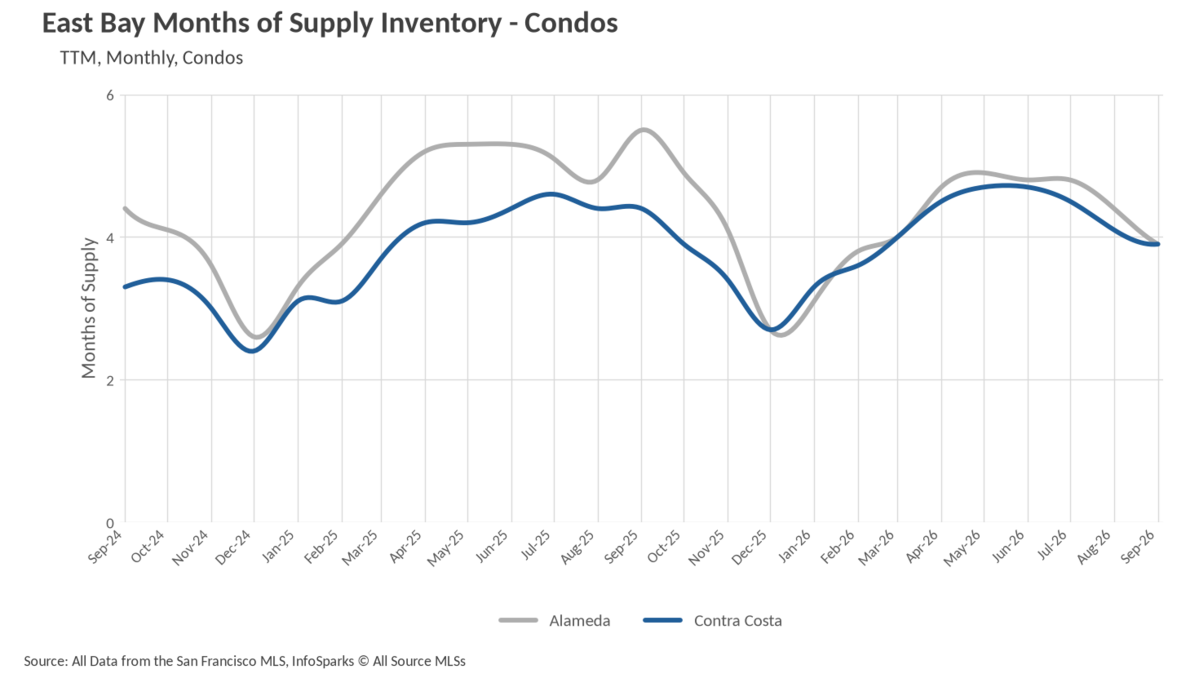
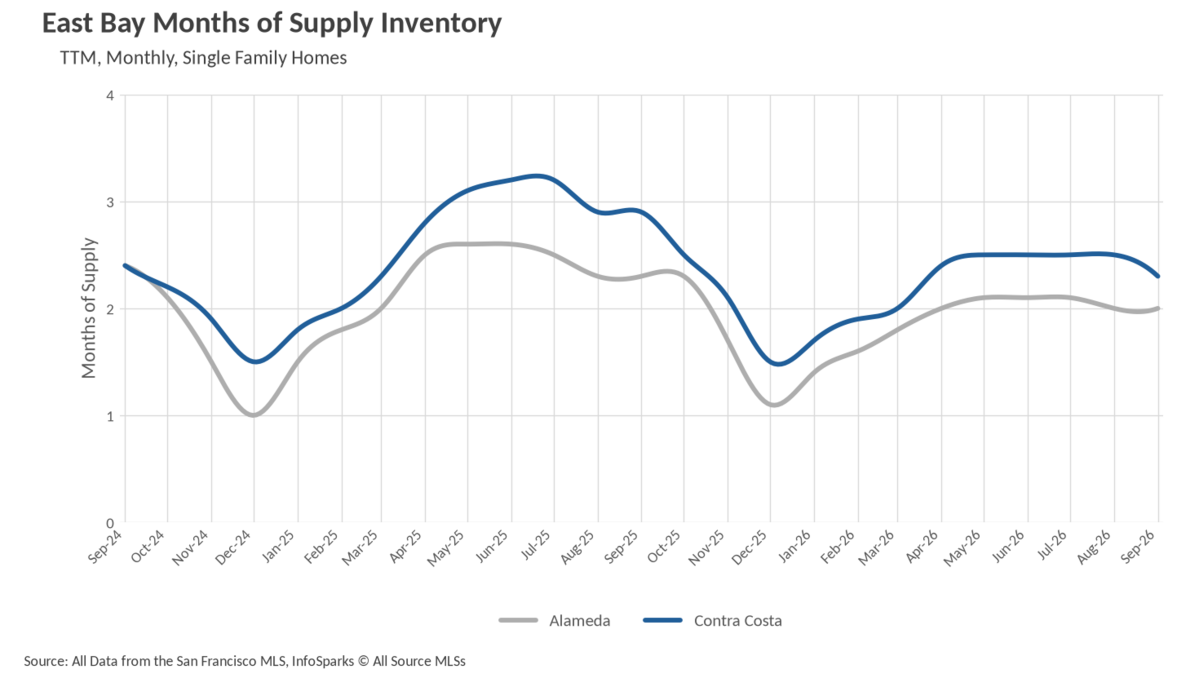
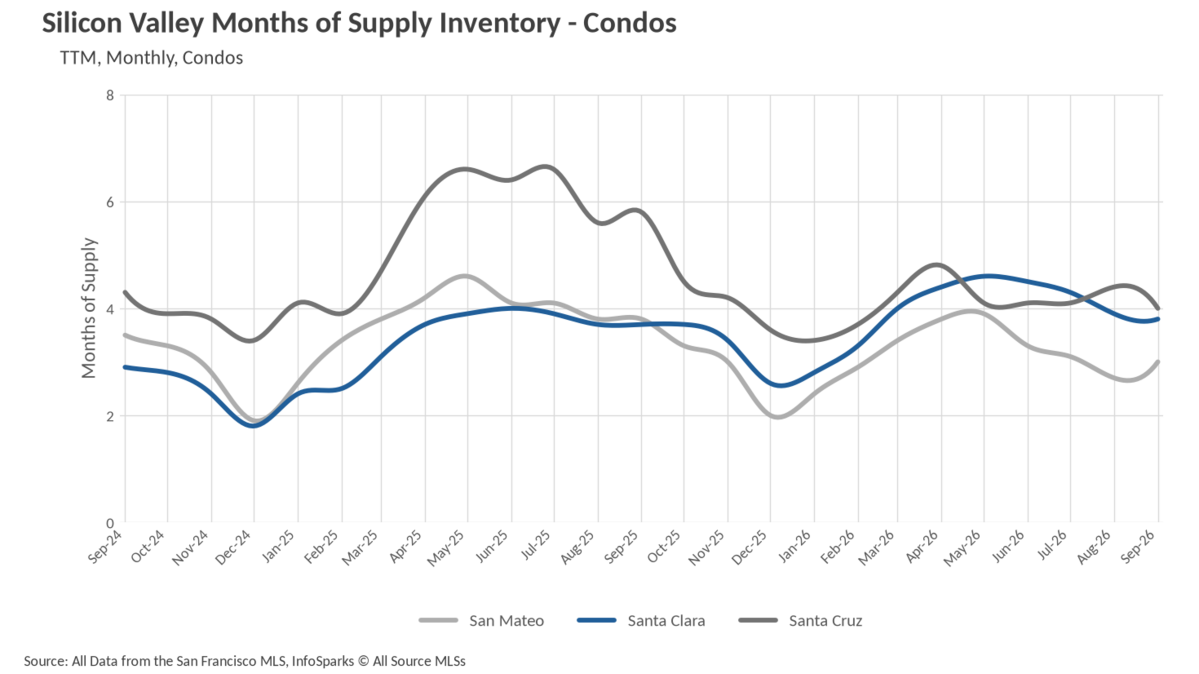
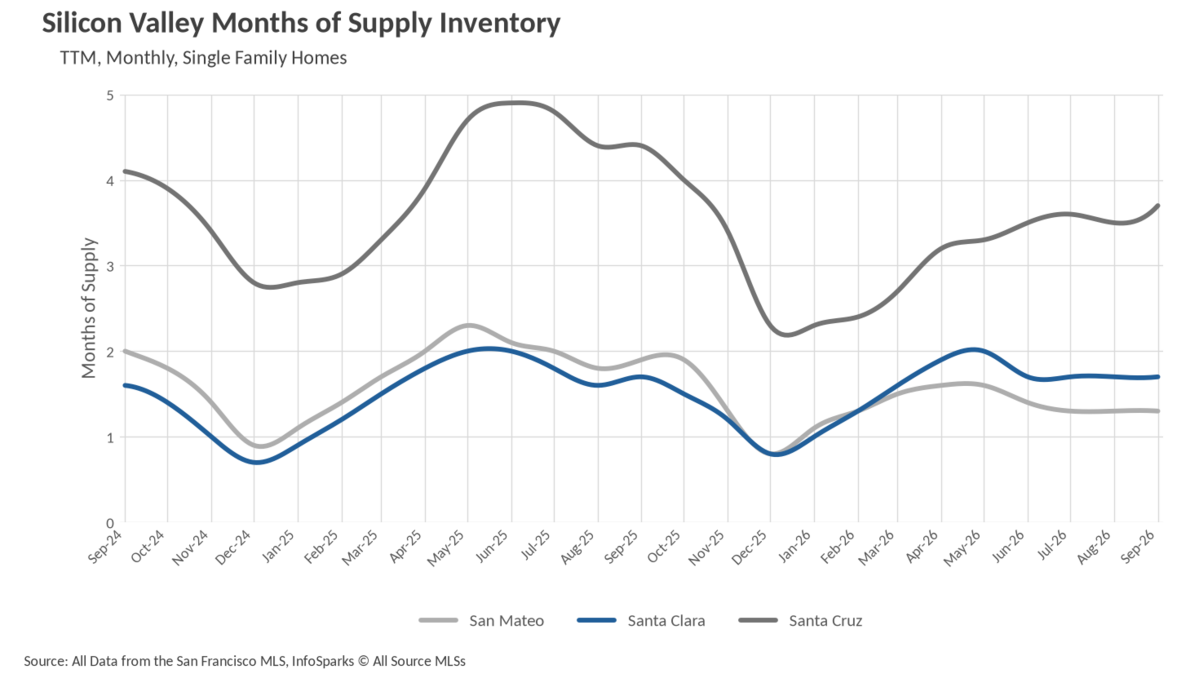
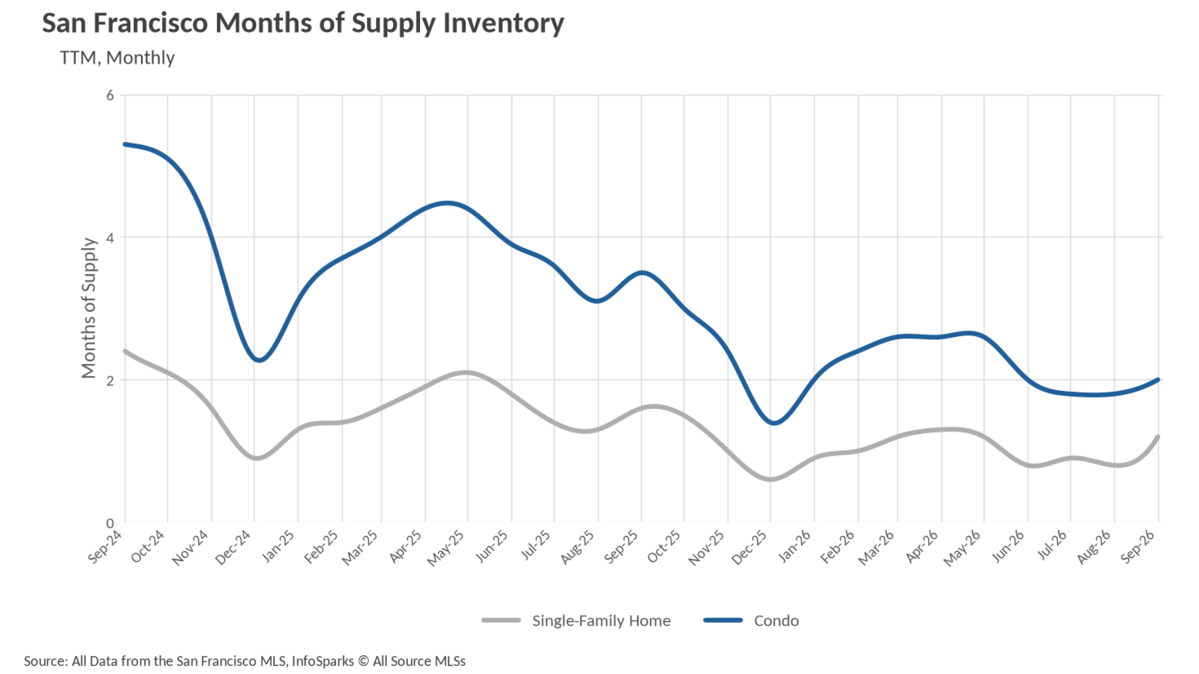
When determining whether a market is a buyers’ market or a sellers’ market, we look to the Months of Supply Inventory (MSI) metric. The state of California has historically averaged around three months of MSI, so any area with at or around three months of MSI is considered a balanced market. Any market that has lower than three months of MSI is considered a seller’s market, whereas markets with more than three months of MSI are considered buyers’ markets.
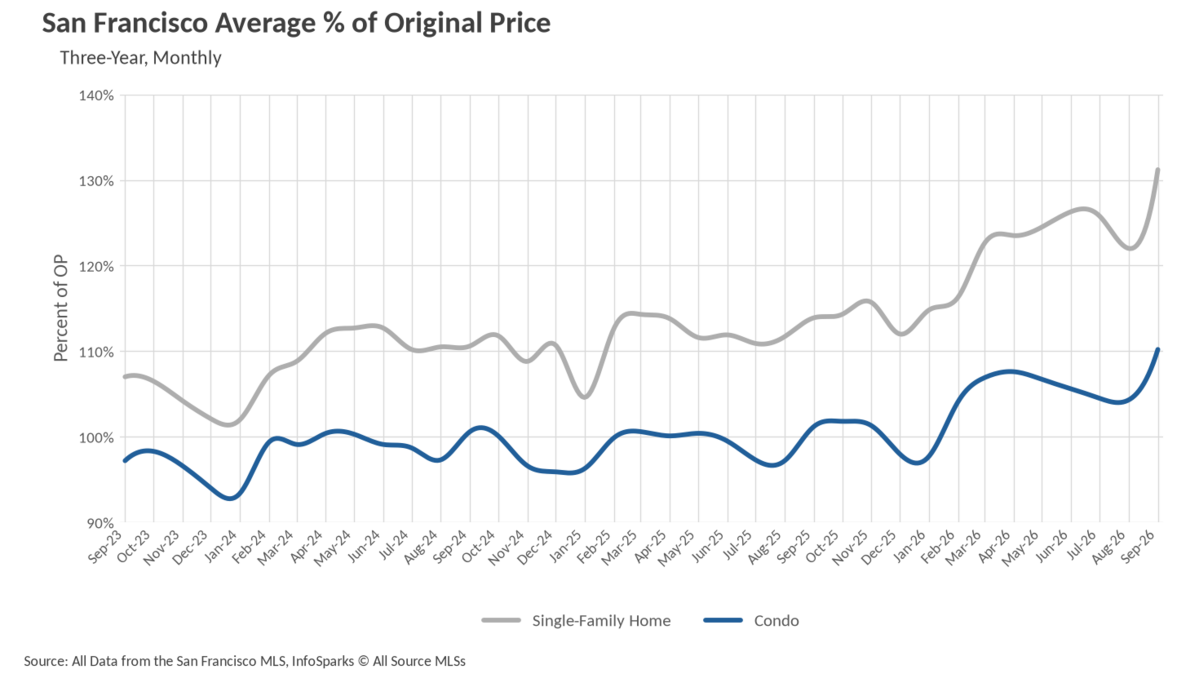
By that standard, the Bay Area's single-family market is overwhelmingly a seller's market this fall. San Francisco leads at 1.2 months of supply, followed closely by San Mateo County at 1.3 months, Santa Clara County at 1.7 months, Alameda County and Marin County both at 2.0 months, Contra Costa County at 2.3 months, and Solano County at 2.9 months. Marin's reading is especially striking, down 53.49% from 4.3 months last September. Sonoma County has moved into balanced territory at 3.4 months, improving from 4.8 months a year ago, while Santa Cruz County sits at 3.7 months and Napa County remains the region's lone pronounced buyer's market at 6.4 months, though even that figure is down 30.43% from last September's 9.2 months. Condos are looser but moving the same direction, with San Francisco at 2.0 months (down 42.86% year over year), San Mateo right at the 3.0 month balance point, and Marin at 3.2 months, while Santa Clara (3.8), Alameda and Contra Costa (3.9 each), Santa Cruz (4.0), Solano (4.3), Sonoma (5.0), and Napa (7.2) all still favor buyers. The practical takeaway heading into the final months of 2026 is a market of two speeds. Anyone pursuing a detached home in San Francisco, Silicon Valley, the East Bay, or Marin should be prepared to compete, move quickly, and in San Francisco's case pay well above asking, where single-family homes closed at an average of 31% over original list price in September. Condo shoppers outside the urban core, meanwhile, retain more negotiating room than they have had in years.
Stay up to date on the latest real estate trends.

Michelle Kim | November 1, 2026
Quick Take: Median home sale prices have declined for the third straight month, slipping to $417,500 in September, though they remain slightly above where they were a … Read more

Michelle Kim | November 1, 2026
Quick Take: Median single-family prices climbed year over year in three of four counties, led by Sonoma County at 7.79% growth, while Solano County slipped 5.74%. Inve… Read more

Michelle Kim | November 1, 2026
Quick Take: Single-family prices are holding roughly flat year over year, with Alameda County at $1,250,000 and Contra Costa County at $850,500, both easing modestly f… Read more

Michelle Kim | November 1, 2026

Michelle Kim | November 1, 2026
Quick Take: The single-family median sale price jumped back above $2 million in September, finishing 18.4% higher than a year ago at $2,054,000. Inventory rebounded se… Read more
Michelle Kim | November 1, 2026
Quick Take: Single-family prices held up across most of the Bay Area in September, led by San Francisco at $2,054,000 (up 18.39% year over year) and San Mateo County a… Read more
You’ve got questions and we can’t wait to answer them.