The Local Lowdown: November 2024
Michelle Kim | December 1, 2024

Michelle Kim | December 1, 2024
Stay up to date on the latest real estate trends.
Michelle Kim | June 20, 2026
Answers to the most common home selling questions, from pricing and preparation to marketing, negotiations, and closing with confidence.

Michelle Kim | June 12, 2026
Buying a home? Get answers to the most common questions about financing, home searches, inspections, closing costs, and what to expect throughout the home buying proce… Read more
Michelle Kim | June 5, 2026
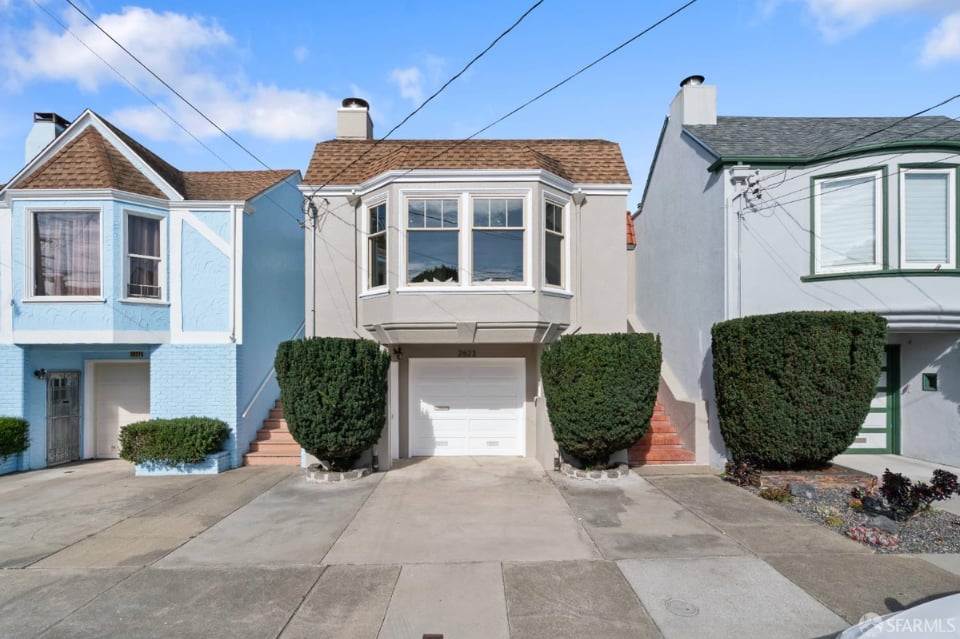
A guide to what buyers should evaluate when purchasing an older San Francisco home, from inspections and insurance to historic charm and long-term ownership.

Michelle Kim | May 31, 2026
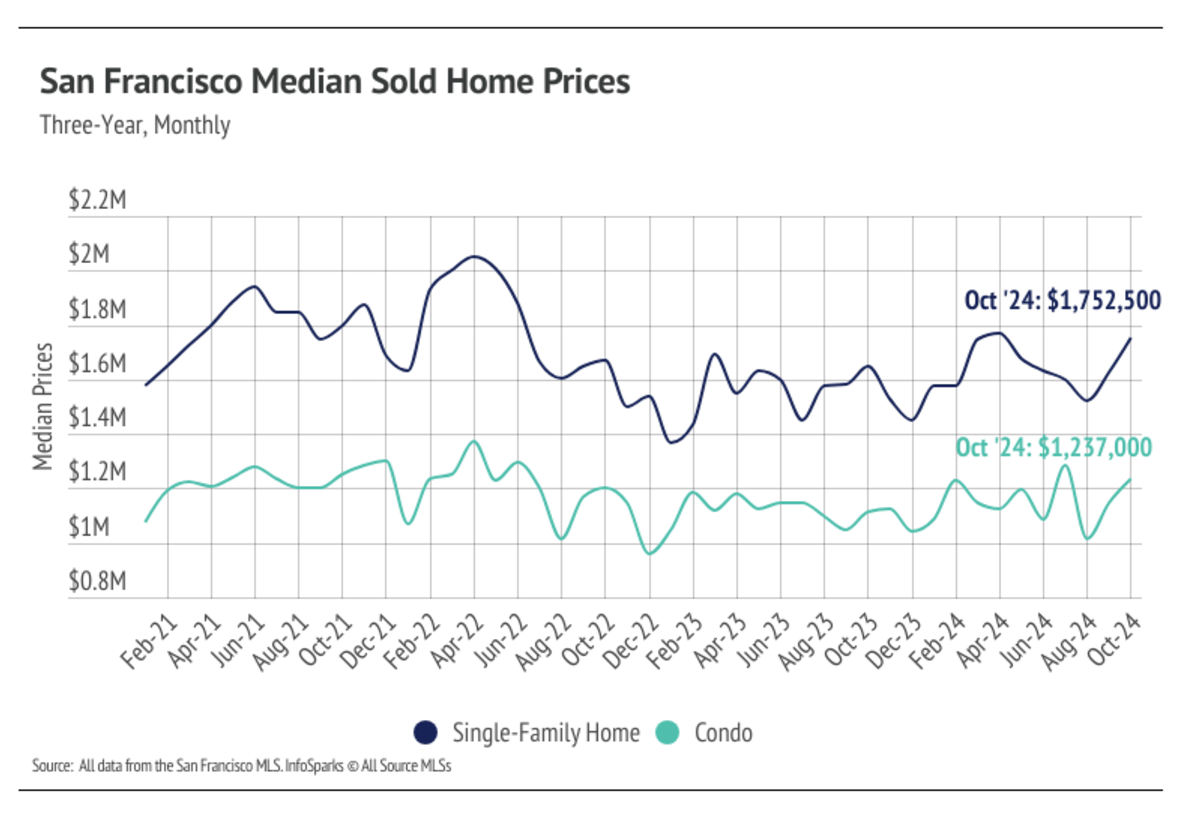
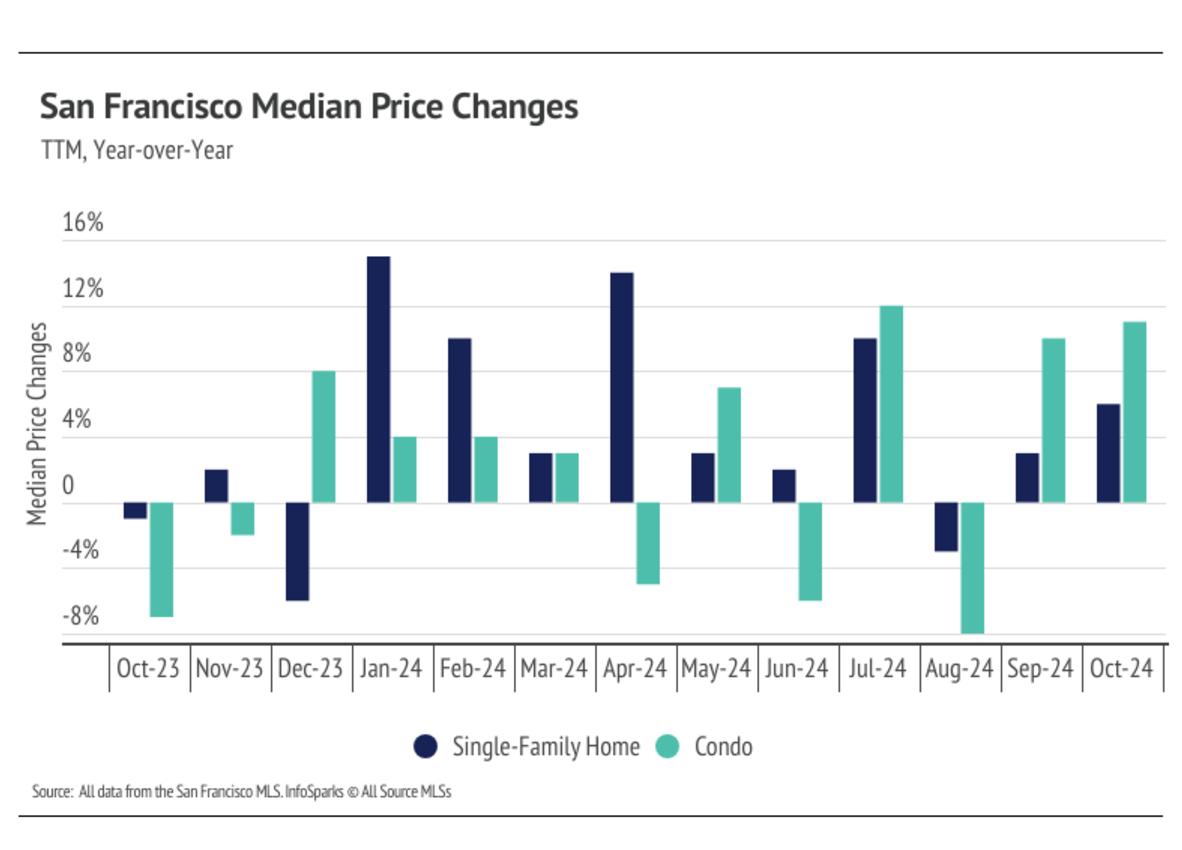
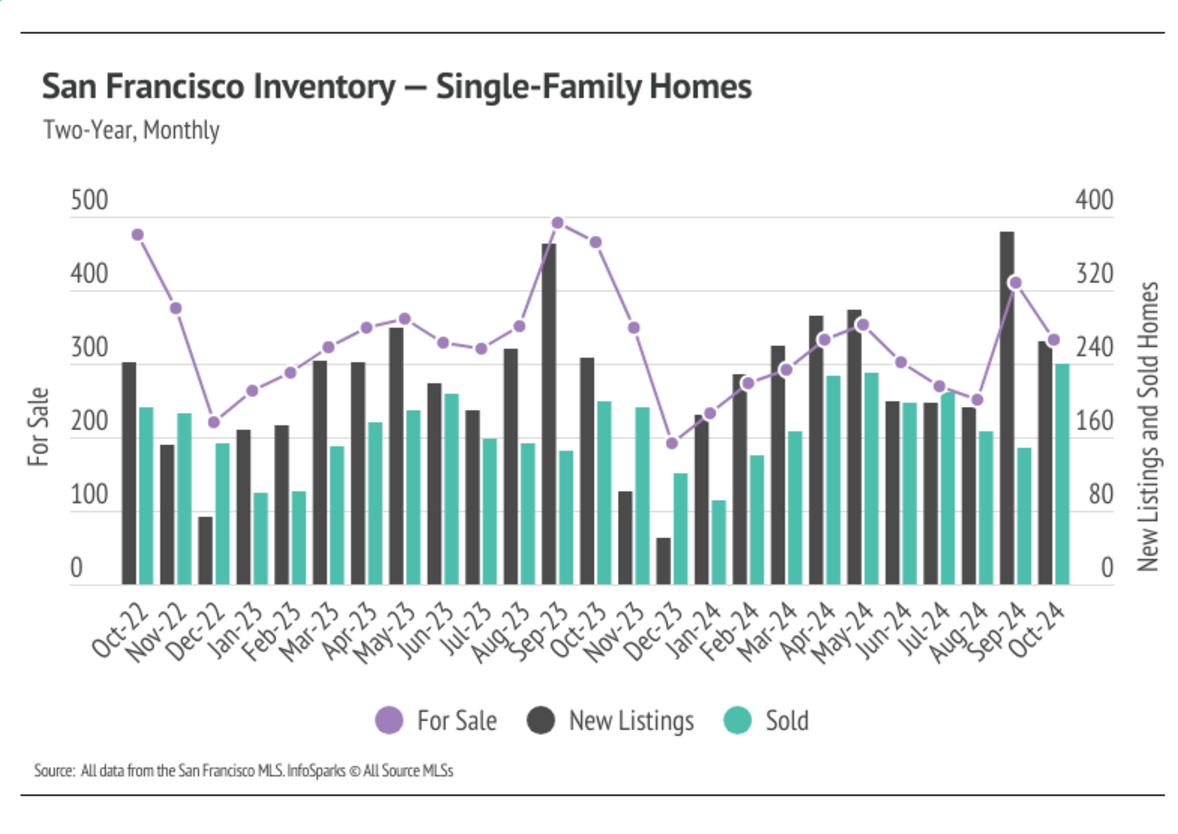
Quick Take: Median home sale prices bounced back in a big way in April, as the spring selling season kicked into gear with nearly a 1% year-over-year increase. Invento… Read more

Michelle Kim | May 31, 2026
Quick Take: Median sale prices gained ground in Sonoma and Marin Counties, with year-over-year increases of 2.35% and 4.38%, respectively, while Solano and Napa Counti… Read more
Michelle Kim | May 31, 2026
Quick Take: Single-family home prices softened slightly in both counties, while the condo market remains split with Alameda declining and Contra Costa rebounding. Inve… Read more
You’ve got questions and we can’t wait to answer them.