The Local Lowdown
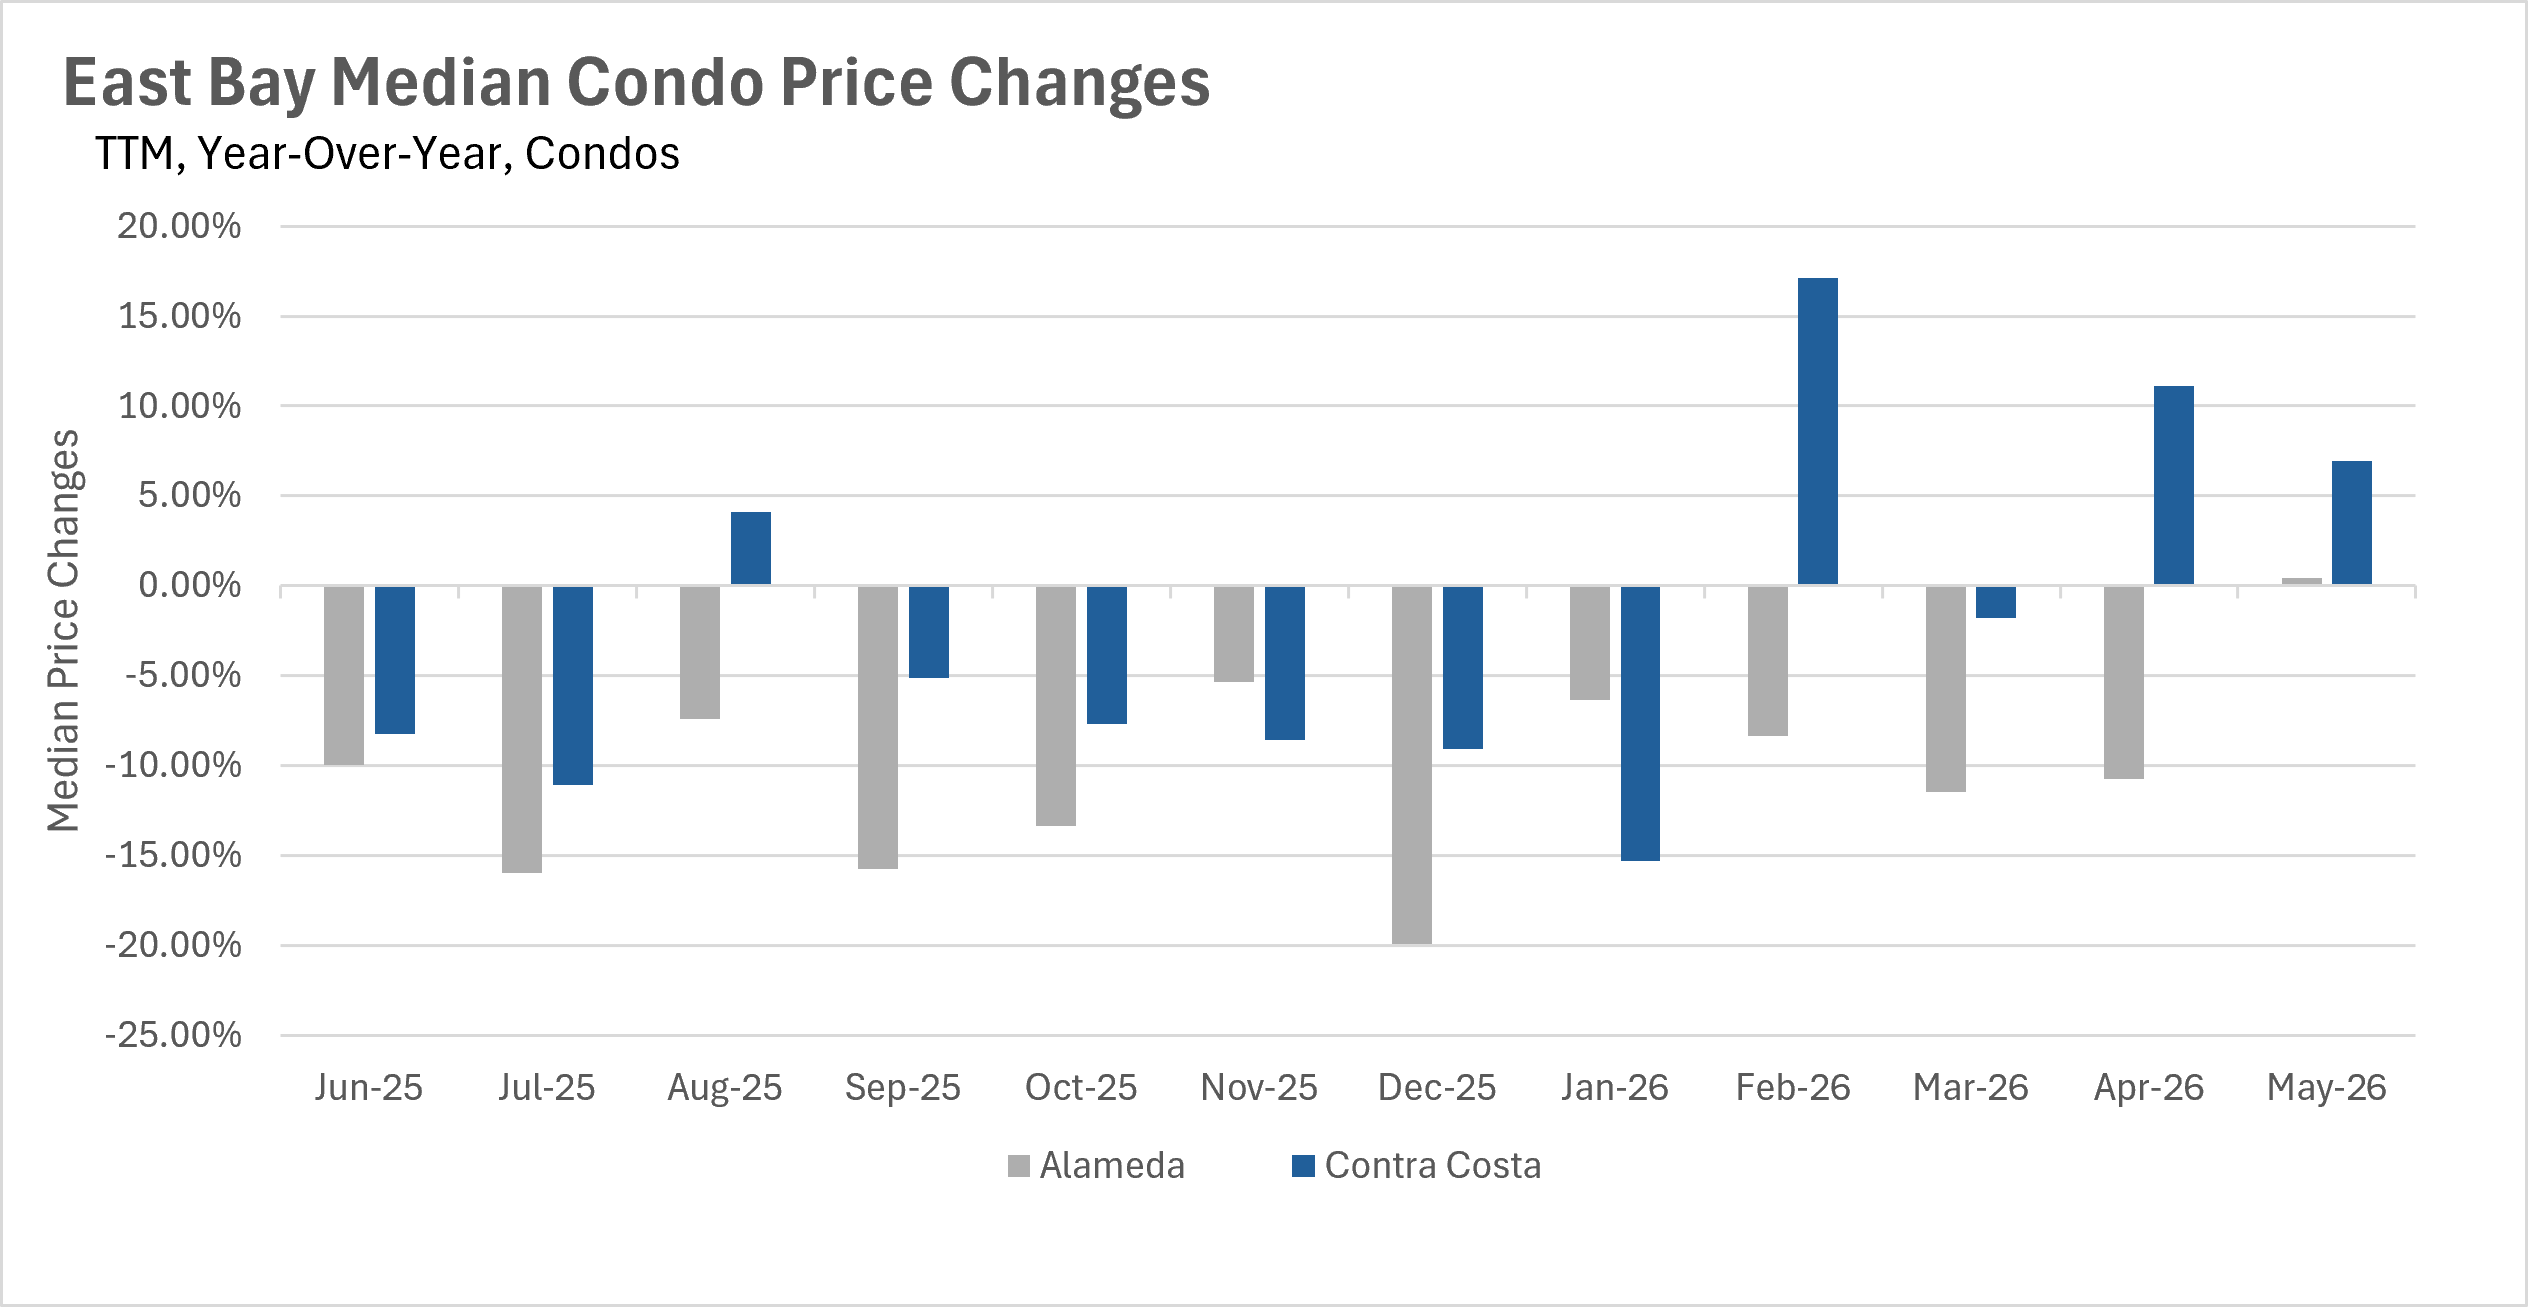
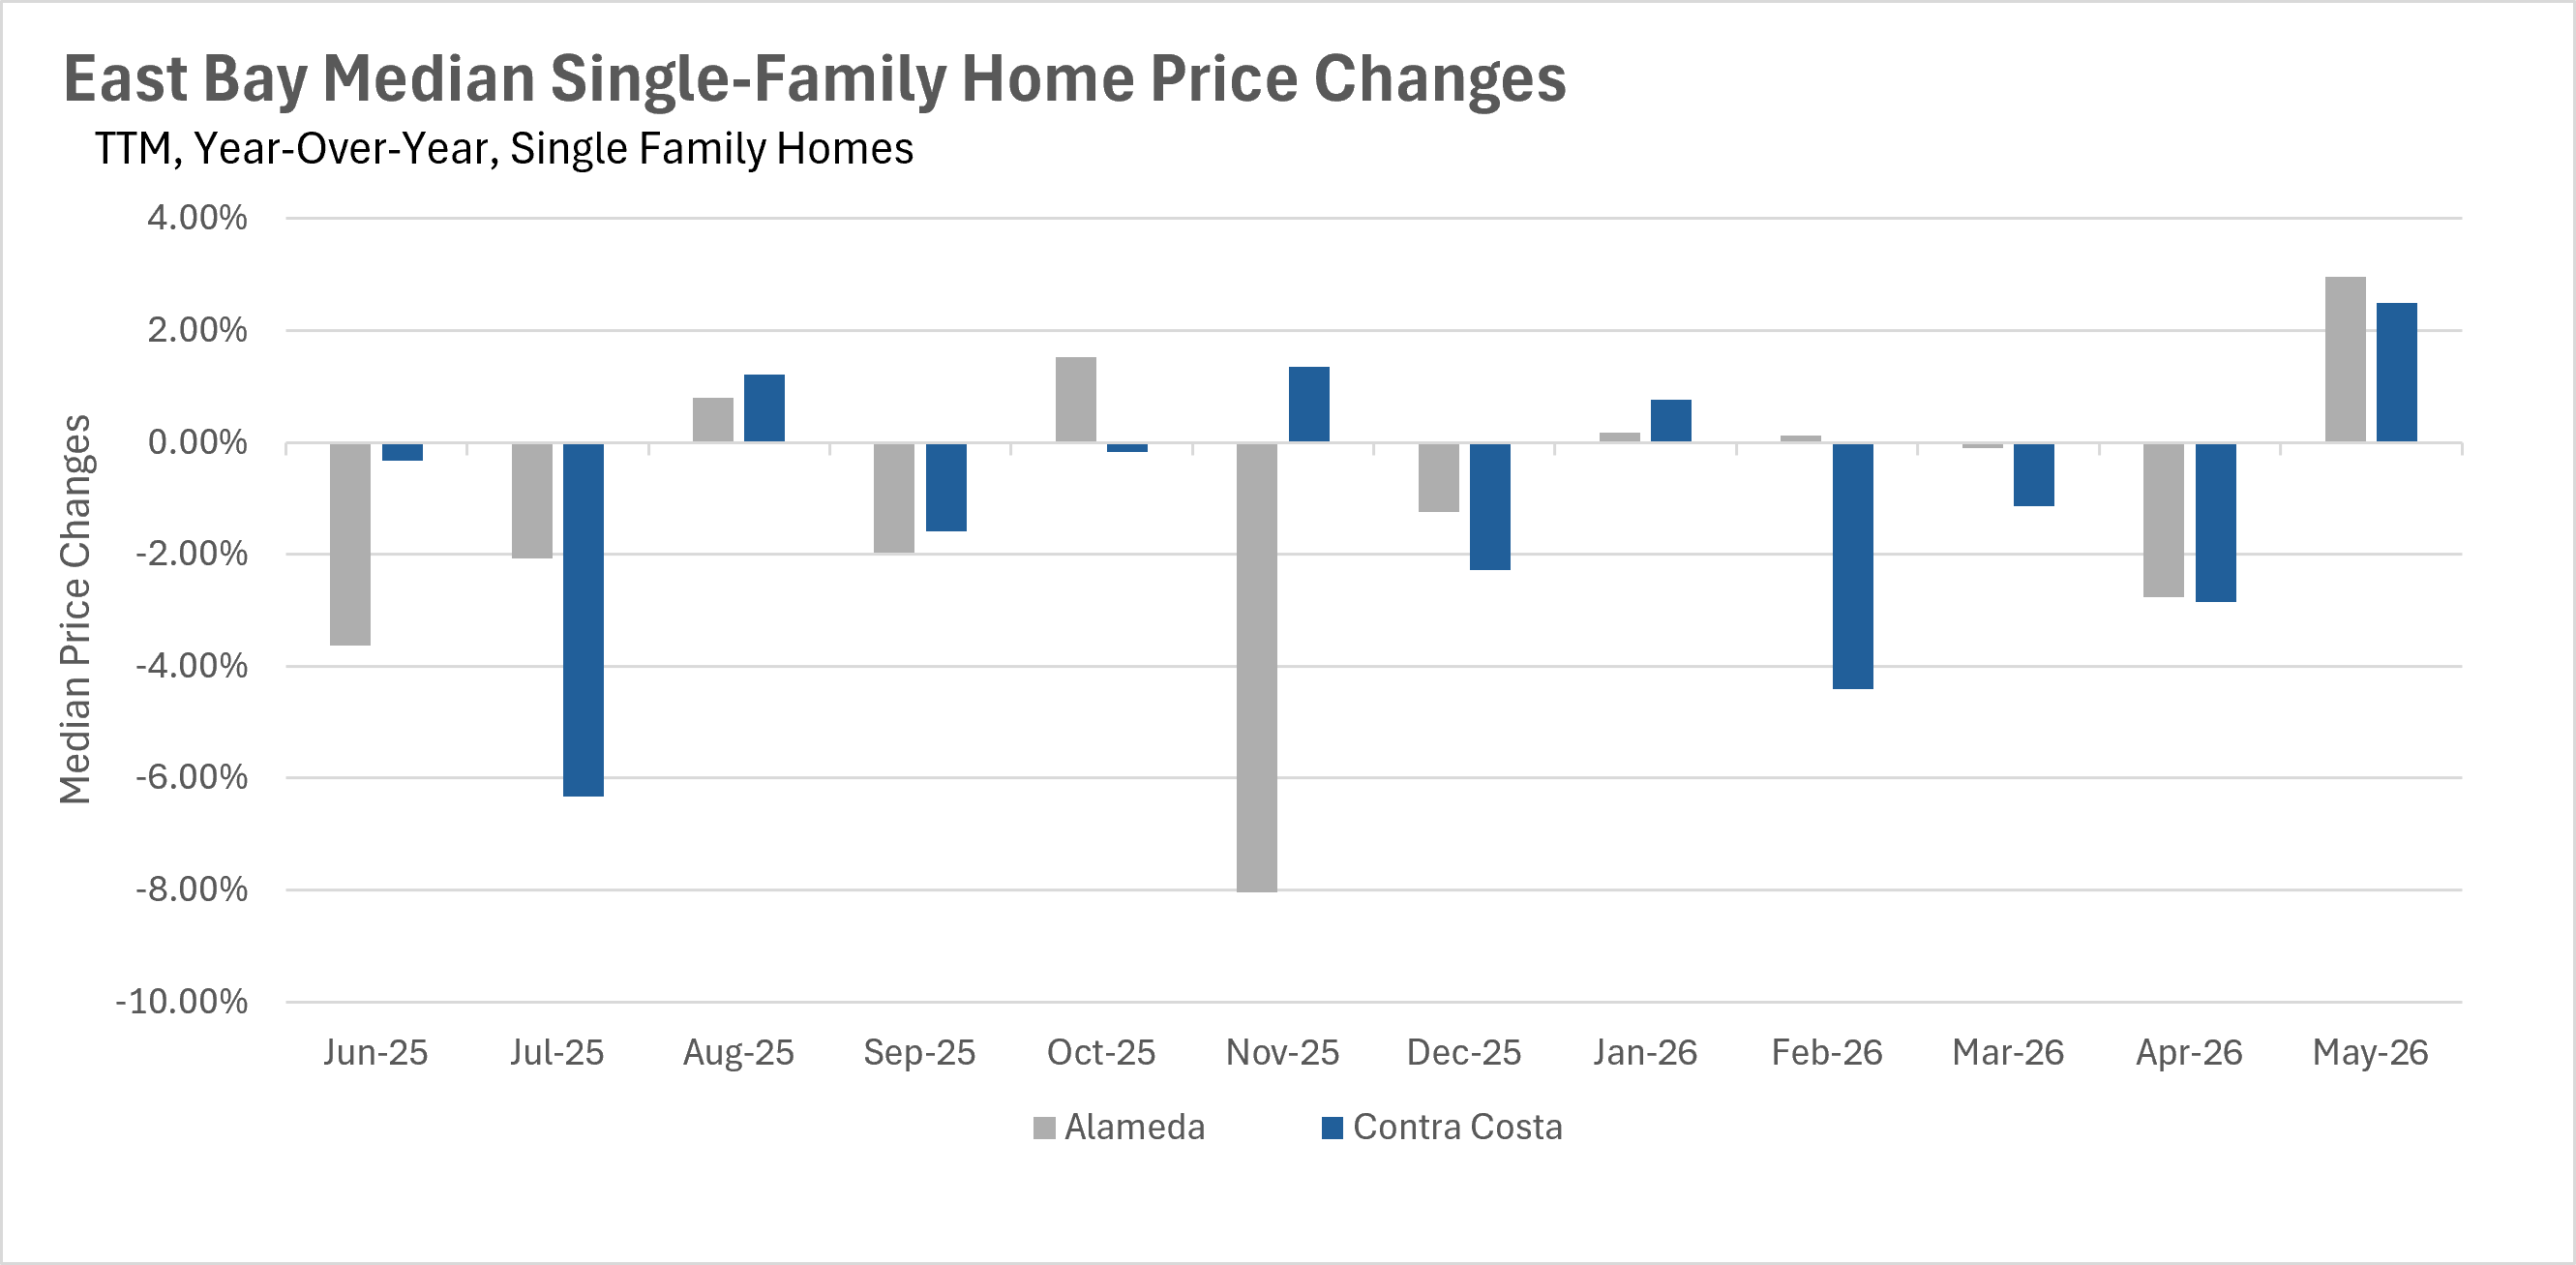
Prices are on the rise across the board, with single-family homes and condos both posting year-over-year gains for the first time in over a year.
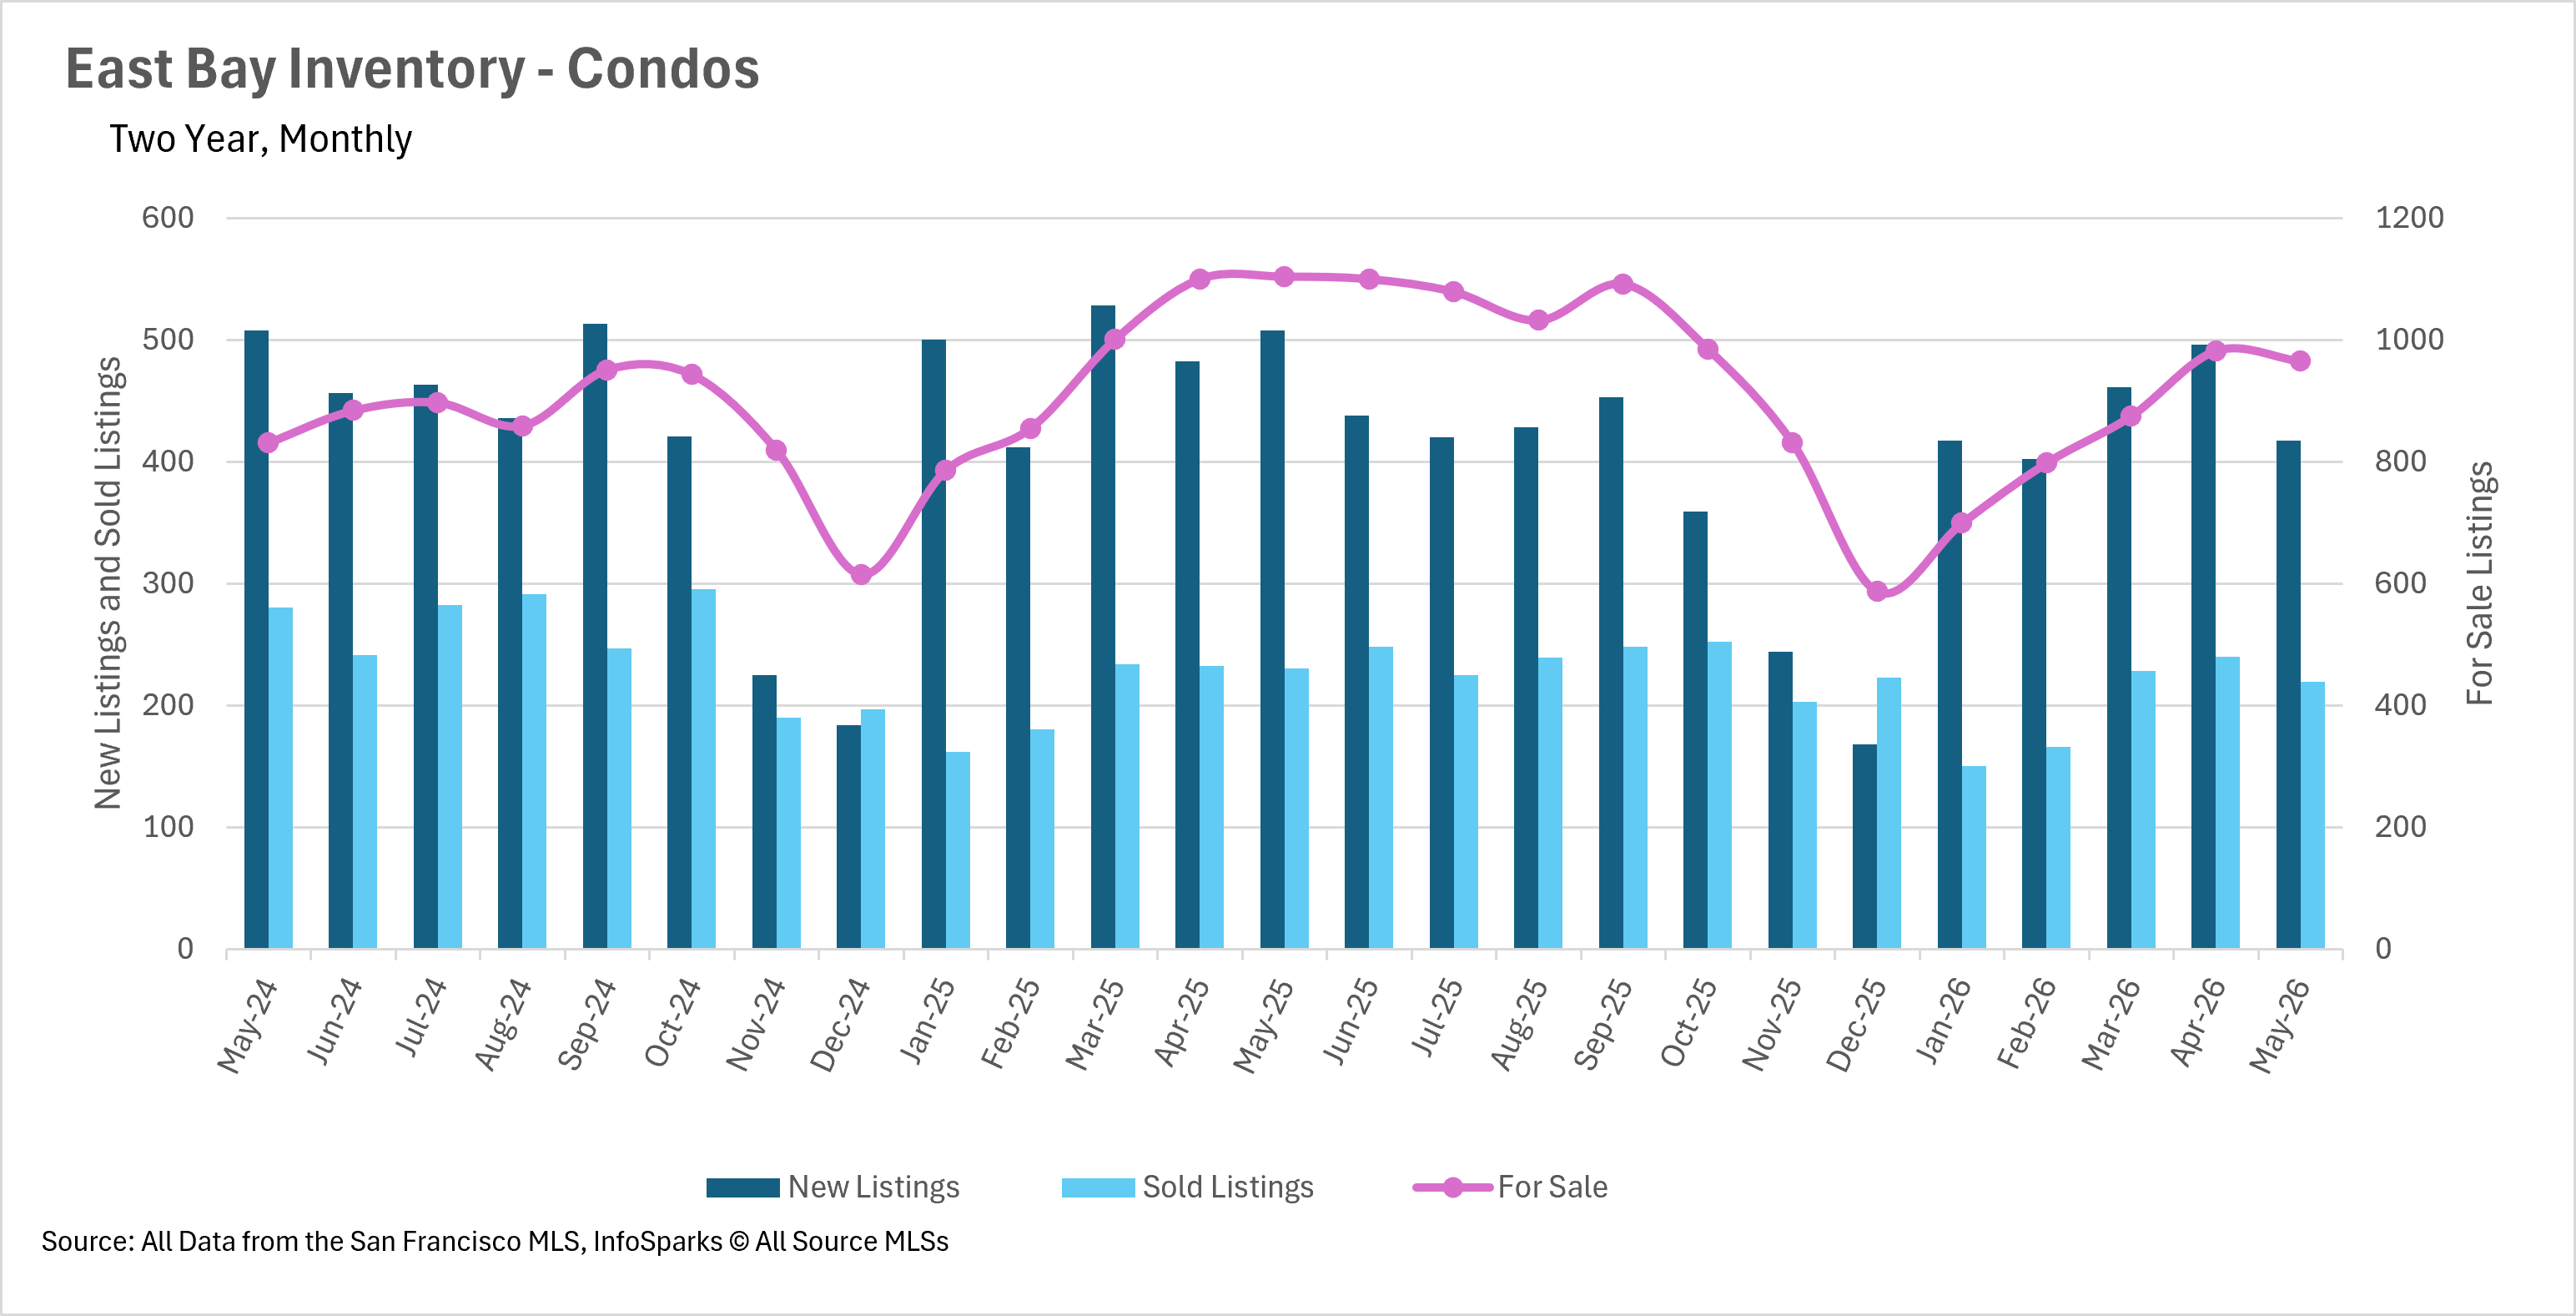
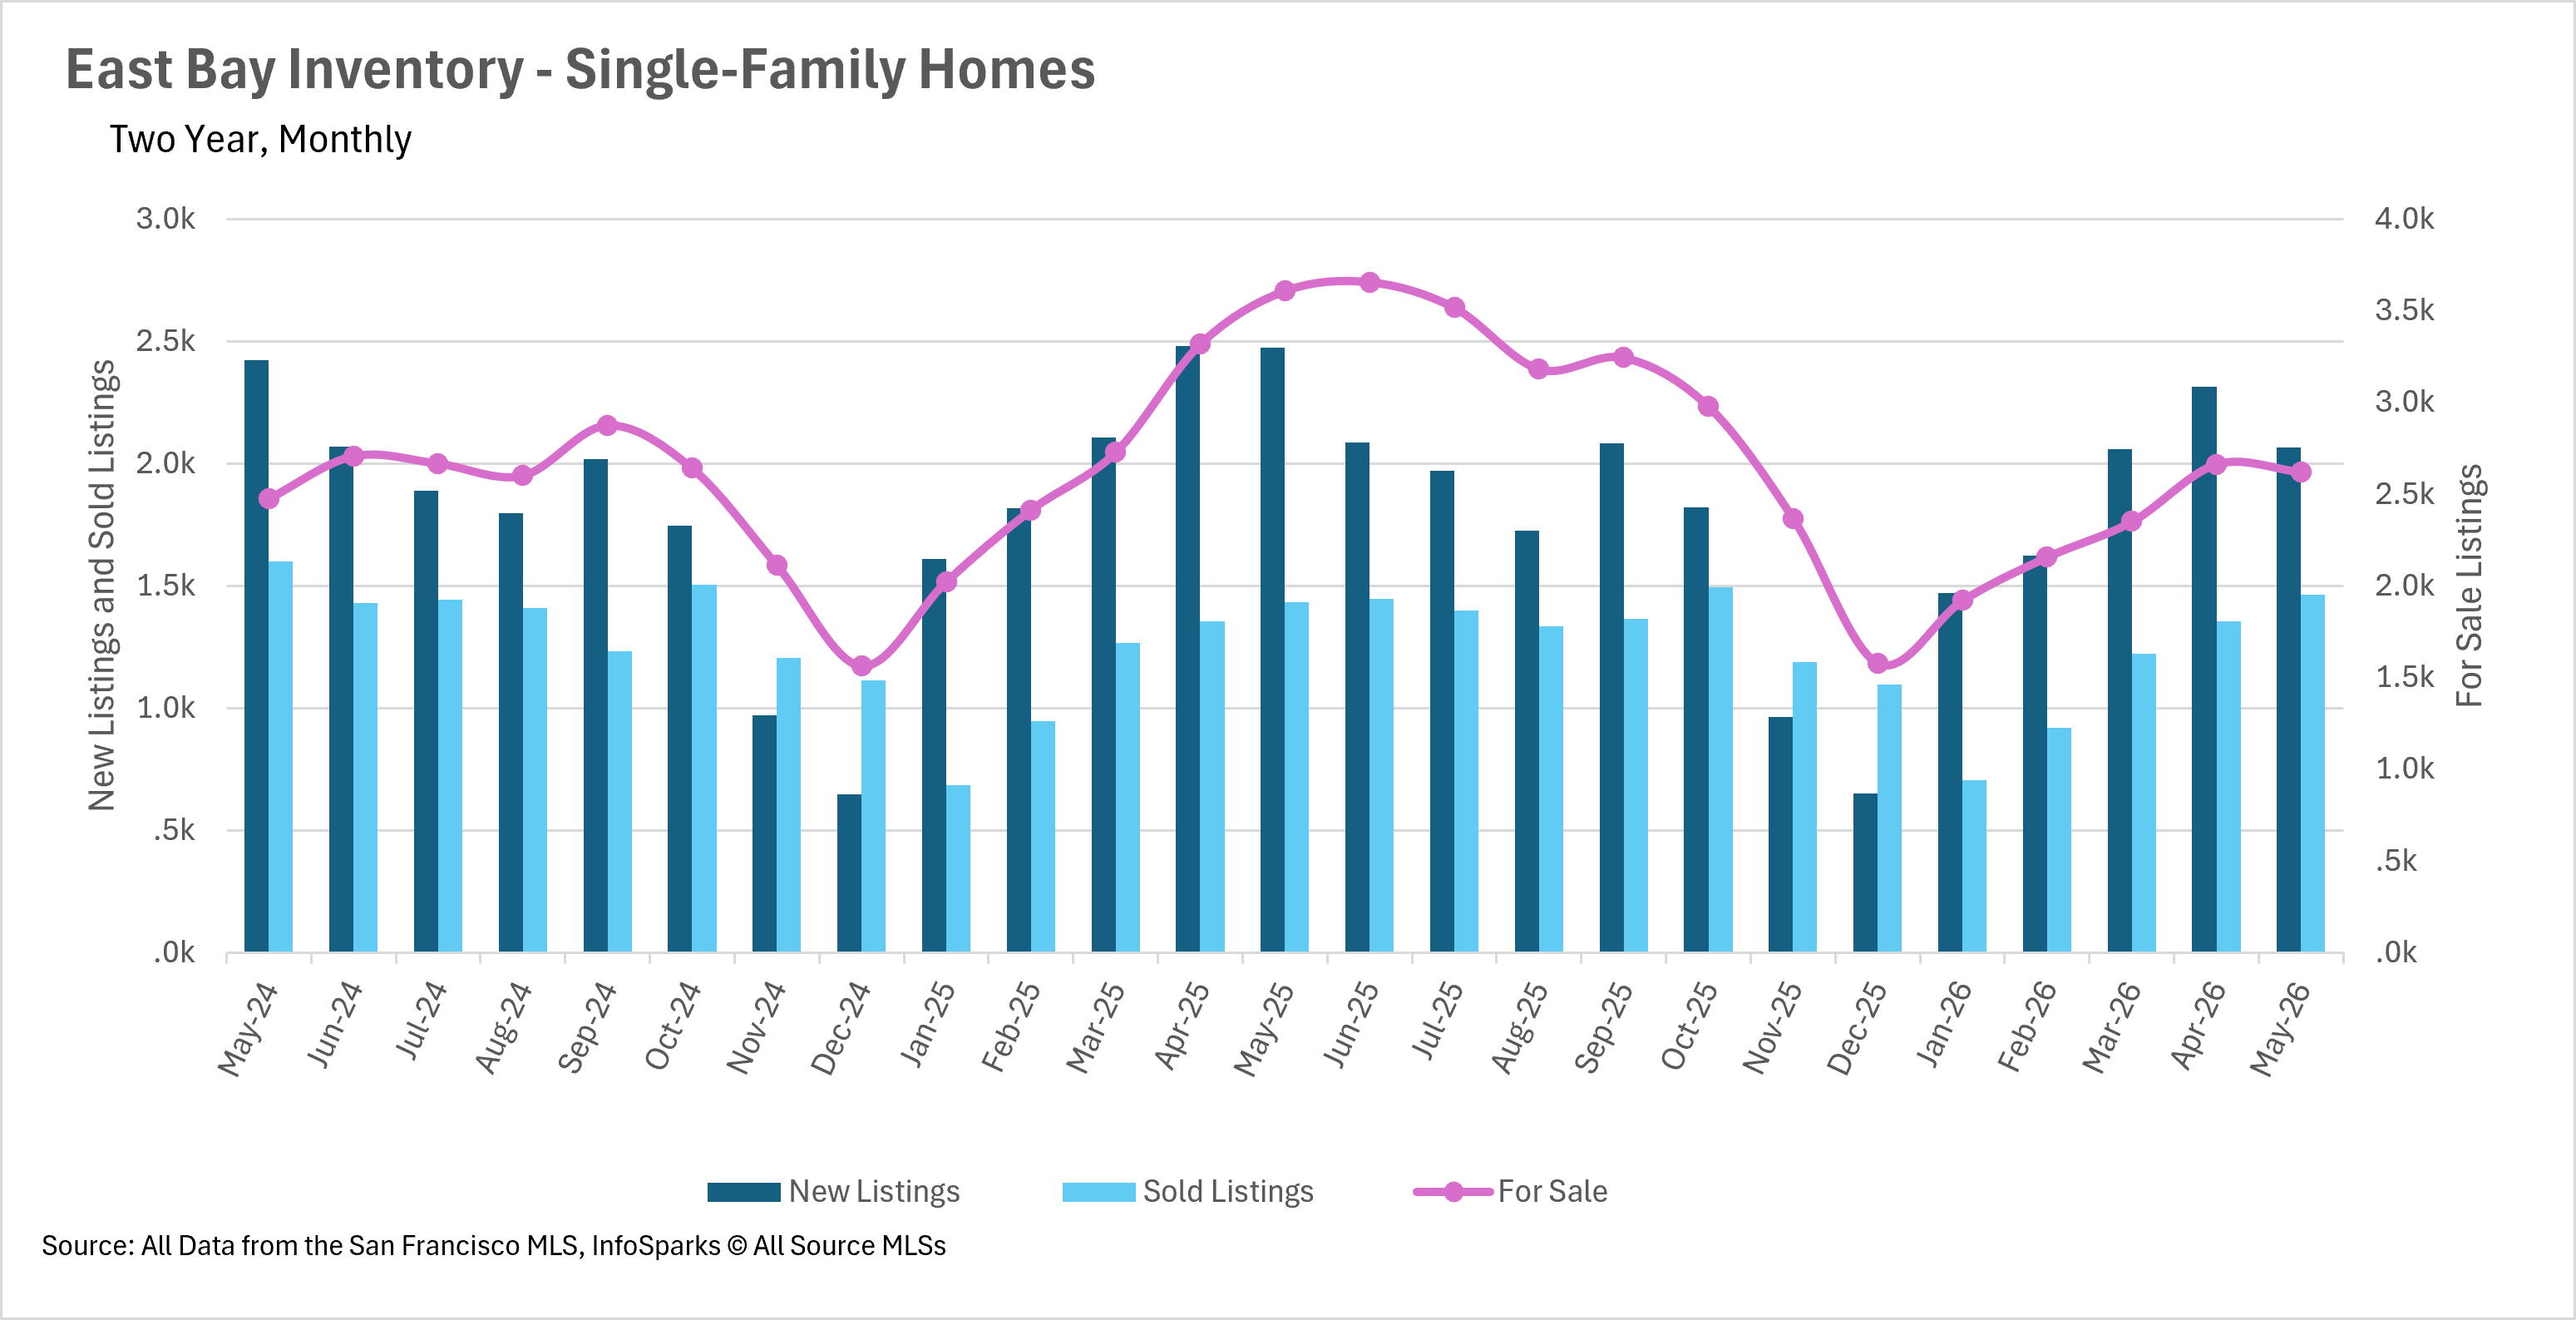
Inventory remains exceptionally tight, with single-family home supply down more than 27% compared to last year.
Single-family homes are selling faster than last year, while condos continue to take a bit longer to move.
Prices surge as the spring market hits its stride
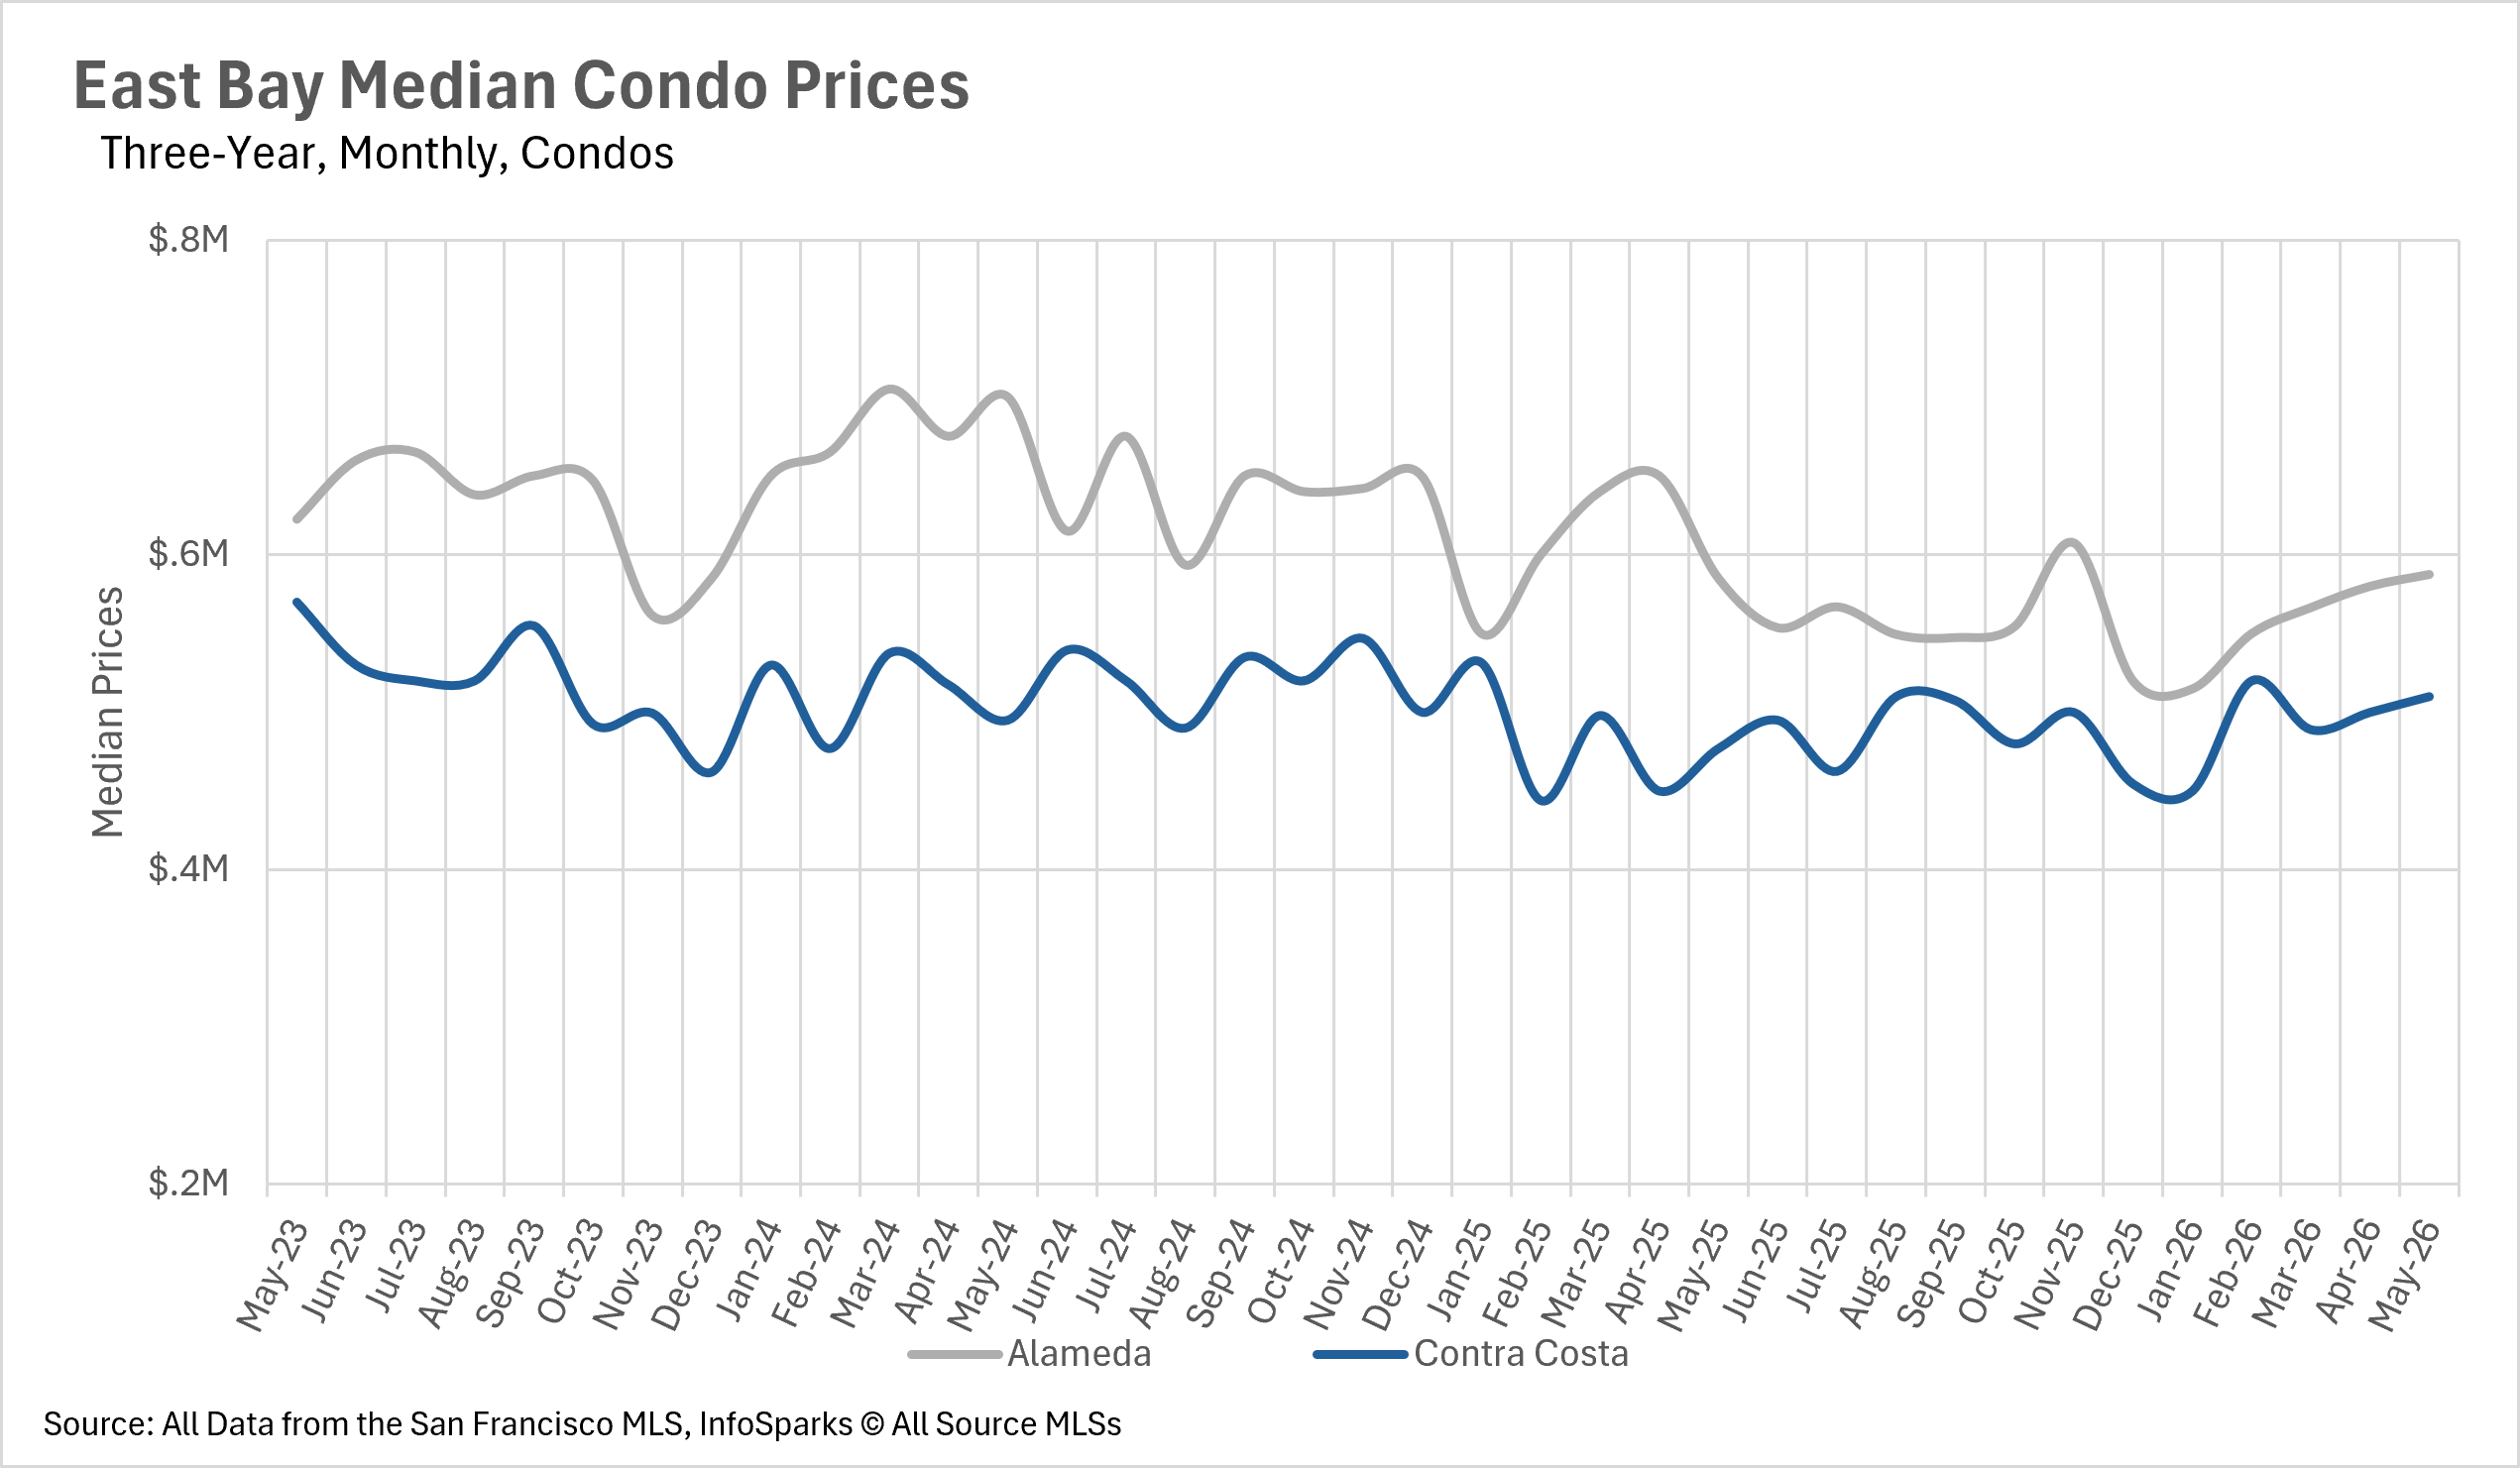
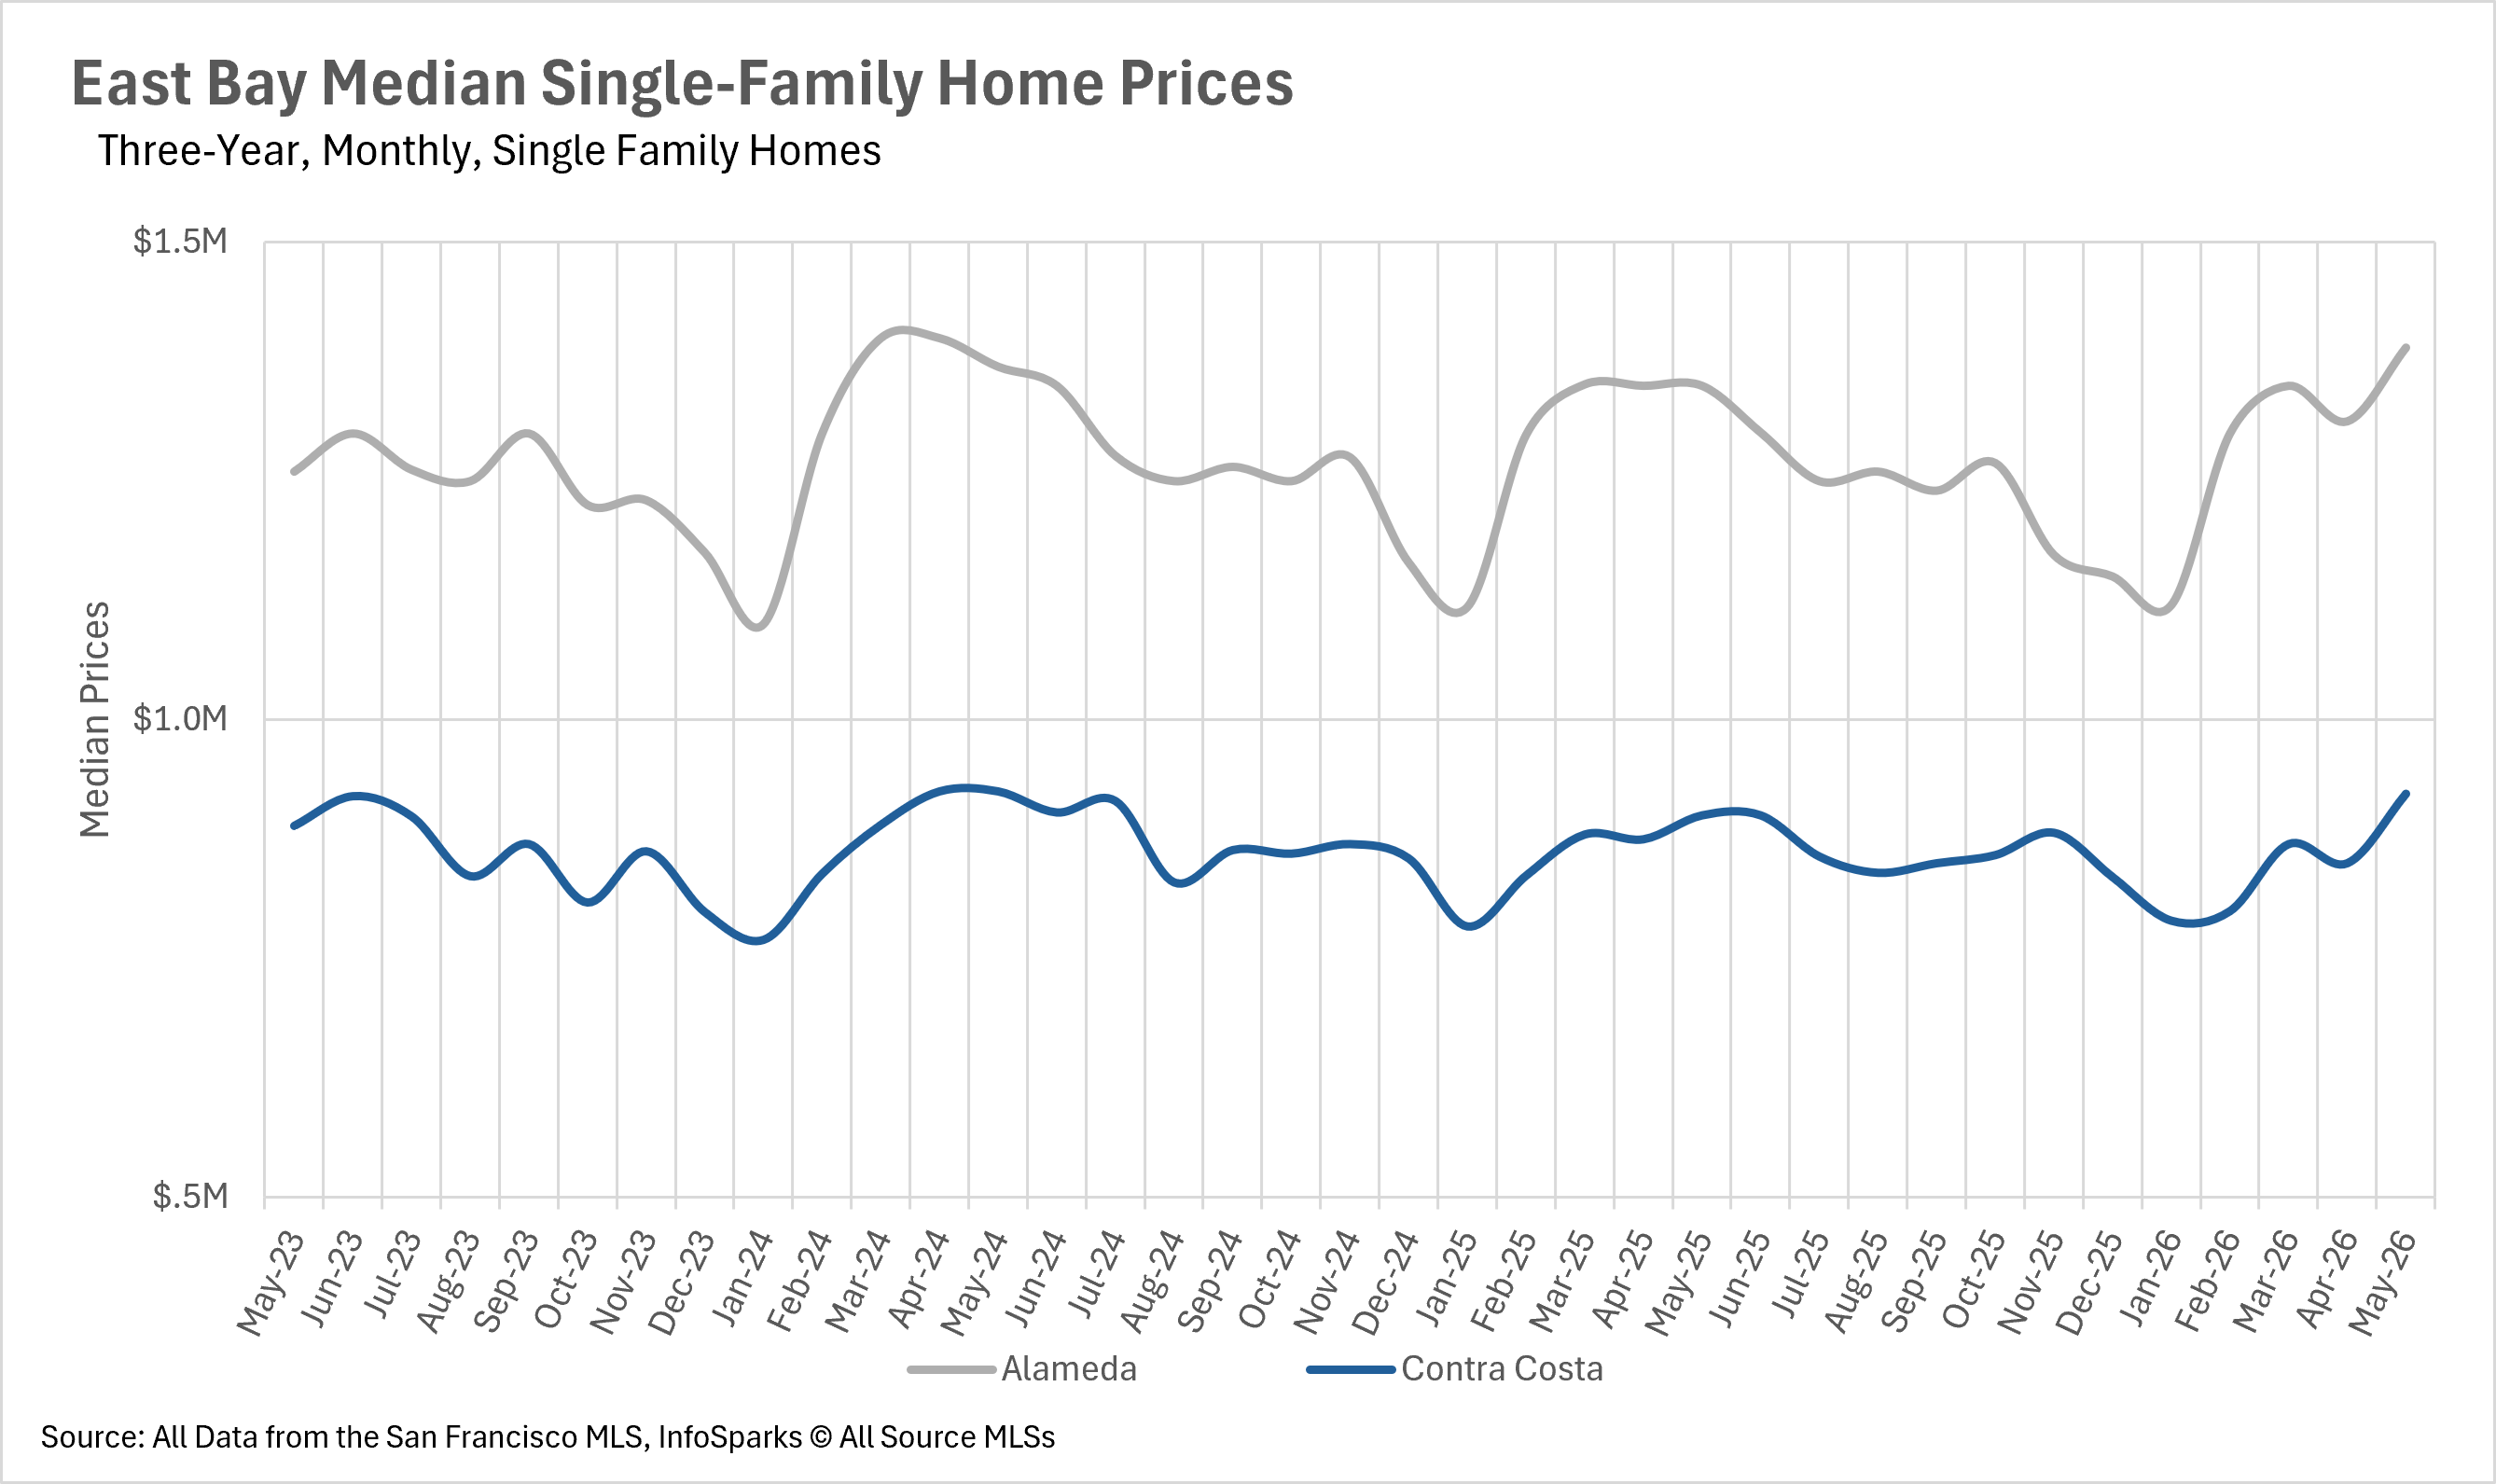
May brought some exciting news for East Bay homeowners, as prices rose across the board for the first time in well over a year. In Alameda County, the median single-family home sold for $1,390,000, representing a 2.96% increase on a year-over-year basis. Contra Costa County saw similar gains, with the median single-family home selling for $922,500, up 2.50% compared to last year. Perhaps even more notable is the turnaround we're seeing in the condo market. Alameda County condos posted a 0.43% year-over-year gain, with the median condo selling for $587,500. While this is a modest increase, it marks the first positive year-over-year movement we've seen in the Alameda County condo market in quite some time. Contra Costa County condos fared even better, rising 6.92% to a median sale price of $510,000.
Inventory crunch intensifies as buyers compete for limited options
The inventory shortage that has defined the East Bay market continues to intensify. Single-family home inventory stood at just 2,621 units in May, representing a staggering 27.38% decline on a year-over-year basis. This is remarkable considering we're in the heart of the spring selling season, which is typically the busiest time of year for new listings. The condo market saw a similar trend, with inventory down 12.59% year-over-year to 965 units. This persistent lack of supply is the primary driver behind the price appreciation we're seeing, as buyers compete aggressively for a limited number of homes.
Single-family homes are moving even faster than last year
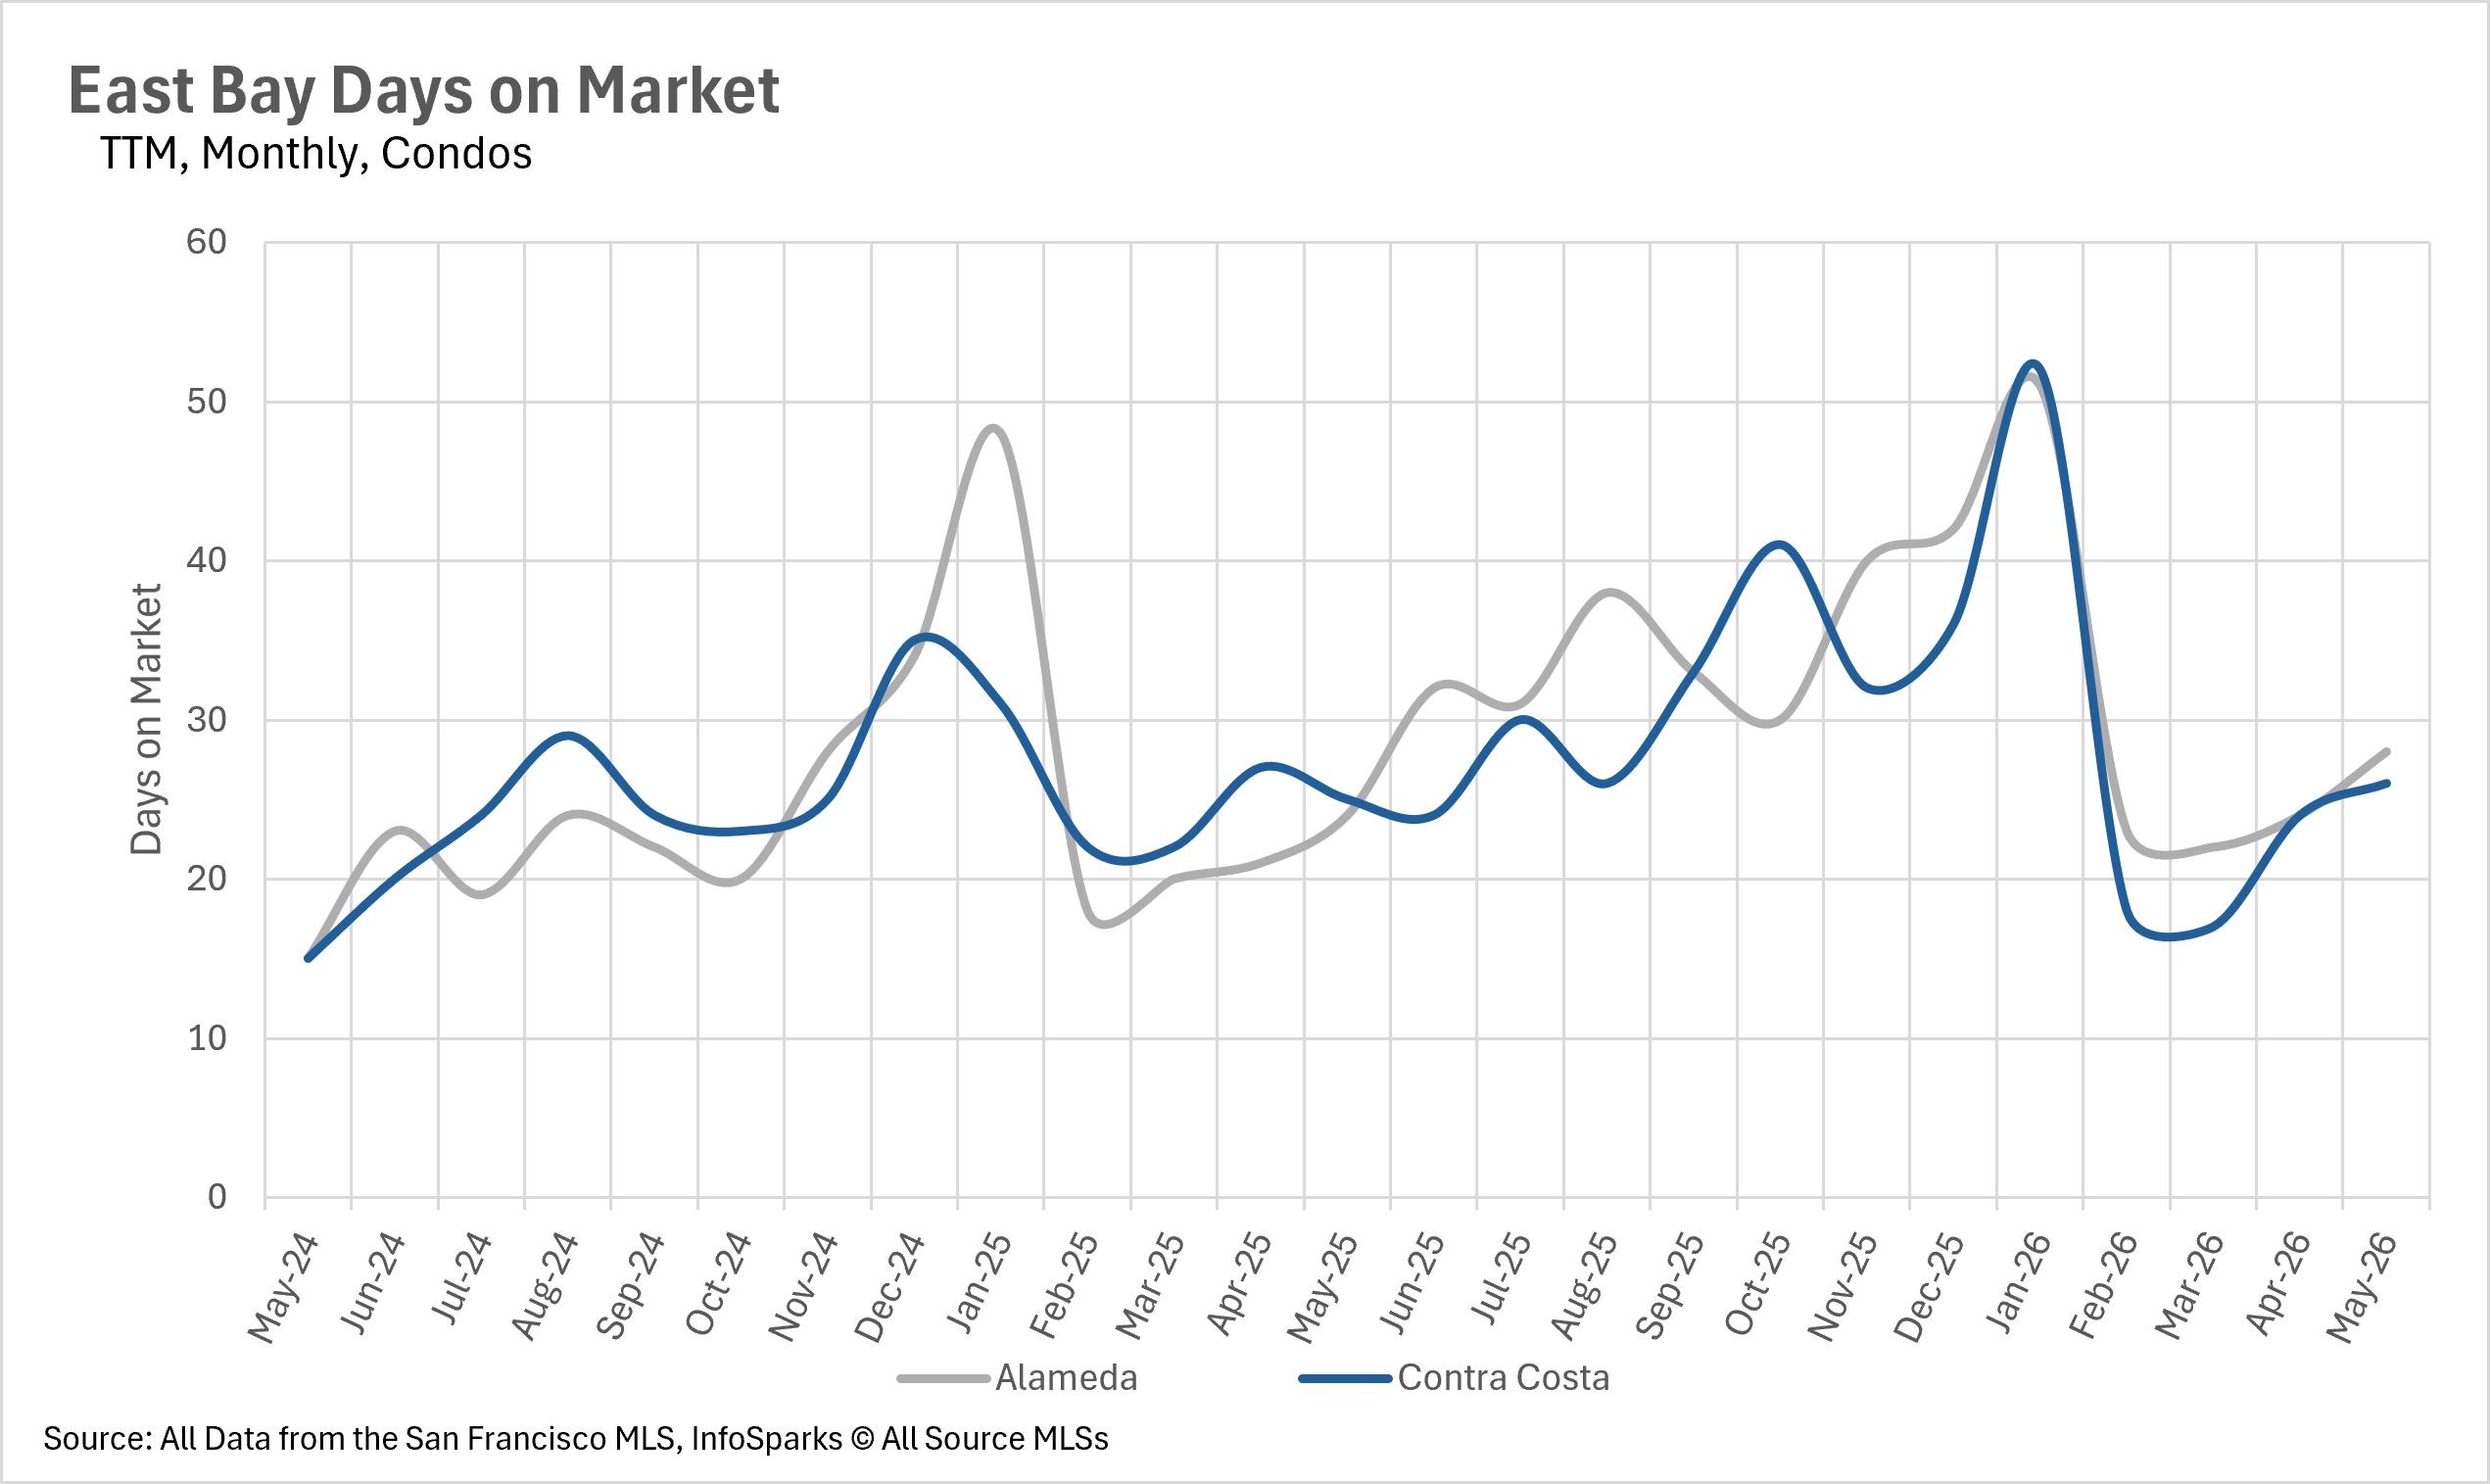
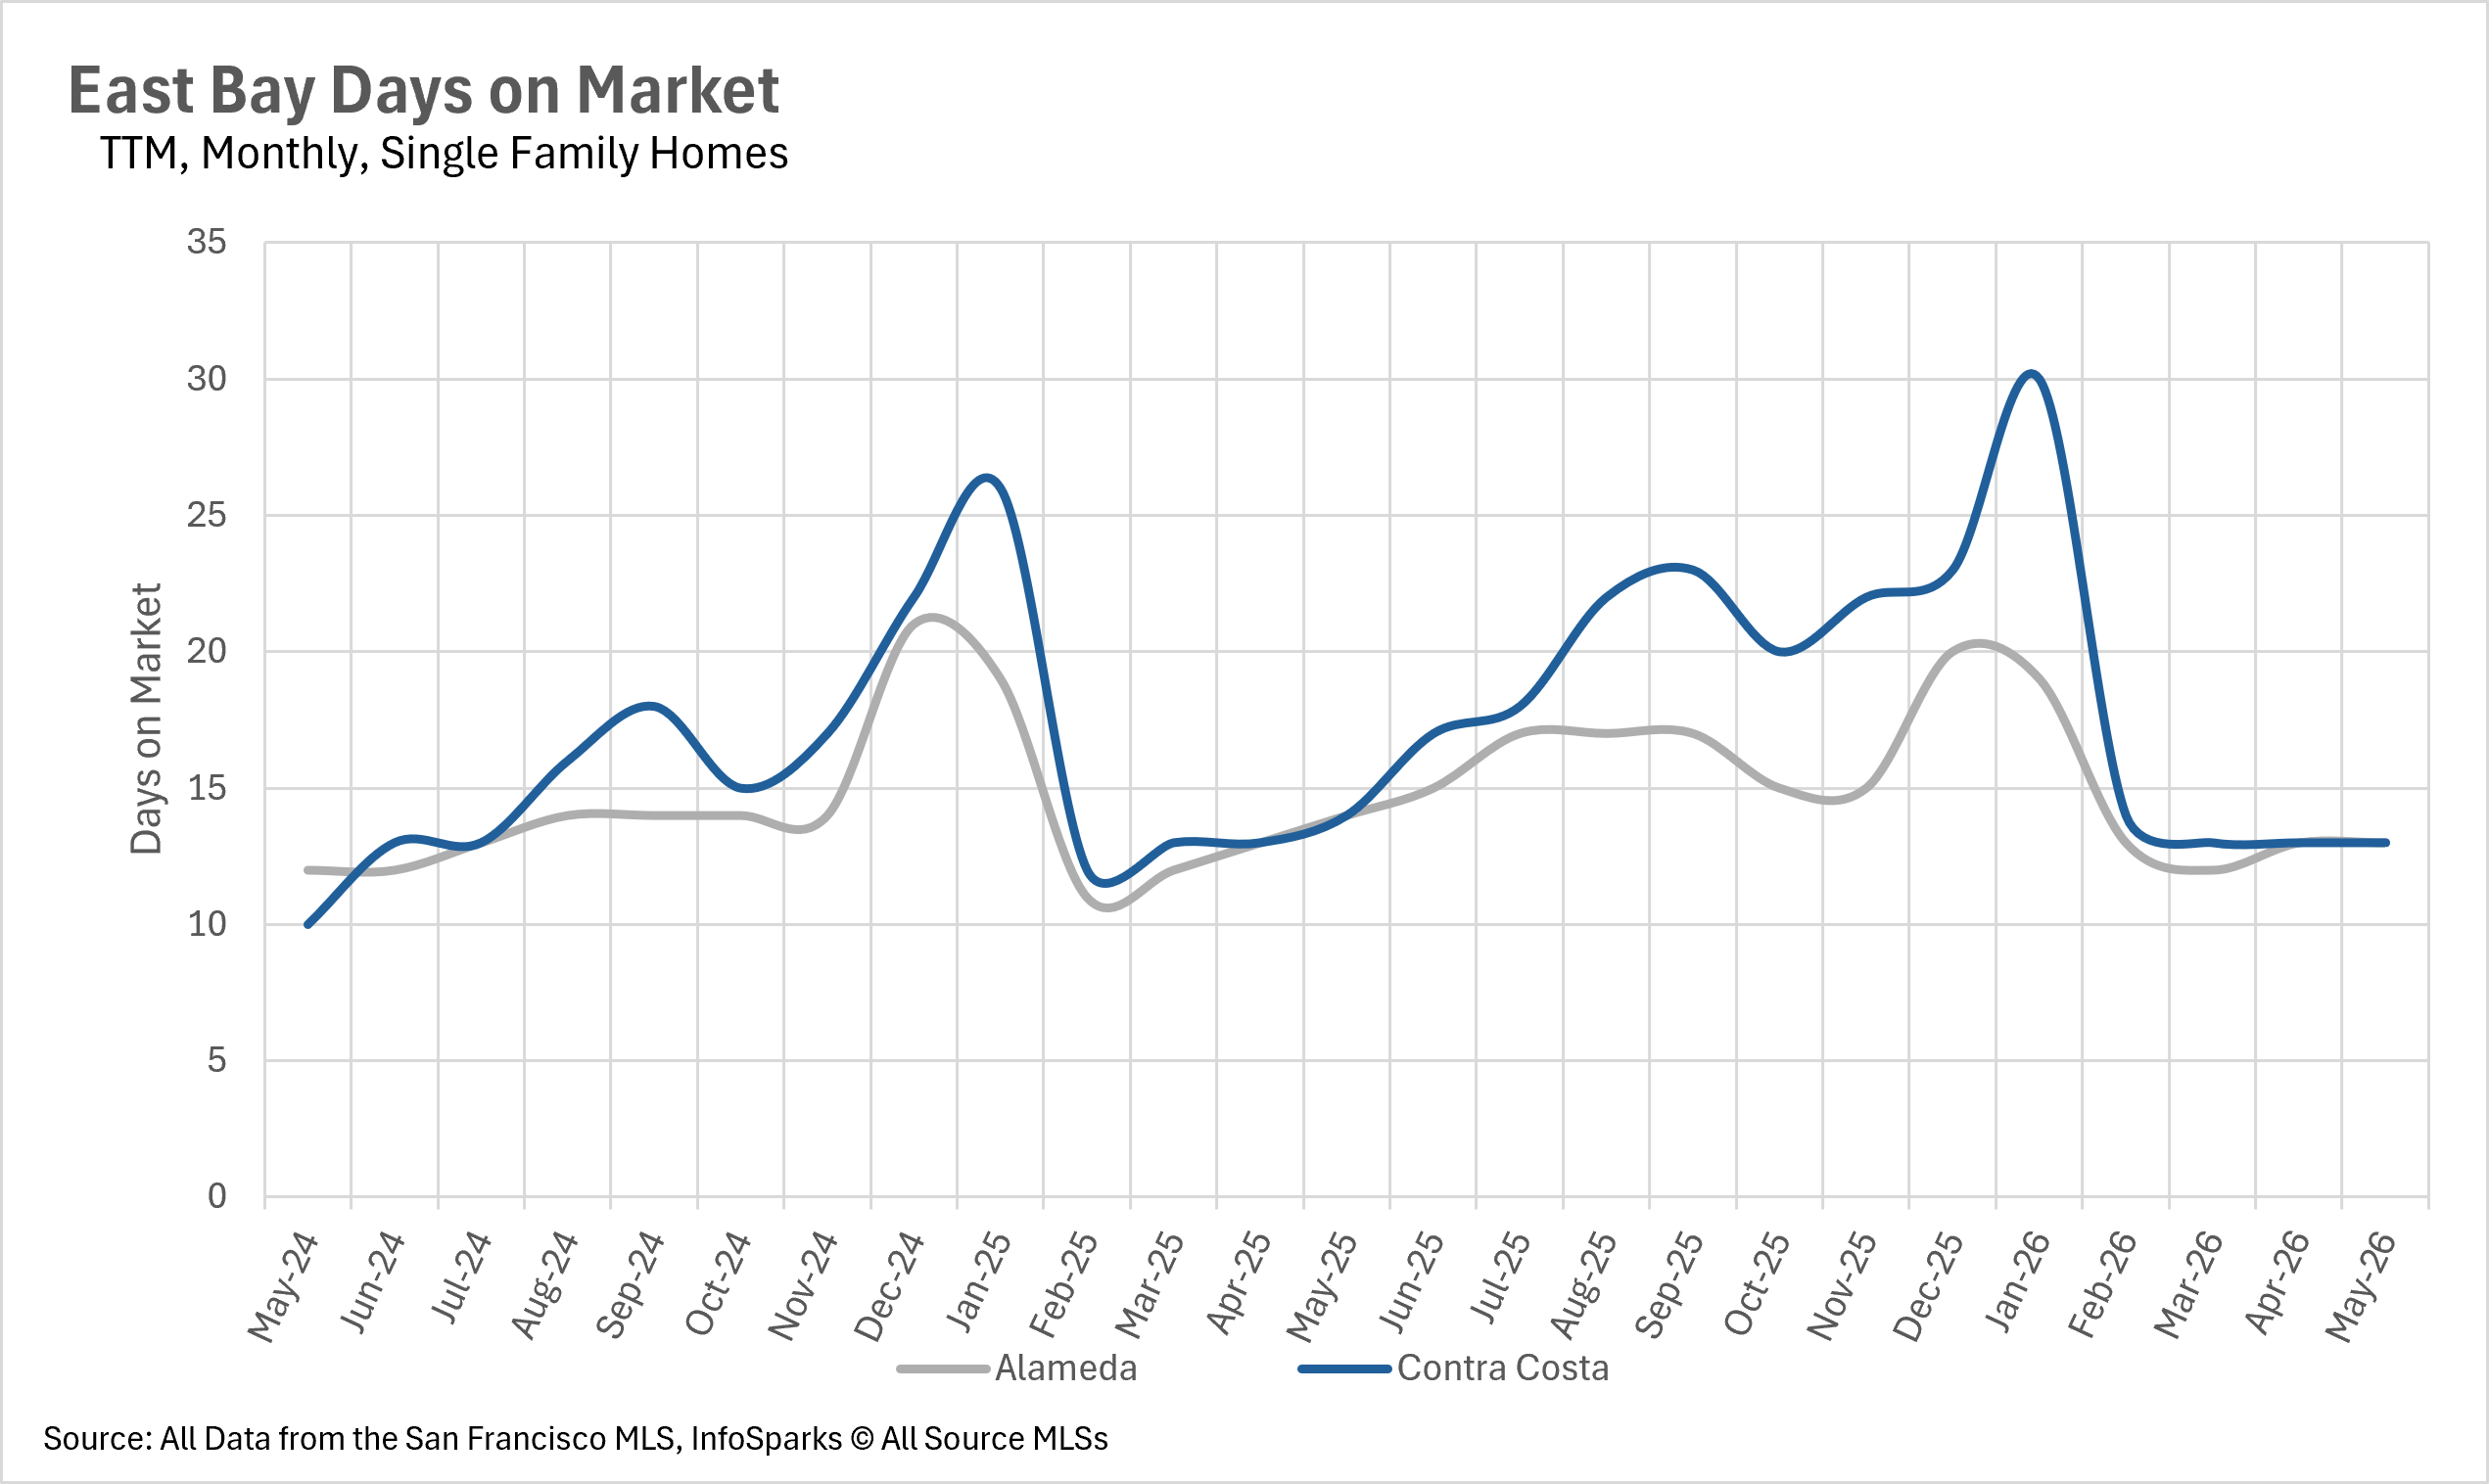
The tight inventory environment is pushing single-family homes to sell even faster than they did a year ago. The average single-family home in both Alameda and Contra Costa Counties sold in just 13 days, representing a 7.14% improvement on a year-over-year basis in both counties. The condo market is moving a bit more slowly, with the average condo in Alameda County spending 28 days on the market and Contra Costa County condos spending 26 days. While these figures represent year-over-year increases of 16.67% and 4.00% respectively, condos are still selling at a reasonable pace given the broader market conditions.
Single-family homes remain a strong seller's market while condos favor buyers
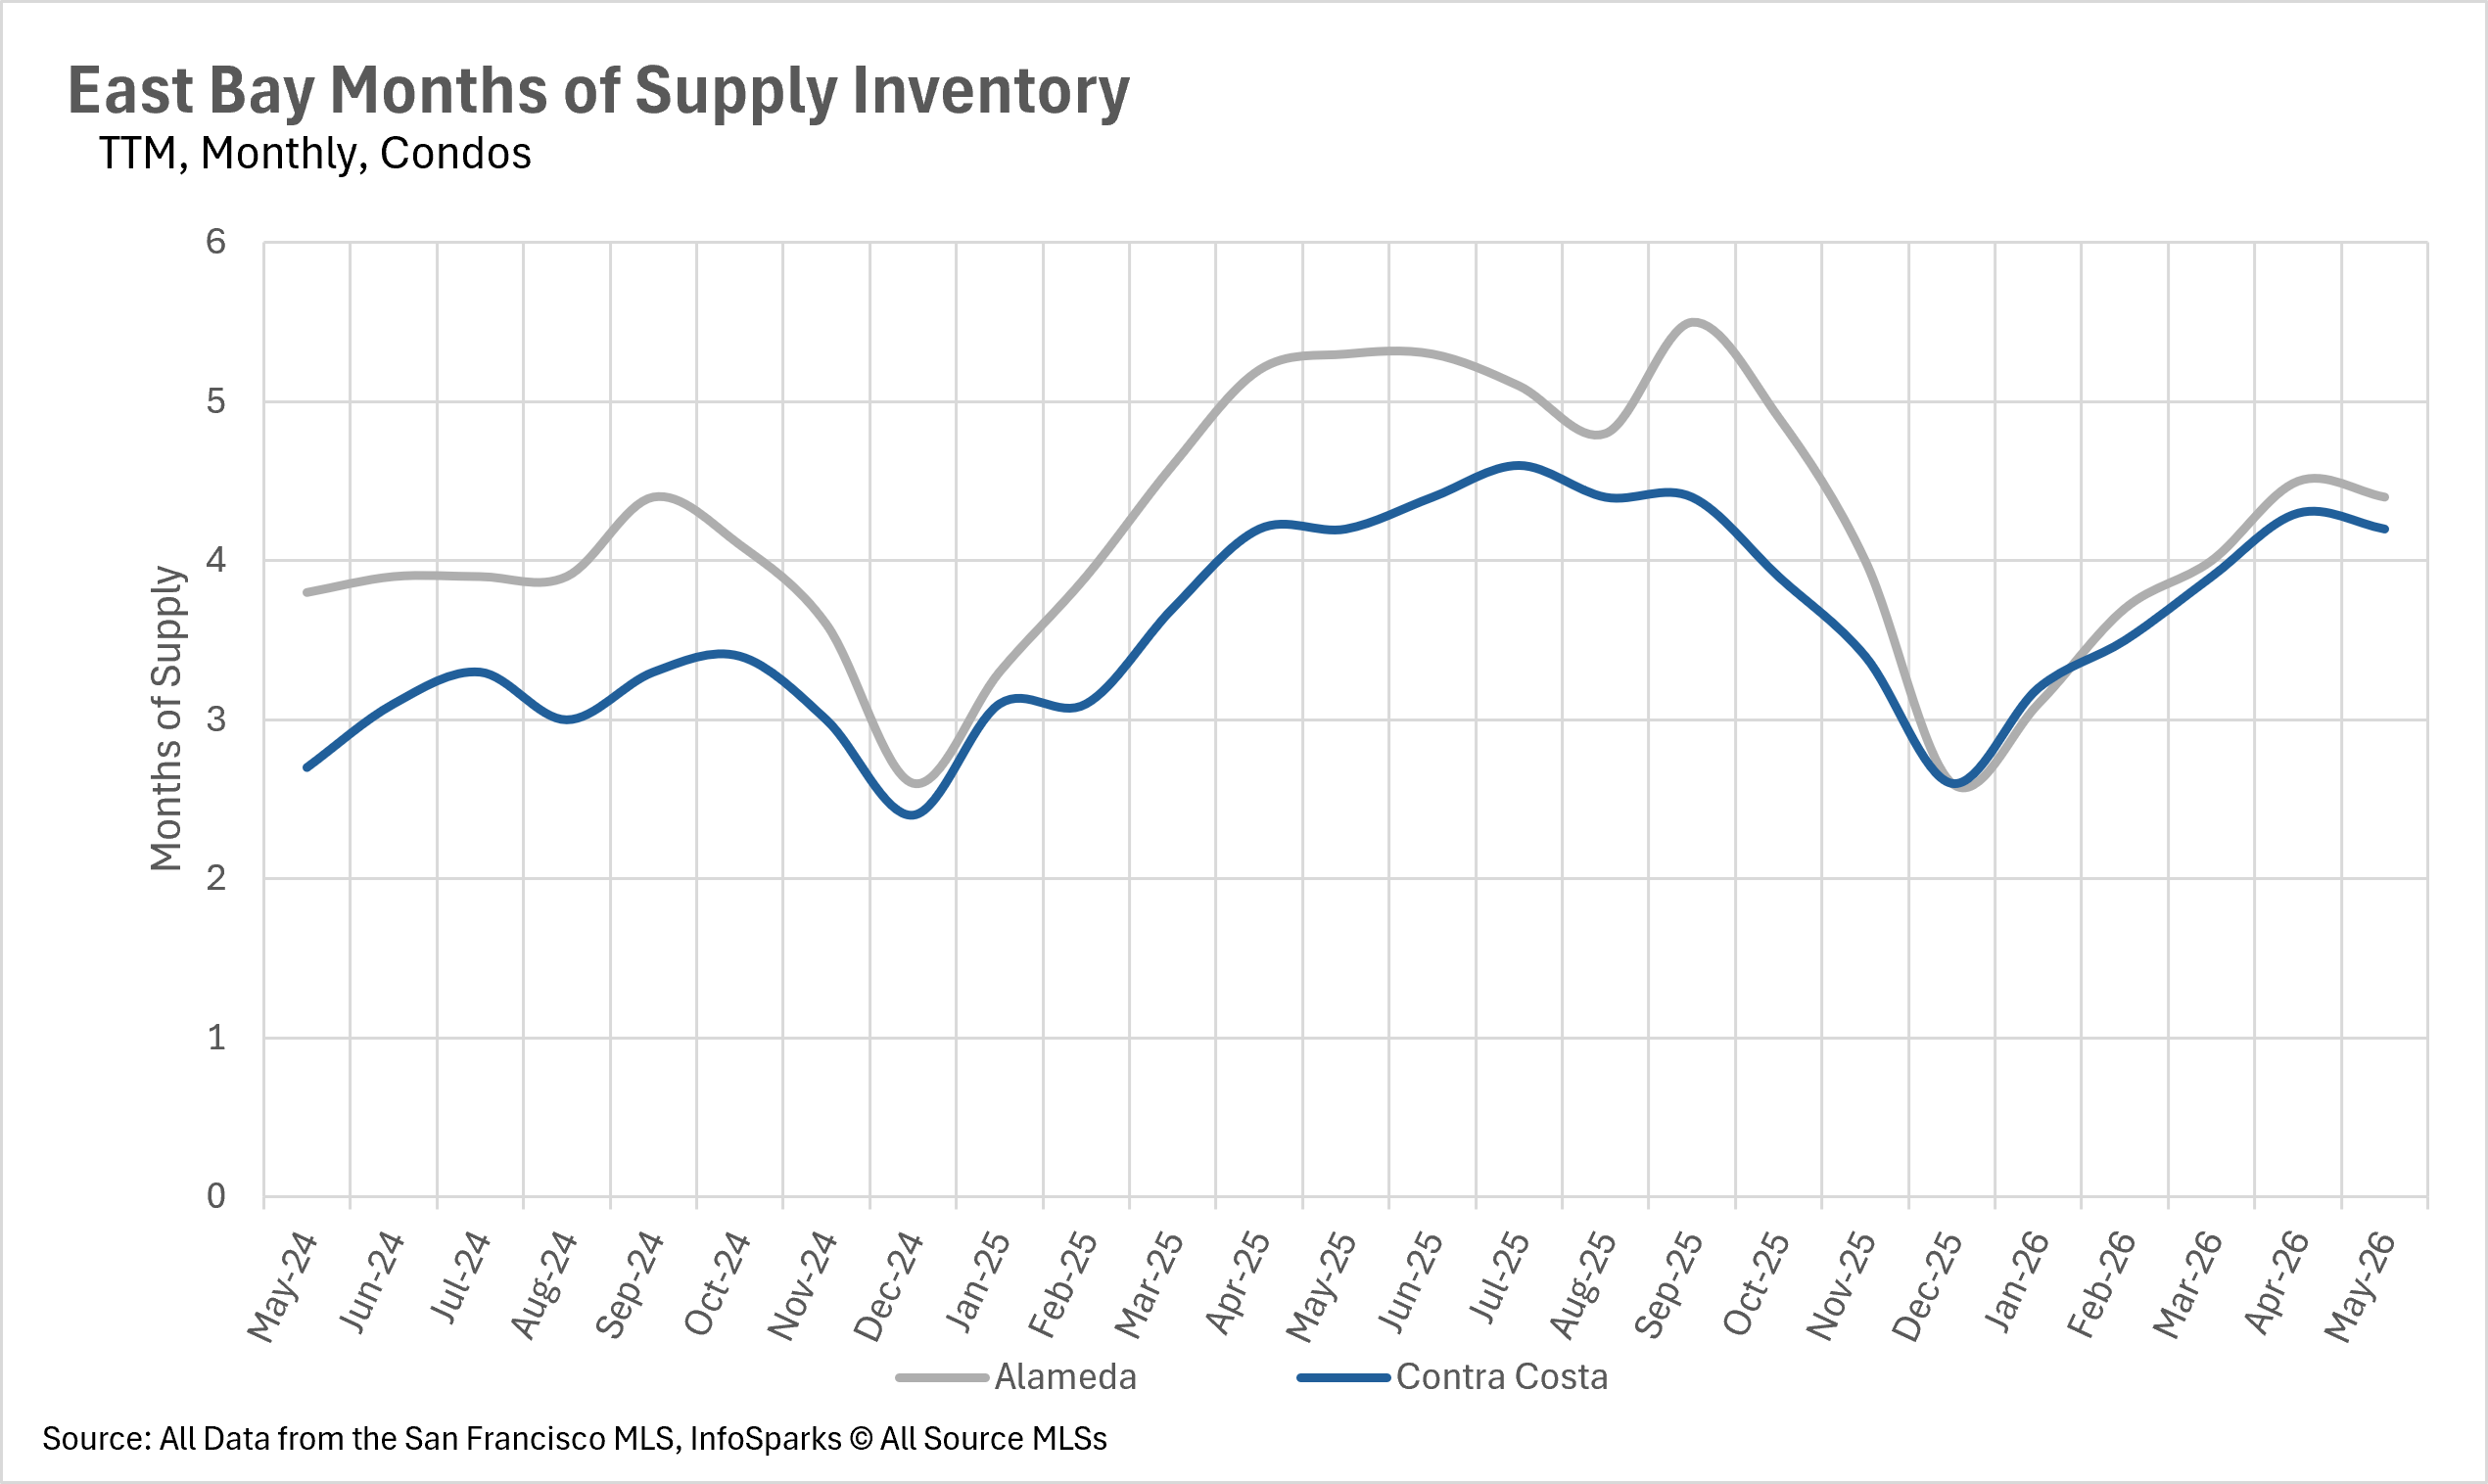
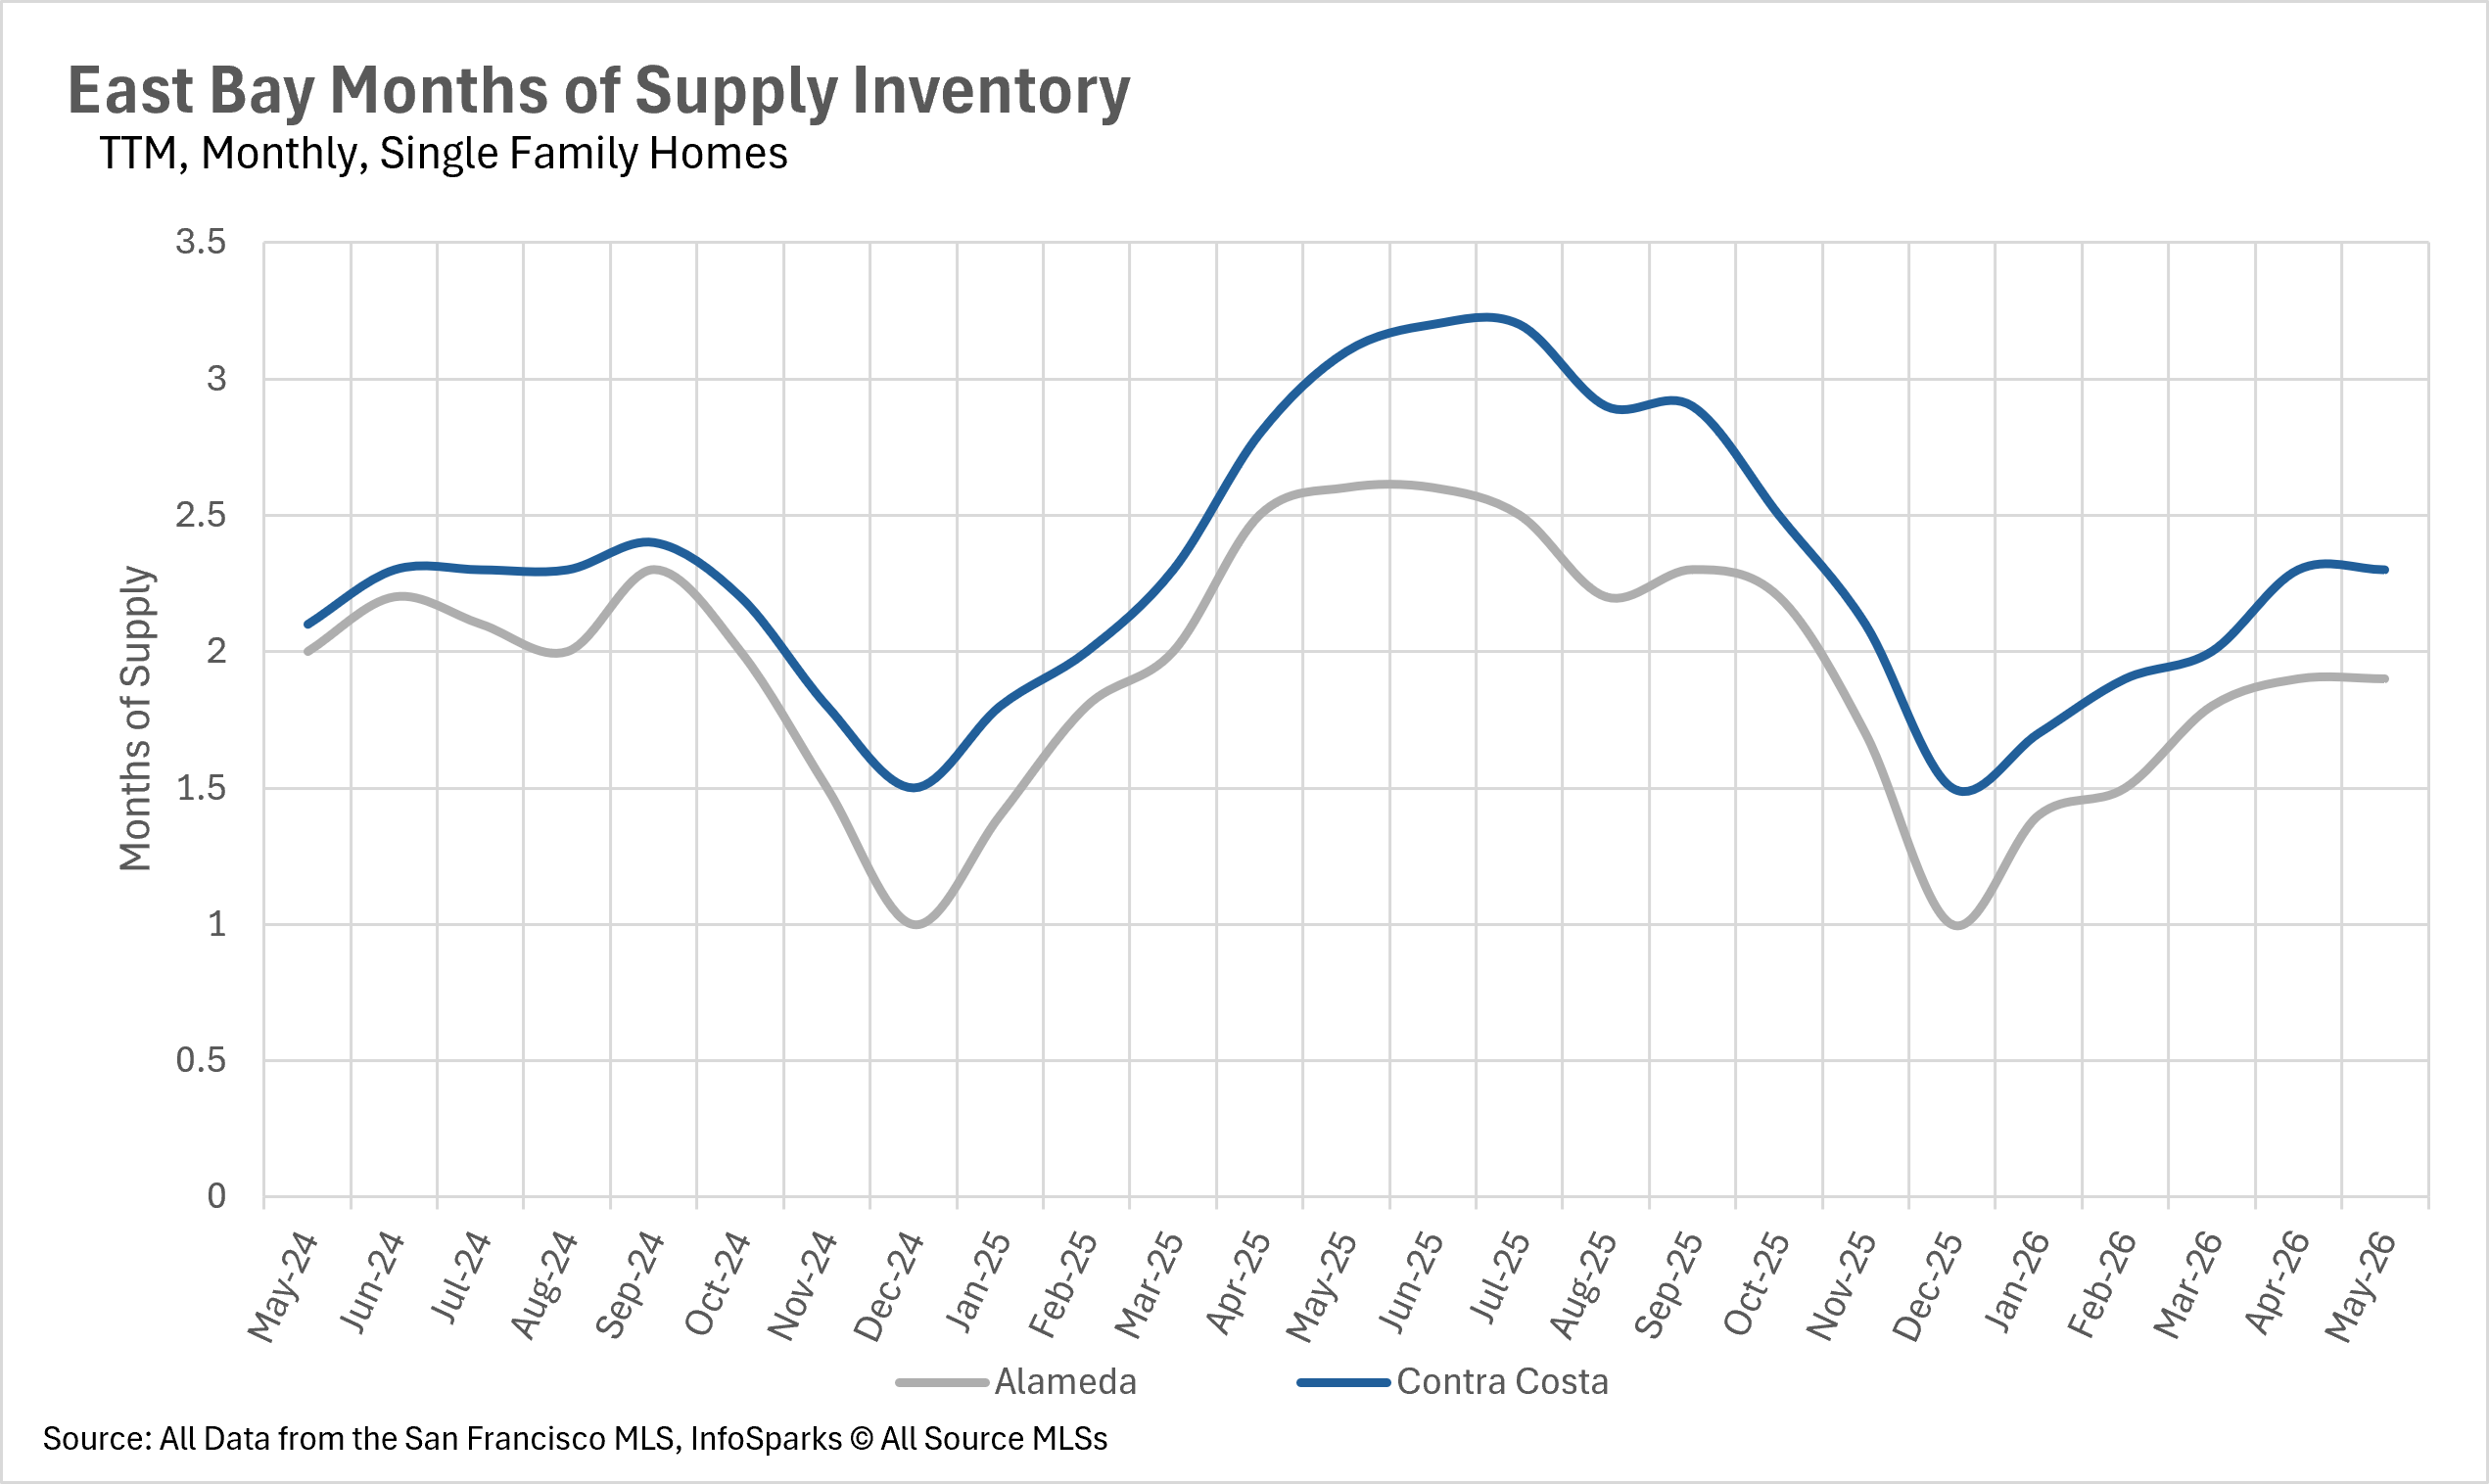
When determining whether a market is a buyers' market or a sellers' market, we look to the Months of Supply Inventory (MSI) metric. The state of California has historically averaged around three months of MSI, so any area with at or around three months of MSI is considered a balanced market. Any market that has lower than three months of MSI is considered a seller's market, whereas markets with more than three months of MSI are considered buyers' markets.
The single-family home market remains firmly in seller's market territory, with just 1.9 months of inventory in Alameda County and 2.3 months in Contra Costa County. These figures represent year-over-year declines of 26.92% and 25.81%, respectively, indicating that competition among buyers shows no signs of letting up. The condo market continues to favor buyers, with Alameda County ending May with 4.4 months of inventory and Contra Costa County with 4.2 months. However, it's worth noting that these figures have come down slightly from last month, suggesting that the condo market may be beginning to tighten as well.
Local Lowdown Data