The Local Lowdown: June 2025
Michelle Kim | July 1, 2025

Michelle Kim | July 1, 2025
Stay up to date on the latest real estate trends.
Michelle Kim | July 17, 2026
Discover the strategies that help San Francisco homes stand out, attract serious buyers, and maximize value before they even hit the market.

Michelle Kim | July 10, 2026
Avoid the most common mistakes homeowners make before listing their property and learn how preparation, pricing, and marketing can help you achieve a successful home s… Read more

Michelle Kim | July 6, 2026
Learn the key factors that help San Francisco homes attract multiple offers, from strategic pricing and professional marketing to home presentation and buyer demand.
Michelle Kim | July 1, 2026
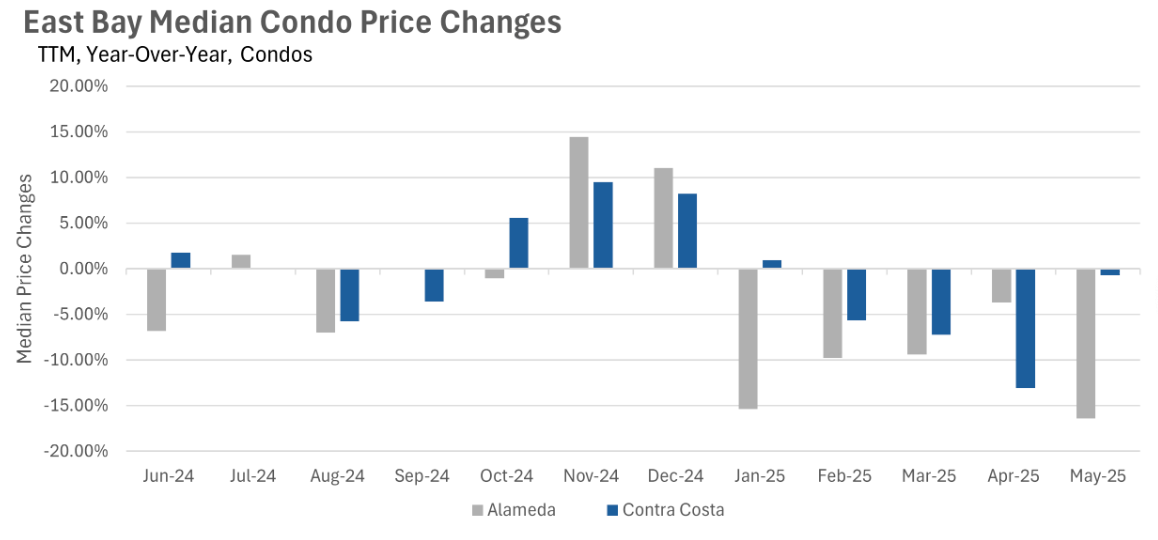
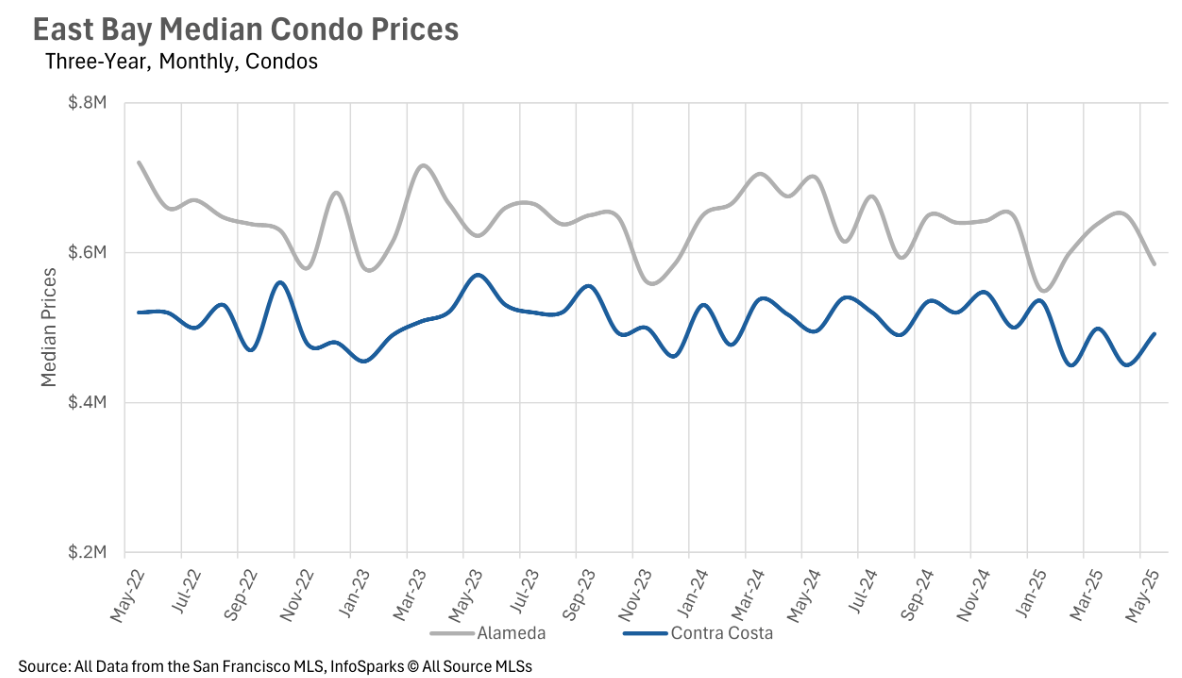
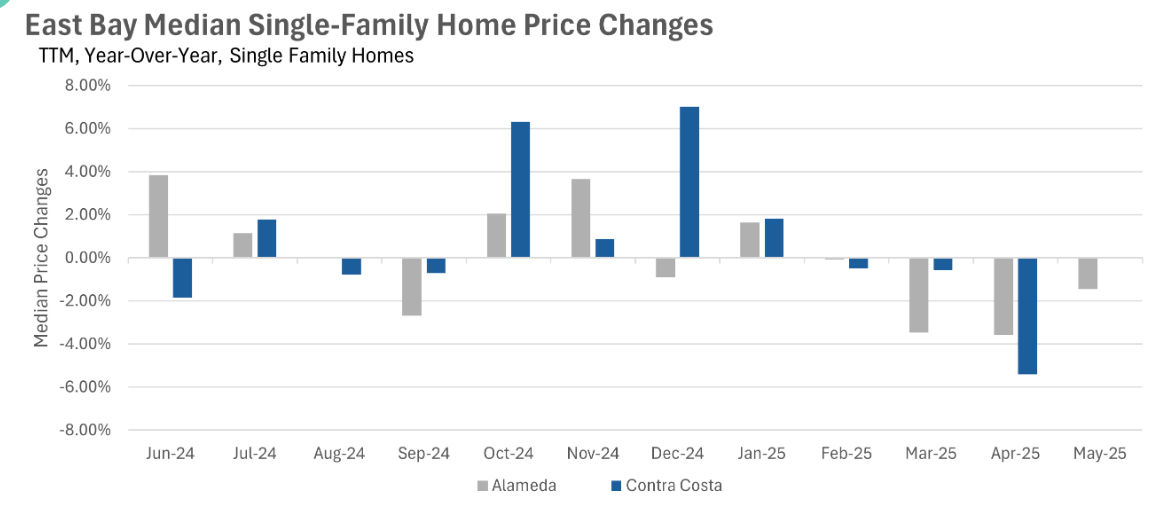
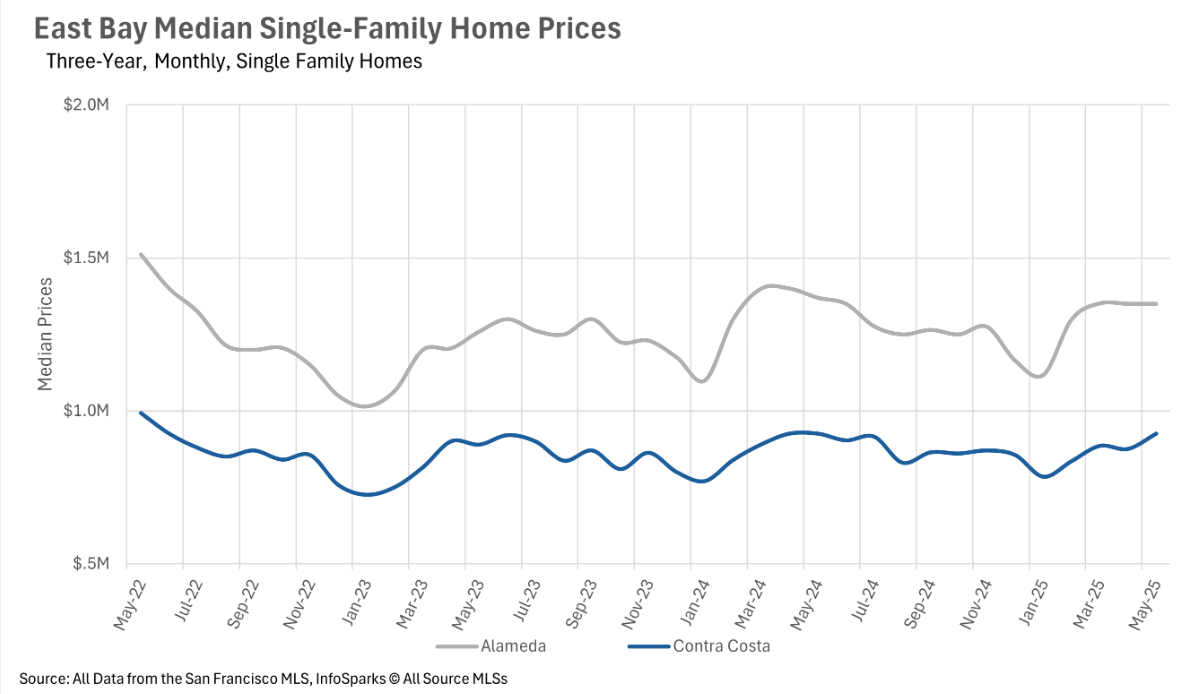
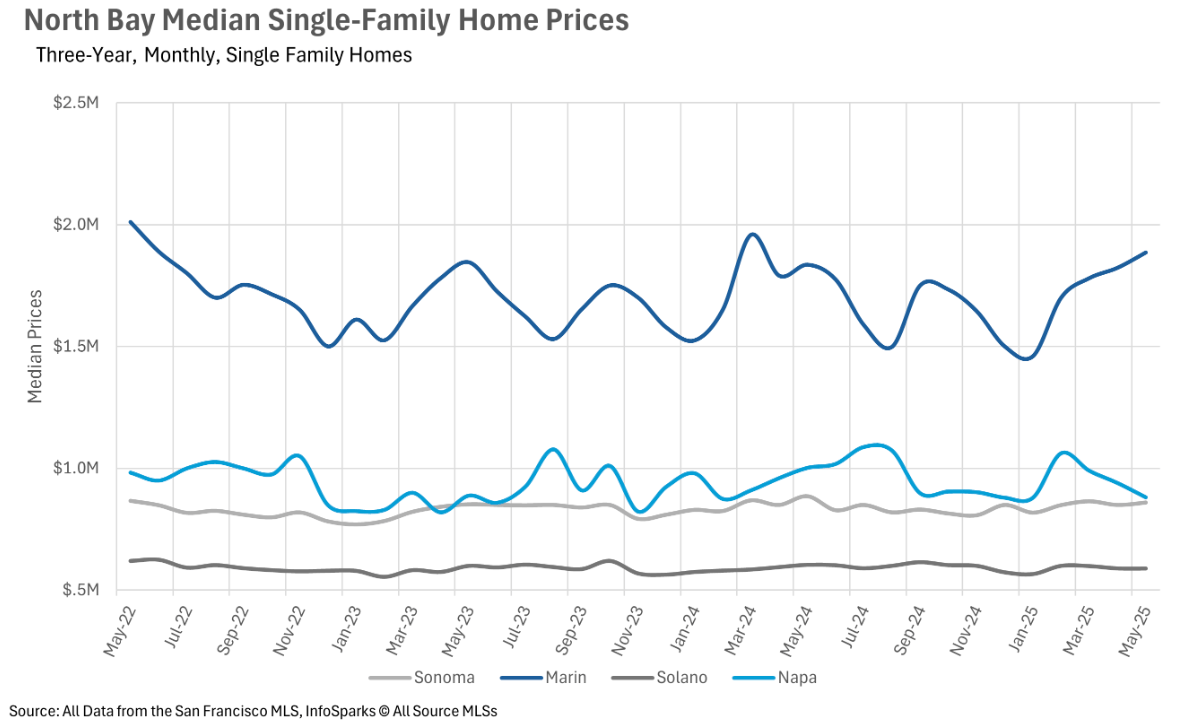
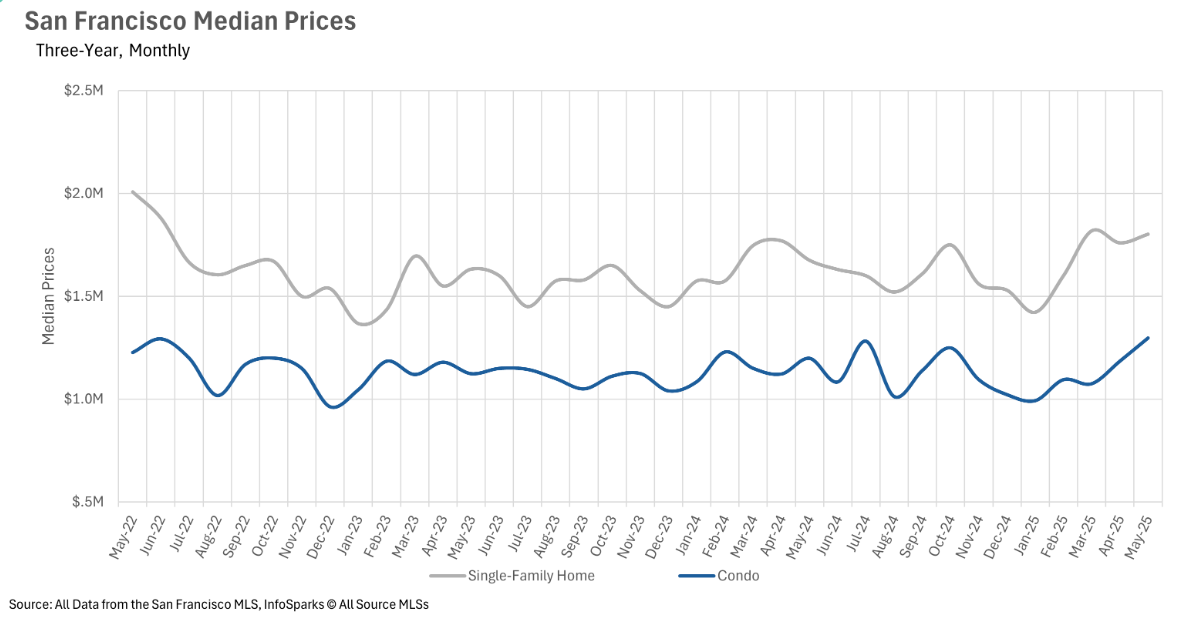
Quick Take: Prices are rising across much of the Bay Area, with San Francisco single-family homes breaching the $2.2 million mark for the first time and the East Bay p… Read more

Michelle Kim | July 1, 2026
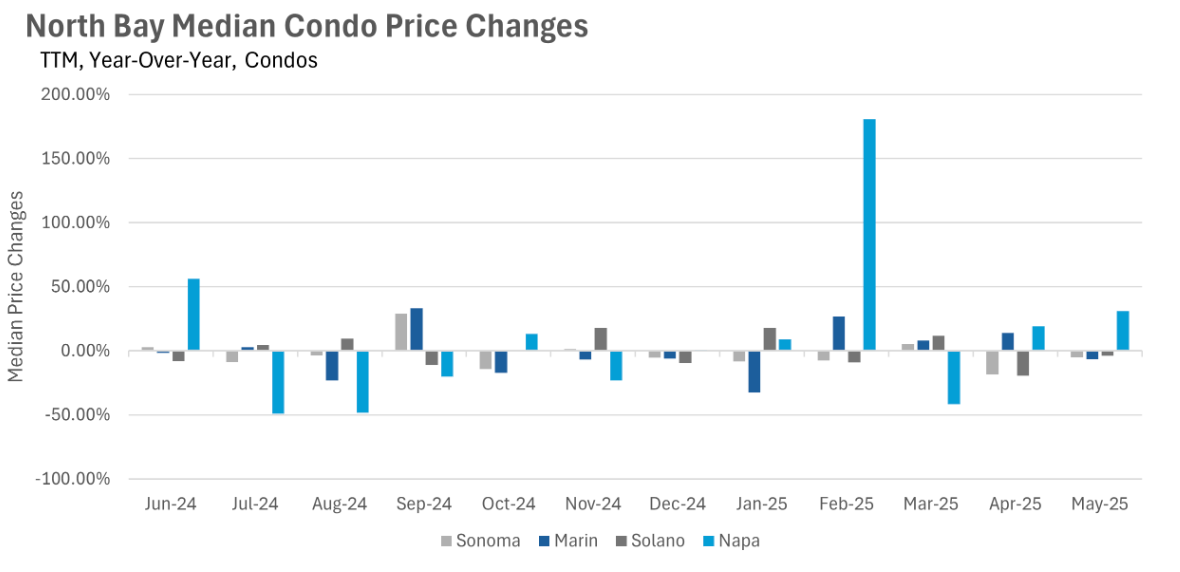
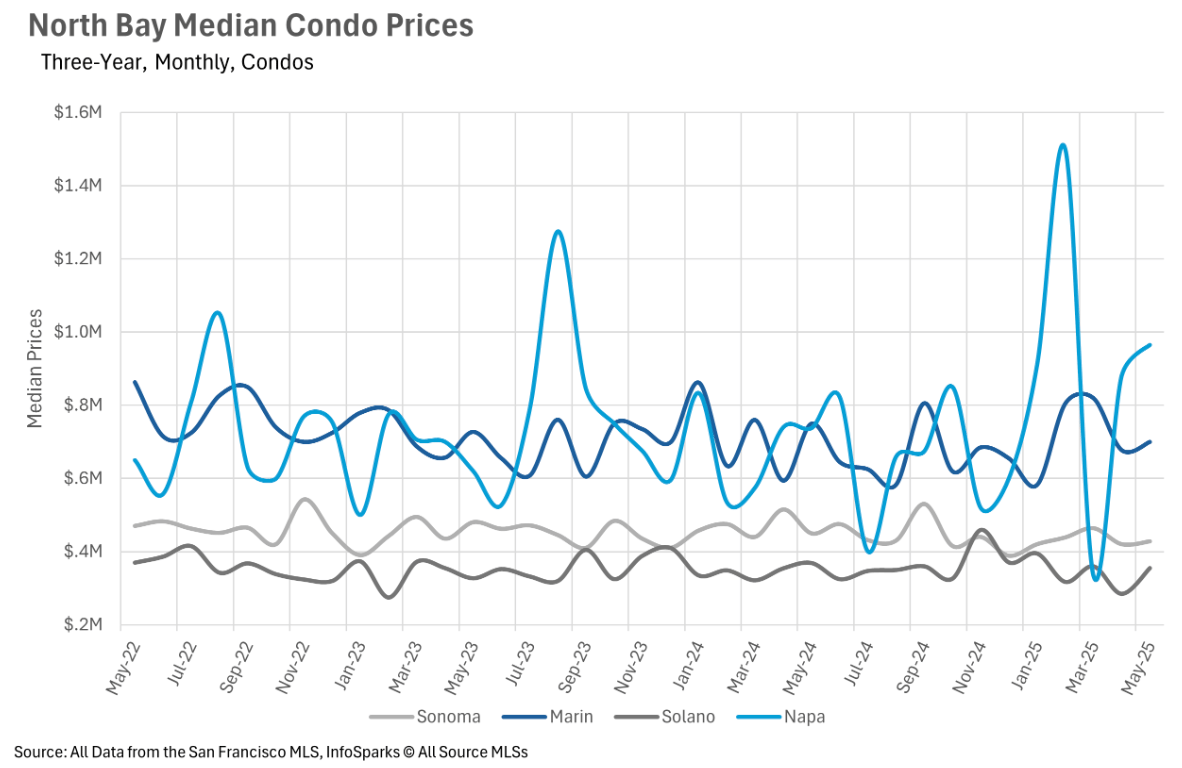
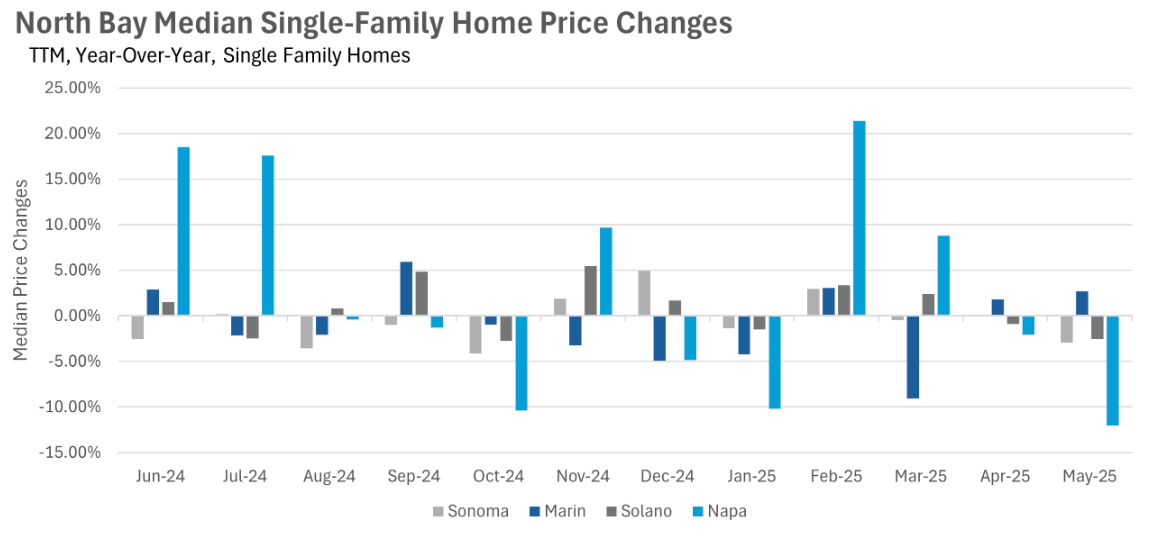
Quick Take: Median sale prices posted gains in three of four counties, with Sonoma County leading the way at 2.33% year-over-year growth, while Marin County saw a 4.70… Read more
Michelle Kim | July 1, 2026
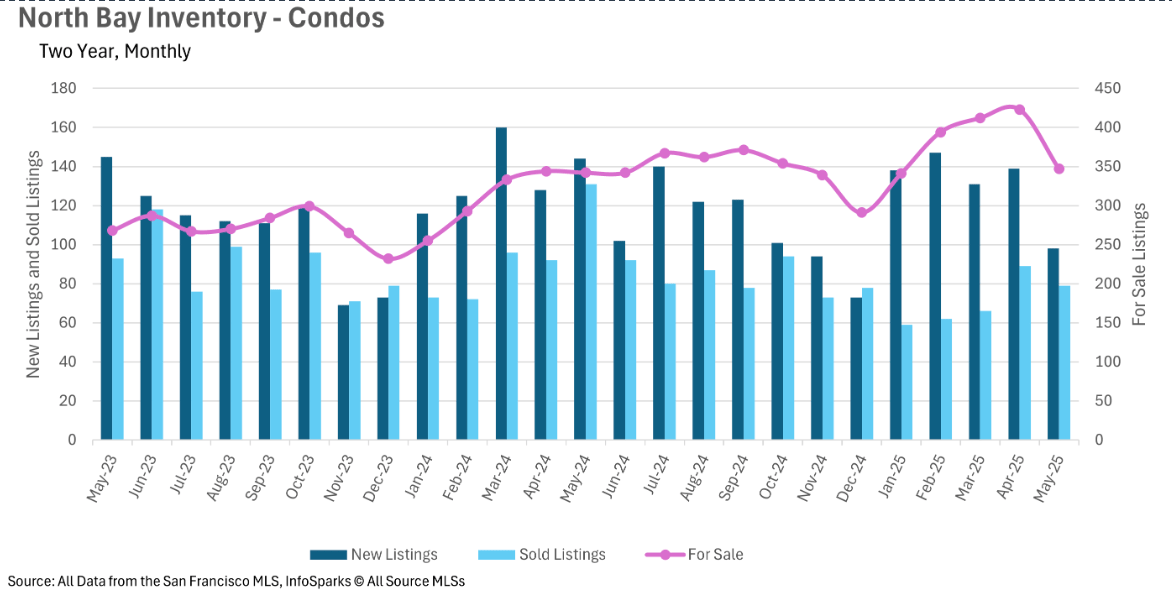
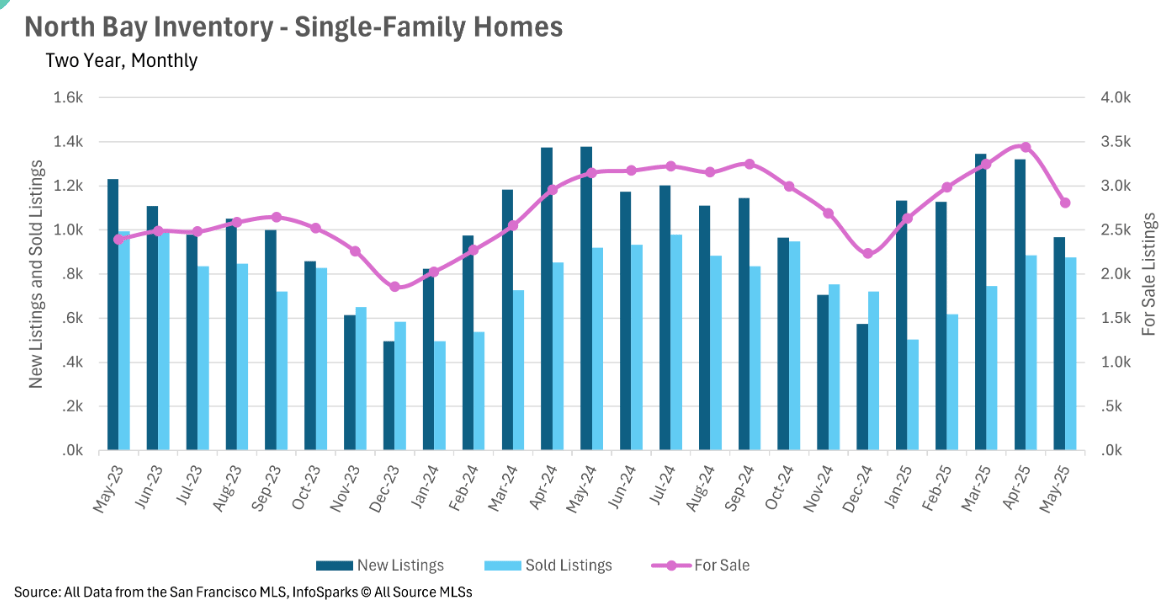
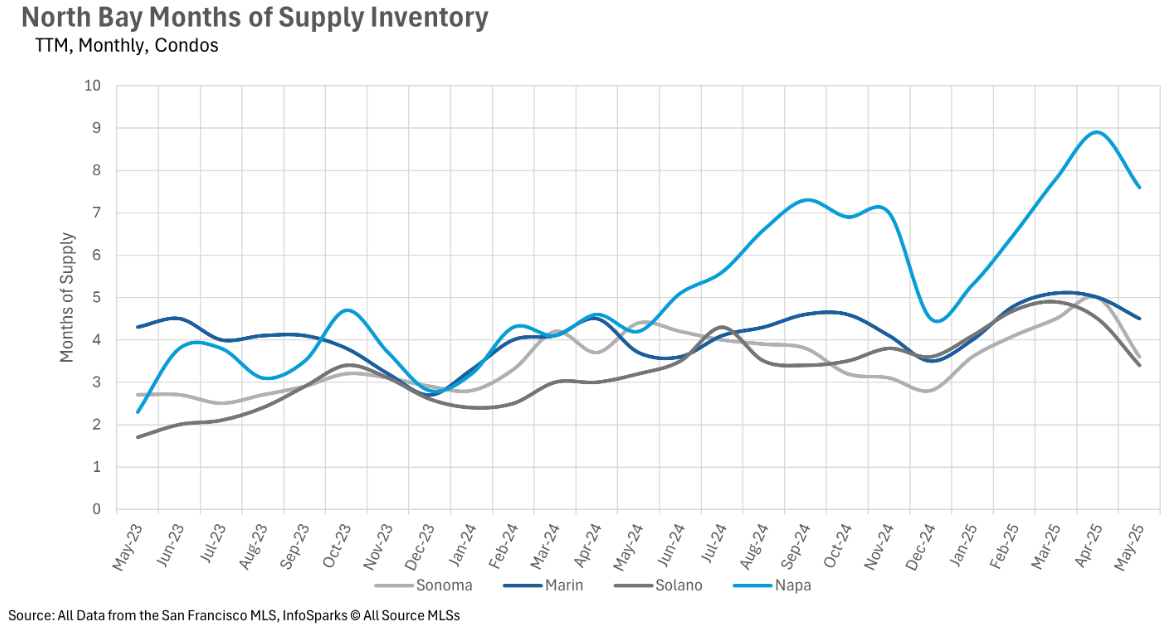
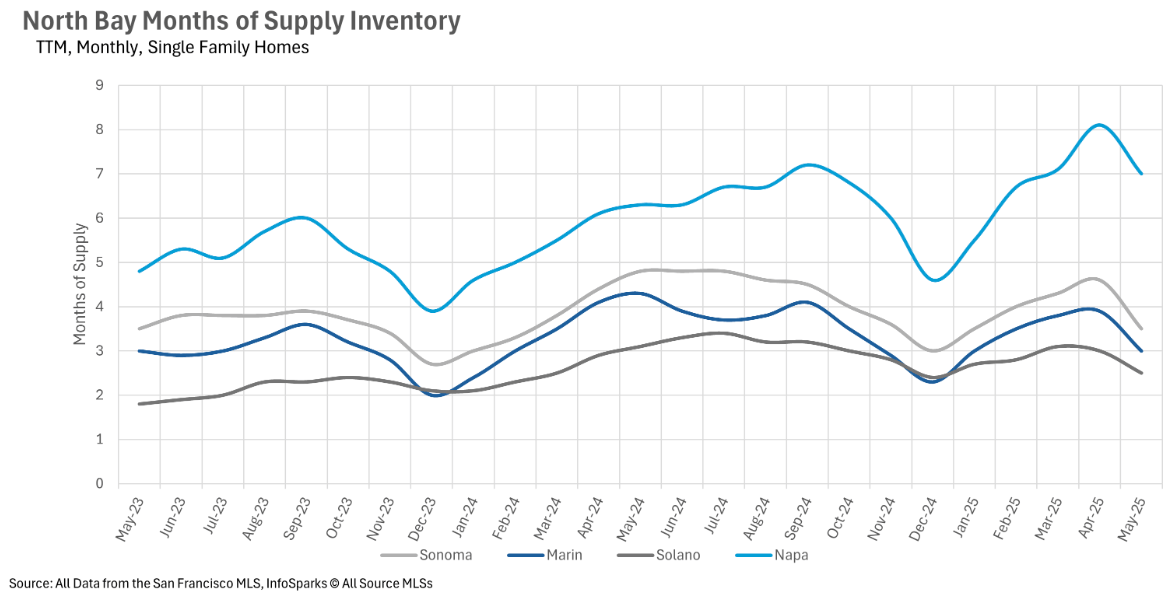
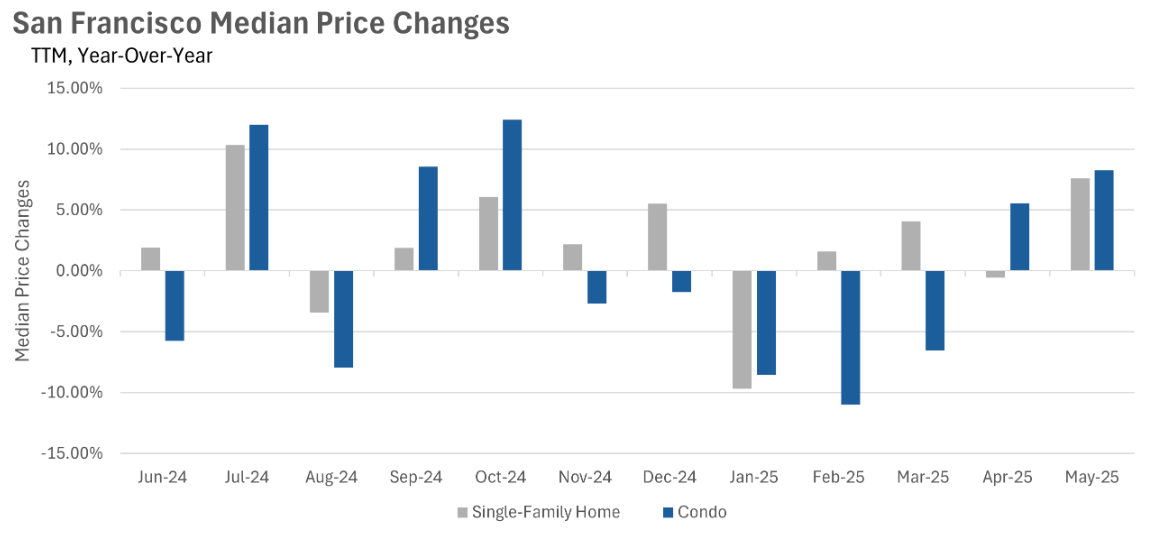
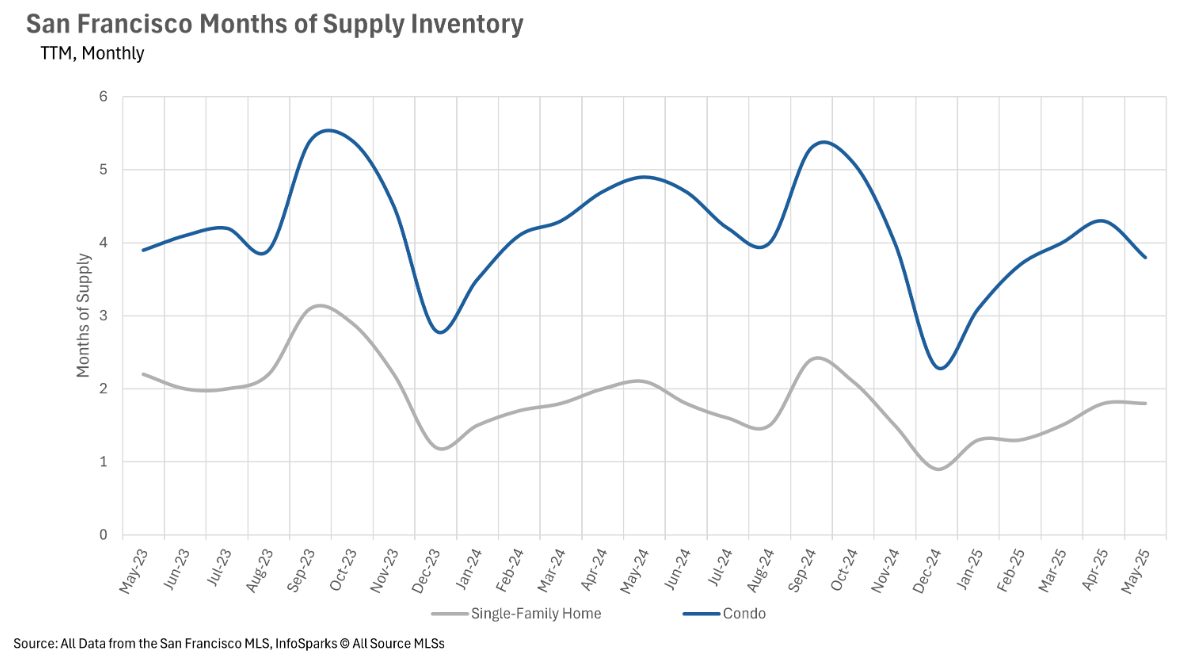
Quick Take: Prices are on the rise across the board, with single-family homes and condos both posting year-over-year gains for the first time in over a year. Inventory… Read more
You’ve got questions and we can’t wait to answer them.