The Local Lowdown: July 2025

Michelle Kim  |  August 1, 2025

The Local Lowdown: July 2025

The Local Lowdown

Quick Take:
  • Median sale prices continued to increase throughout San Francisco in the month of June.
  • Inventory continues to be a huge issue in San Francisco, as levels continue to dwindle.
  • Due to the inventory constraints in the area, listings are scooped up off the market at breakneck speed.
 
Note: You can find the charts/graphs for the Local Lowdown at the end of this section.
 

Condo values have increased by more than 10% over the course of the past year

Median sale prices have been on the rise over the past few months in San Francisco, and there was no exception in the month of June. Single-family home median sale prices rose by 4.42% on a year-over-year basis, while condo median sale prices rose by 10.52%. Additionally, the average single-family home sells for 112% of the original listing price, while the average condo sells for a slight discount, at just 99.7% of the original listing price.
 

Inventories continue to dwindle, as homeowners are reluctant to sell their properties

This rise in prices that we’ve seen has been fueled by a lack of new supply hitting the market. Each and every month, we’ve seen inventories slowly get bought up and seemingly taken off the market for good. In the month of June, we saw 7.87% fewer single-family homes on the market when compared to this time last year. When we turn to the condo market, we see 18.77% fewer listings on the market at the end of June.
 

San Francisco remains one of the few markets where we’re seeing listings spend less time on the market

As you might expect, given the rising prices and inventory issues that we’ve been observing throughout San Francisco, listings are being bought up incredibly quickly. The average single-family home spends just 14 days on the market, while the average condo spends 31 days on the market. These figures represent a year-over-year decrease of 6.67% in the single-family home market and no change in the condo market.
 

The single-family home market continues to be seller-dominated, while buyers have a bit of leverage in the condo market

When determining whether a market is a buyers’ market or a sellers’ market, we look to the Months of Supply Inventory (MSI) metric. The state of California has historically averaged around three months of MSI, so any area with at or around three months of MSI is considered a balanced market. Any market that has lower than three months of MSI is considered a seller’s market, whereas markets with more than three months of MSI are considered buyers’ markets.
 
The single-family home market in San Francisco has been dominated by sellers for quite some time, and that did not change in the month of June, with the area having just 1.5 months' worth of inventory on the market. In the condo market, buyers are slowly losing their bargaining power as inventory levels slowly dwindle away over time. However, there’s still some room to negotiate in the condo market, with 3.5 months of supply listed for sale.
 

Local Lowdown Data

Line chart comparing San Francisco single-family home and condo prices as a percentage of original price, June 2022–June 2025.Chart of San Francisco condo listings and sales from June 2023 to June 2025.San Francisco median price changes chart comparing single-family homes and condos from July 2024 to June 2025.Chart of San Francisco single-family home listings, with monthly new and sold listings and homes for sale, June 2023–June 2025.Line chart compares San Francisco condo and single-family home days on market, June 2023–June 2025.Chart comparing San Francisco condo and single-family home months of supply from June 2023 to June 2025.San Francisco monthly median prices, June 2022–June 2025: single-family homes in gray and condos in blue.


Recent Blog Posts

Stay up to date on the latest real estate trends.

Living in NoPa, San Francisco: A Guide to the Neighborhood Lifestyle

Michelle Kim  |  October 19, 2026

Explore life in NoPa, San Francisco, from classic Victorian homes and local dining on Divisadero Street to nearby parks, walkability, and neighborhood charm.
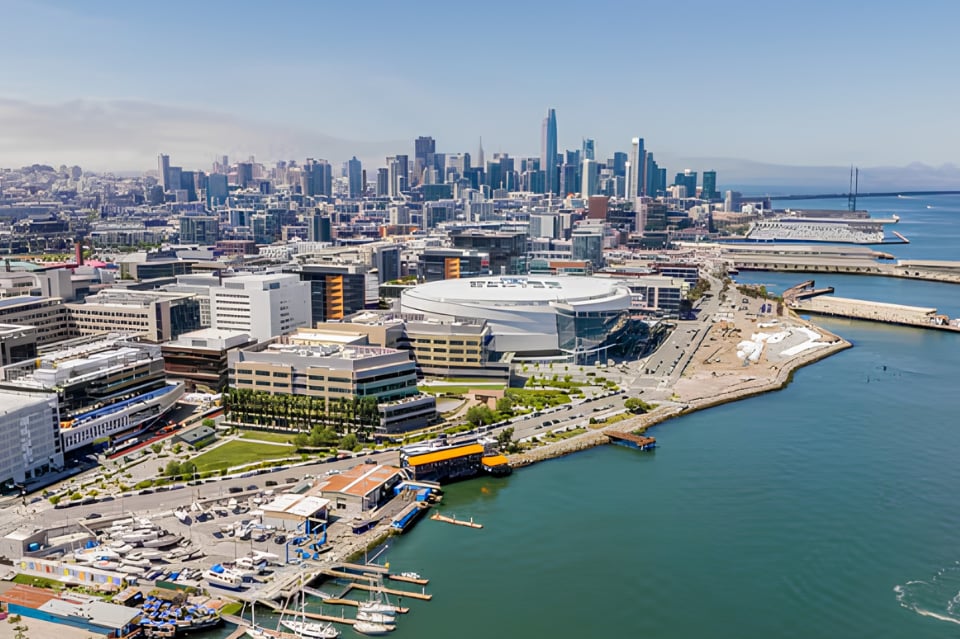
Aerial panorama of San Francisco's downtown skyline and waterfront along the bay.
Living in Mission Bay: A Guide to the Neighborhood Lifestyle

Michelle Kim  |  October 2, 2026

Explore life in Mission Bay, from waterfront parks and modern residences to dining, entertainment, outdoor recreation, and convenient city connections.

The Big Story Market Update
The Local Lowdown: September 2026

Michelle Kim  |  September 30, 2026

Quick Take: Median home sale prices slipped for the second straight month in August, falling to $429,100 from June's peak of $442,800, though they remain slightly abov… Read more

North Bay Market Update
The Local Lowdown: September 2026

Michelle Kim  |  September 30, 2026

Quick Take: Marin County dominated August, with the median single-family home selling for $1,778,000, a 15.83% jump over last August, while Sonoma, Solano, and Napa Co… Read more

East Bay Market Update
The Local Lowdown: September 2026

Michelle Kim  |  September 30, 2026

Quick Take: Single-family prices are holding firm year over year, with Alameda County up slightly and Contra Costa County up nearly 3%, while the condo picture has spl… Read more

South Bay Market Update
The Local Lowdown: September 2026

Michelle Kim  |  September 30, 2026

Quick Take: Single-family median prices diverged again in August, with San Mateo County up nearly 8% year over year while Santa Clara and Santa Cruz Counties slipped m… Read more

We Would Love to Meet You!

You’ve got questions and we can’t wait to answer them.