Leave a Message

Thank you for your message. We will be in touch with you shortly.

The Local Lowdown: July 2024

Michelle Kim  |  July 26, 2024

The Local Lowdown: July 2024

The Local Lowdown

Quick Take:
  • The median single-family home price in Santa Cruz reached a record high in June. As more new listings come to market, we expect prices to continue rising and to reach new highs during the summer months.
  • Active listings, sales, and new listings fell across most of the Bay Area month over month, which is normal this time of year. We expect inventory growth to slow in the second half of the year.
  • Months of Supply Inventory has remained below three months of supply for single-family homes, indicating a sellers’ market. For condos, MSI has risen and now shows more balanced markets in the Bay Area.
Note: You can find the charts/graphs for the Local Lowdown at the end of this section.
 

Median single-family home price hit a record high in Santa Cruz

In the Greater Bay Area, low inventory and high demand have more than offset the downward price pressure from higher mortgage rates, and prices generally haven’t experienced larger drops due to higher mortgage rates. In May, median single-family home prices reached record highs in San Mateo, Santa Clara, and Sonoma, and prices in the rest of the Bay Area were only slightly below their all-time highs. In June, Santa Cruz was the only county with single-family home prices at peak level. Even Marin and San Francisco prices, which were extremely far below their previous peaks, have risen dramatically in 2024. Condo prices have been less volatile than those of single-family homes, moving more horizontally over the past two years. We expect prices in the Bay Area to remain near all-time highs until the mid-summer, before contracting in the second half of the year. Additionally, inventory is so low that it will create price support as supply declines in the second half of the year.
 
High mortgage rates soften both supply and demand, but home buyers and sellers seemed to tolerate rates above 6%. Now that rates are near 7% again, sales are slowing during the time of the year when sales tend to be at their highest. This phenomenon isn’t great for the market, but it isn’t terrible, either, as it may allow inventory to build in a massively undersupplied market.
 

Inventory, sales and new listings declined in June

Since the start of 2023, single-family home inventory has followed fairly typical seasonal trends, but at significantly depressed levels. Low inventory and fewer new listings have slowed the market considerably. Typically, inventory peaks in July or August and declines through December or January, but the lack of new listings prevented meaningful inventory growth. New listings were exceptionally low, so the little inventory growth in 2023 was driven by softening demand. In December 2023, inventory and sales dropped. However, more new listings have come to the market in 2024, which has driven the significant increase in sales so far this year. With the exception of San Francisco, which fell to record low inventory, the Bay Area markets are looking much healthier from an inventory perspective. The high level of growth seen in inventory and new listings in the first five months of the year are both positive and normal. With the current inventory levels, far more new listings could come to the market, but we aren’t anticipating a higher level of new listings than usual.
 

Months of Supply Inventory indicated a sellers’ market in most of the Bay Area

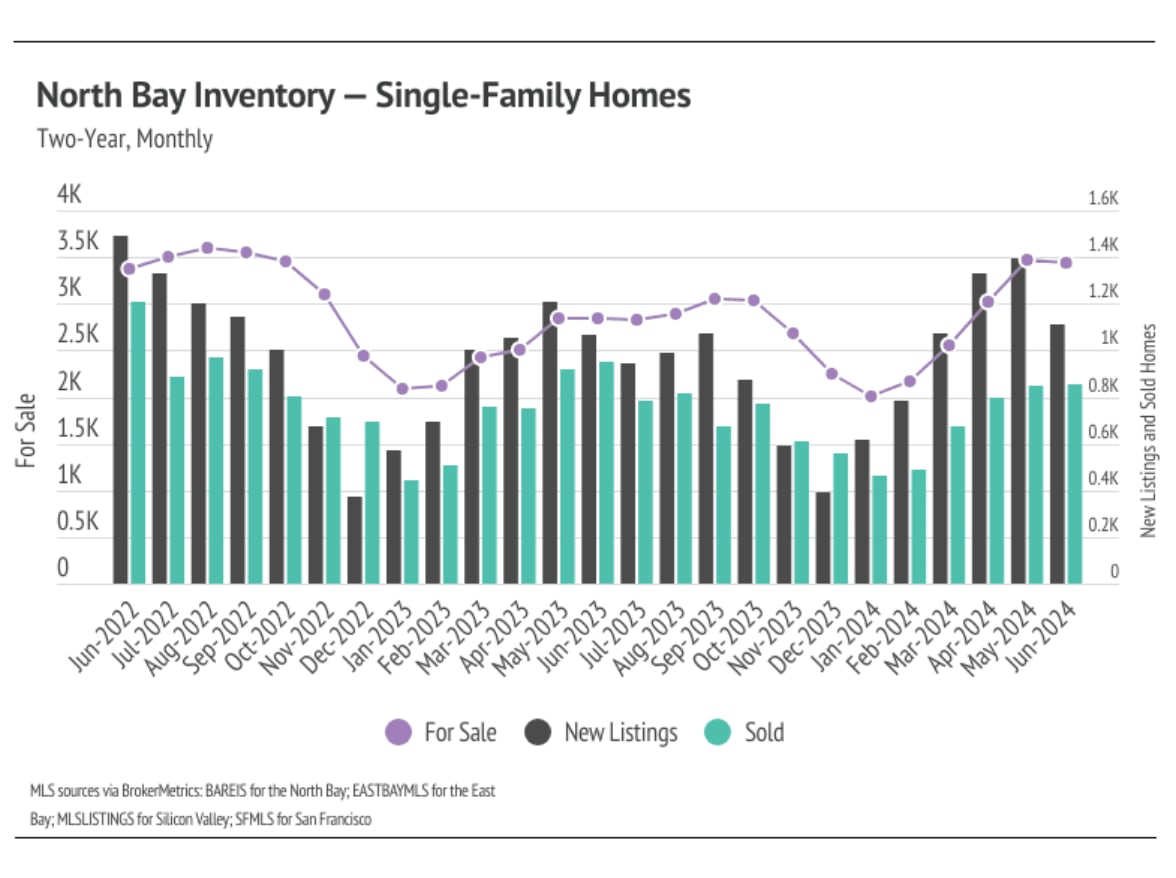
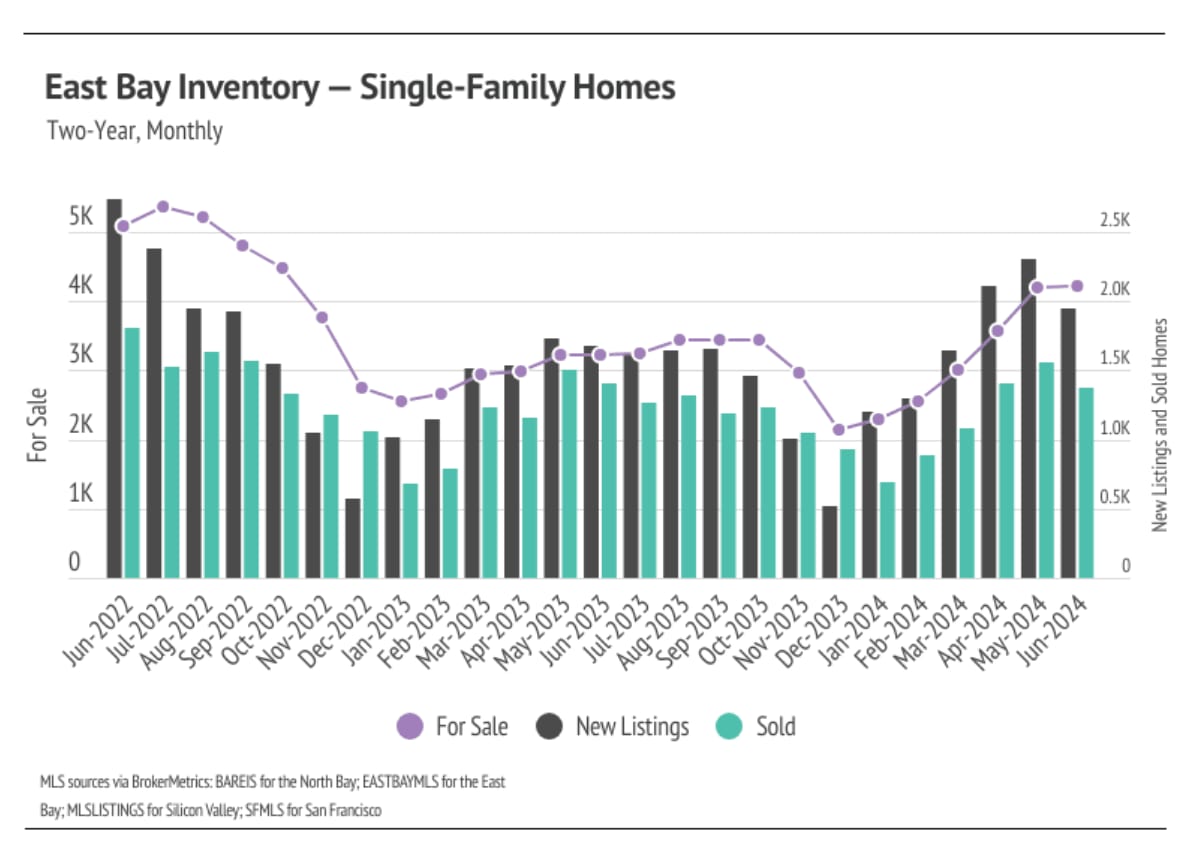
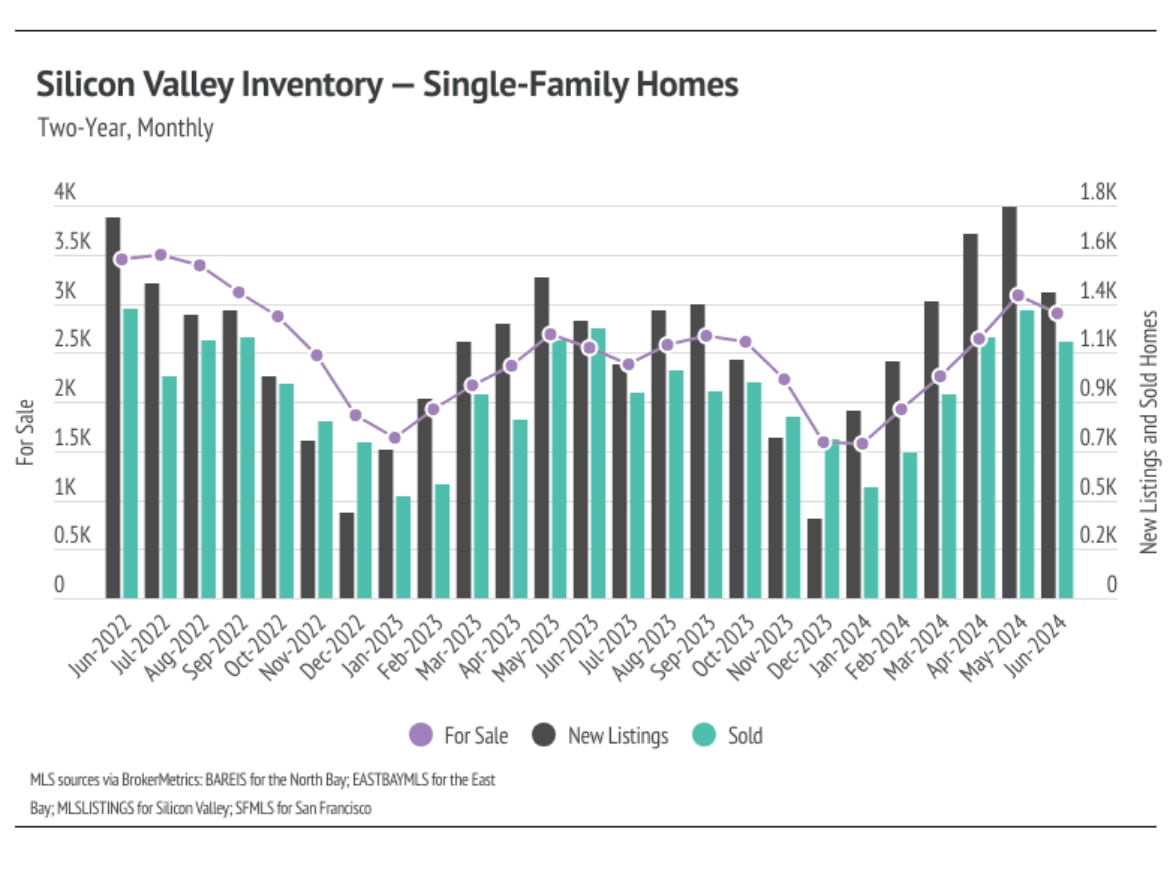
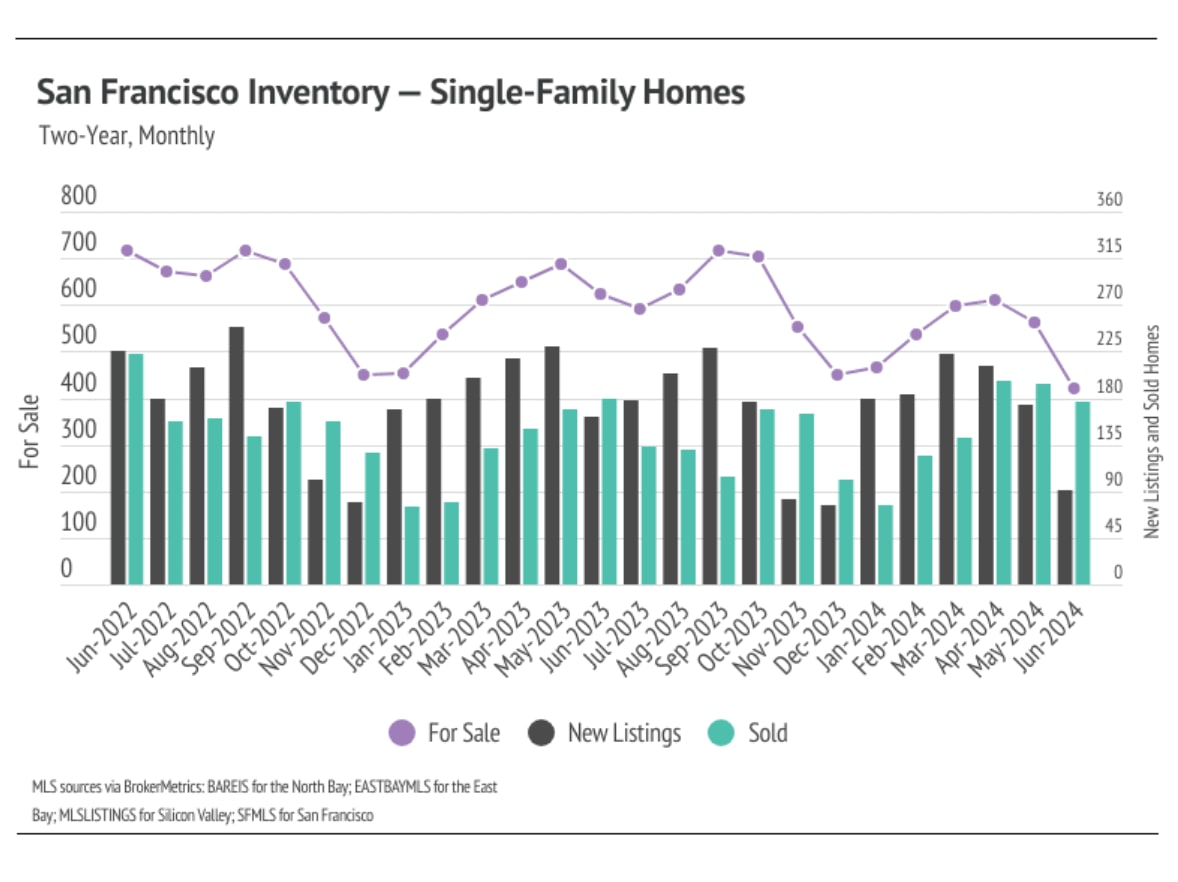
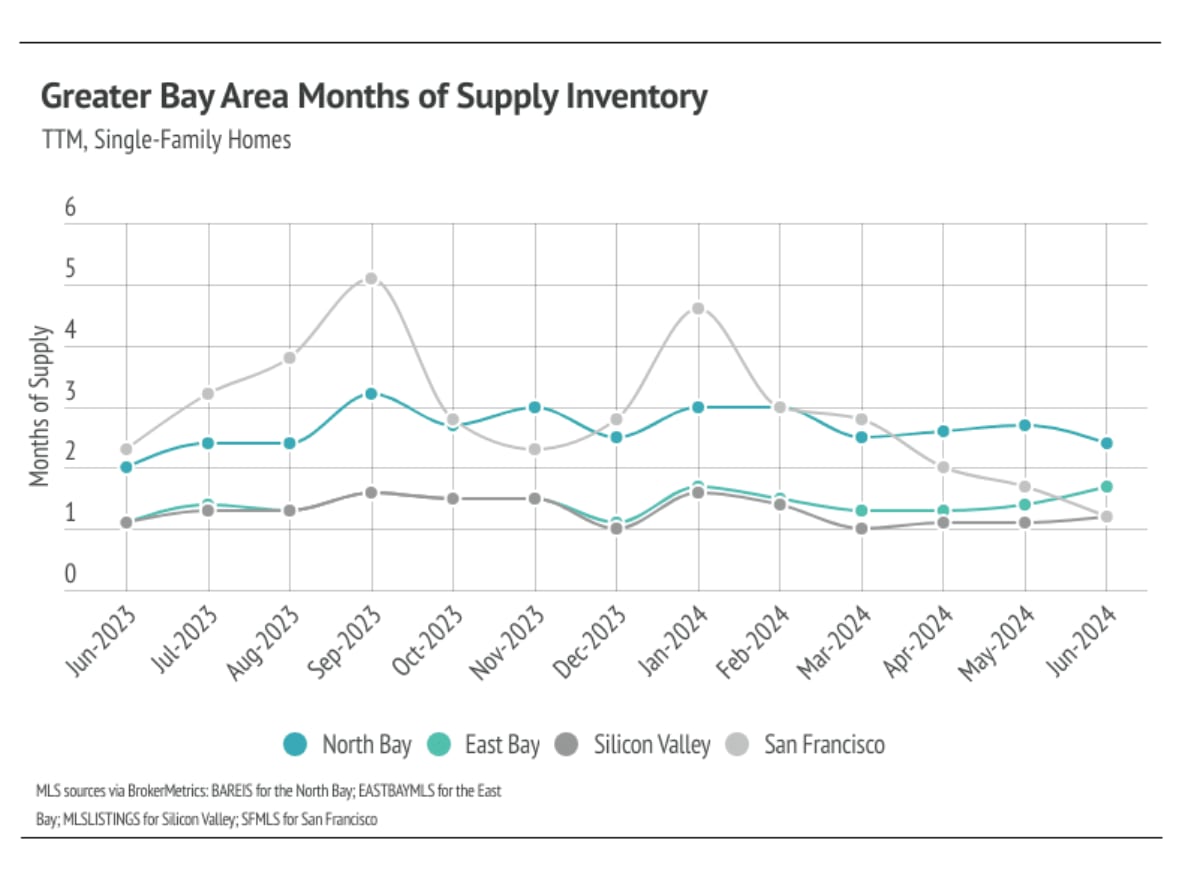
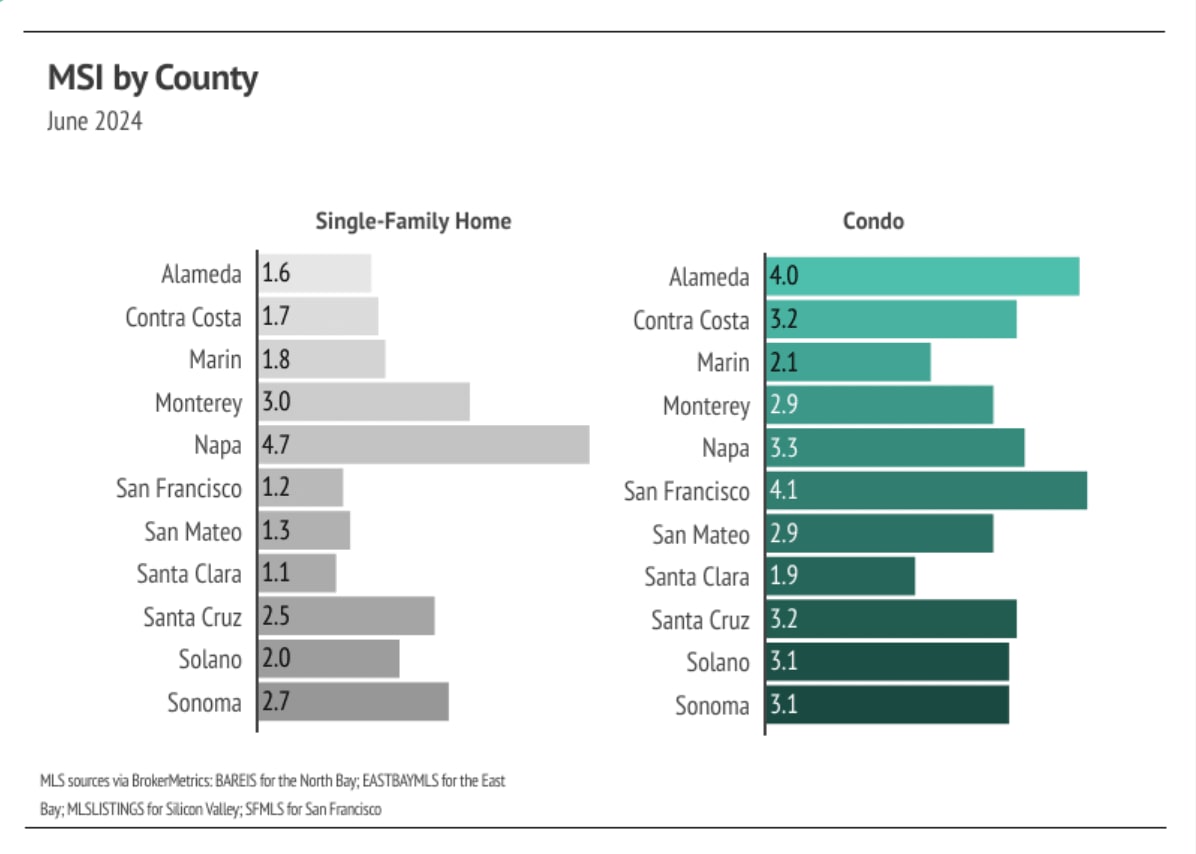
Months of Supply Inventory (MSI) quantifies the supply/demand relationship by measuring how many months it would take for all current homes listed on the market to sell at the current rate of sales. The long-term average MSI is around three months in California, which indicates a balanced market. An MSI lower than three indicates that there are more buyers than sellers on the market (meaning it’s a sellers’ market), while a higher MSI indicates there are more sellers than buyers (meaning it’s a buyers’ market). The Bay Area markets tend to favor sellers, which is reflected in their low MSIs. San Francisco MSI is notable for its variability over the past year, oscillating from buyers’ to sellers’ markets twice over the course of 12 months. Currently, MSI is below three months of supply (a sellers’ market) in every Bay Area county, except for single-family homes in Napa, which favor buyers, and condos in the North Bay, East Bay, and San Francisco, which are now balanced.

Local Lowdown Data


We Would Love to Meet You!

You’ve got questions and we can’t wait to answer them.