Leave a Message

Thank you for your message. We will be in touch with you shortly.

The Local Lowdown: January 2026

Michelle Kim  |  January 31, 2026

The Local Lowdown: January 2026

The Local Lowdown

Quick Take:
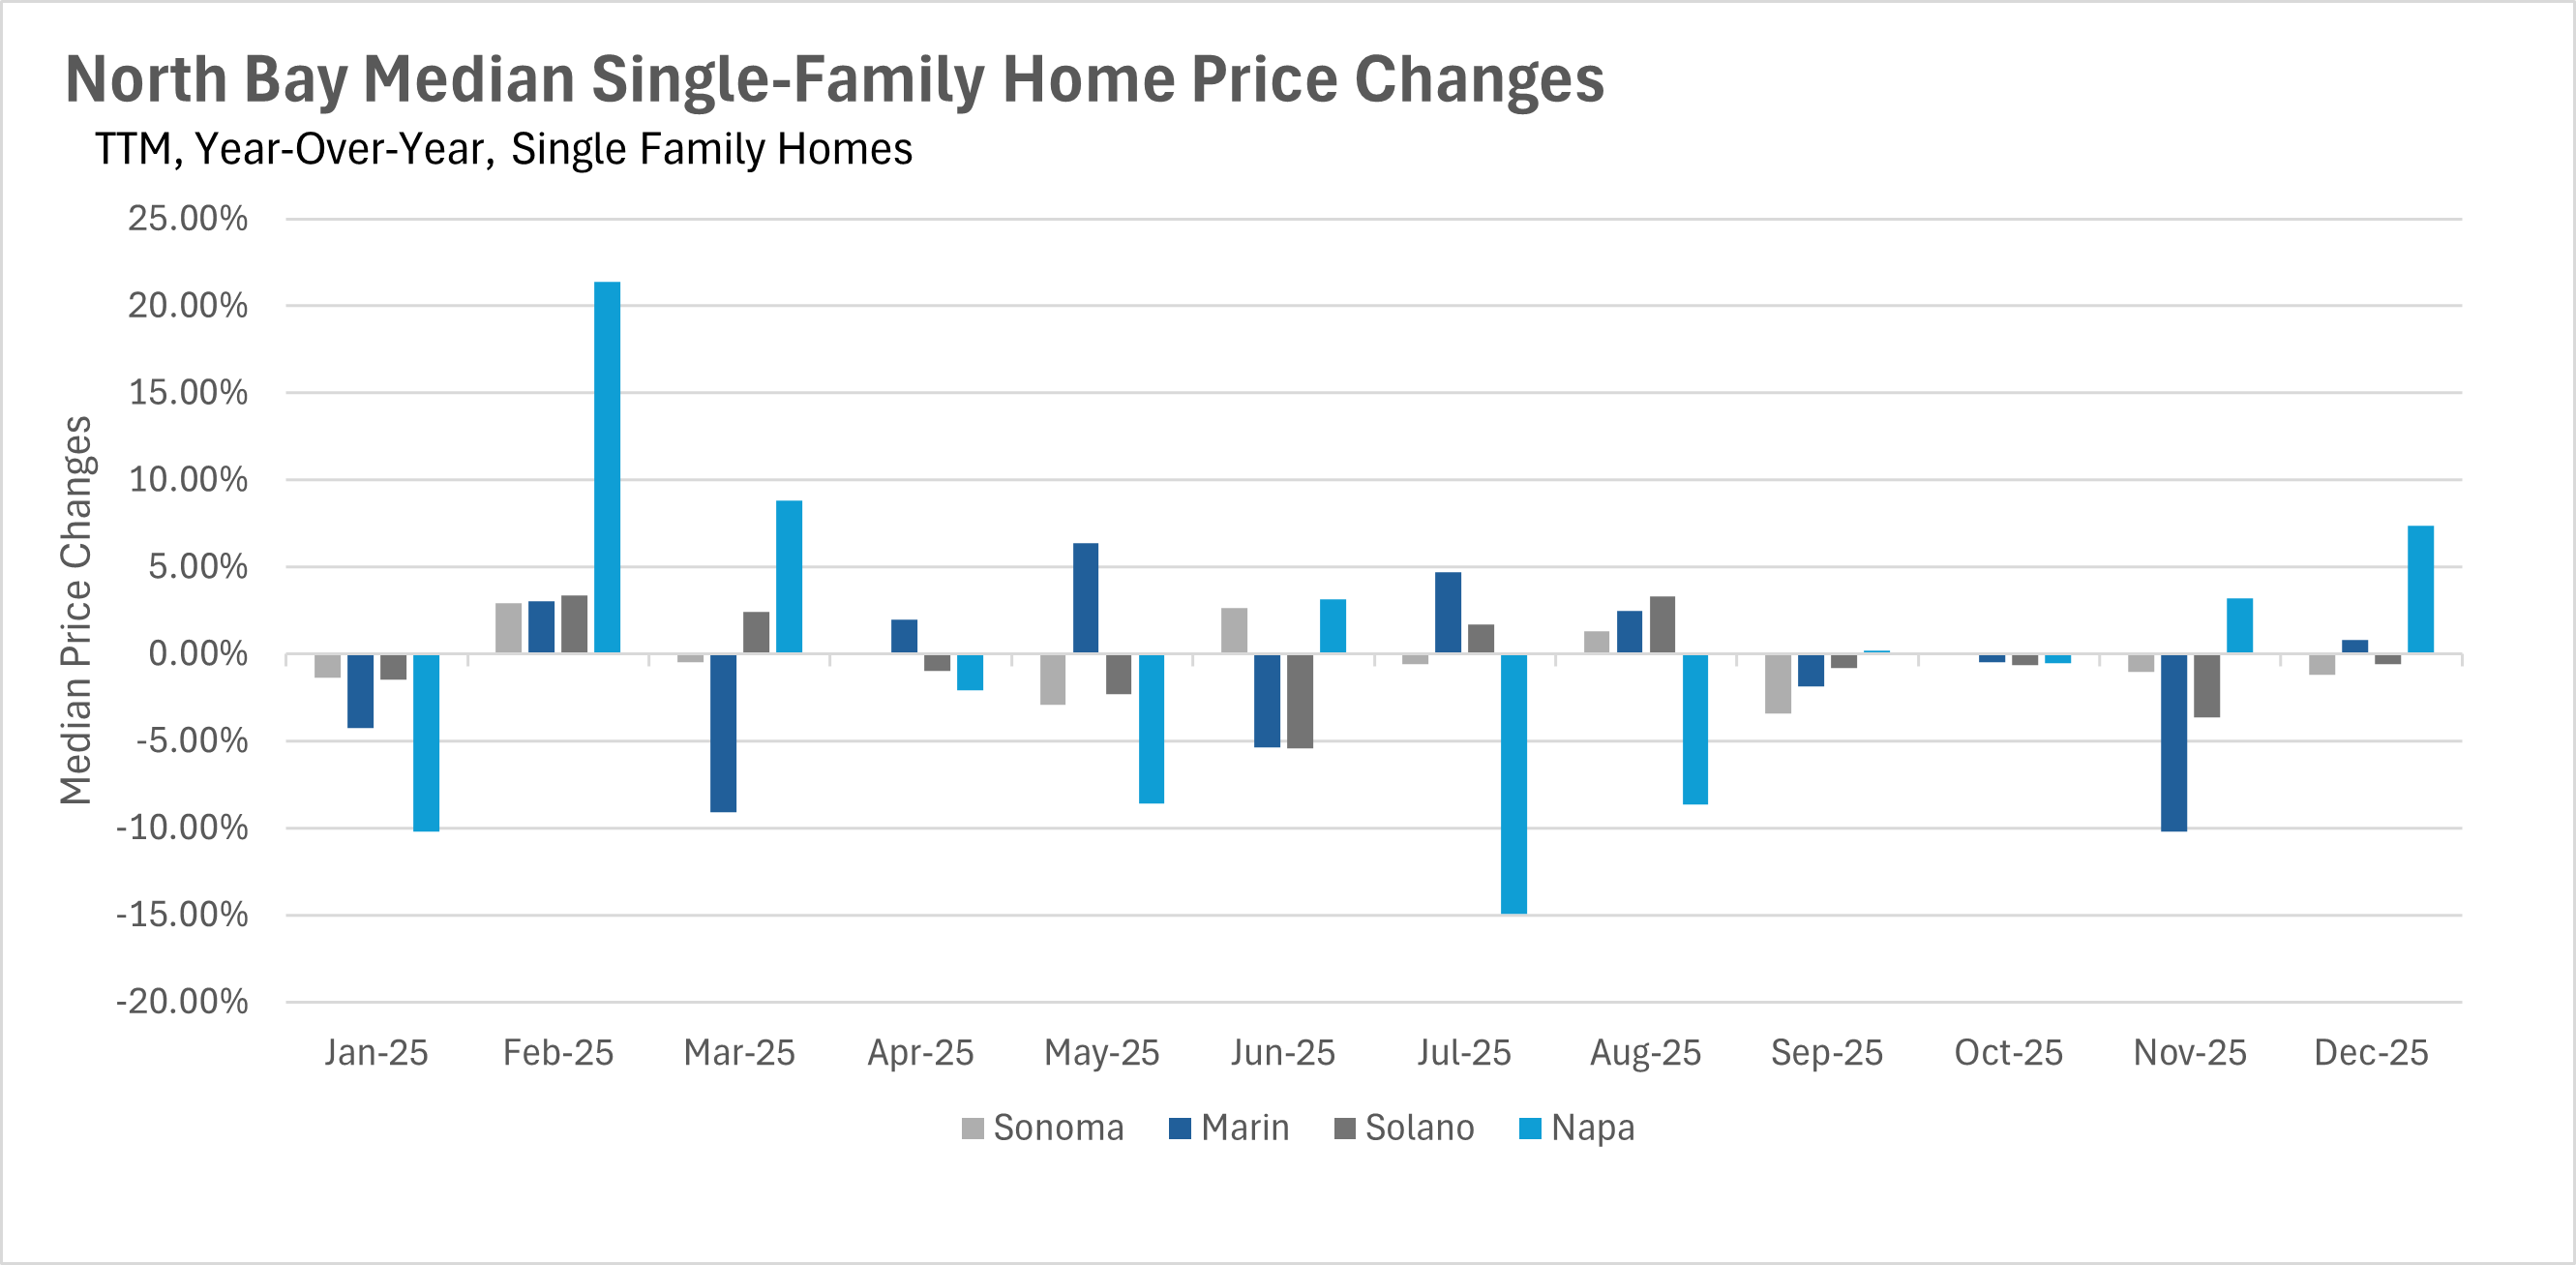
  • Median sale prices were mixed across the North Bay in December, with Napa County single-family homes seeing 7.34% year-over-year growth while Sonoma and Solano Counties experienced slight declines.
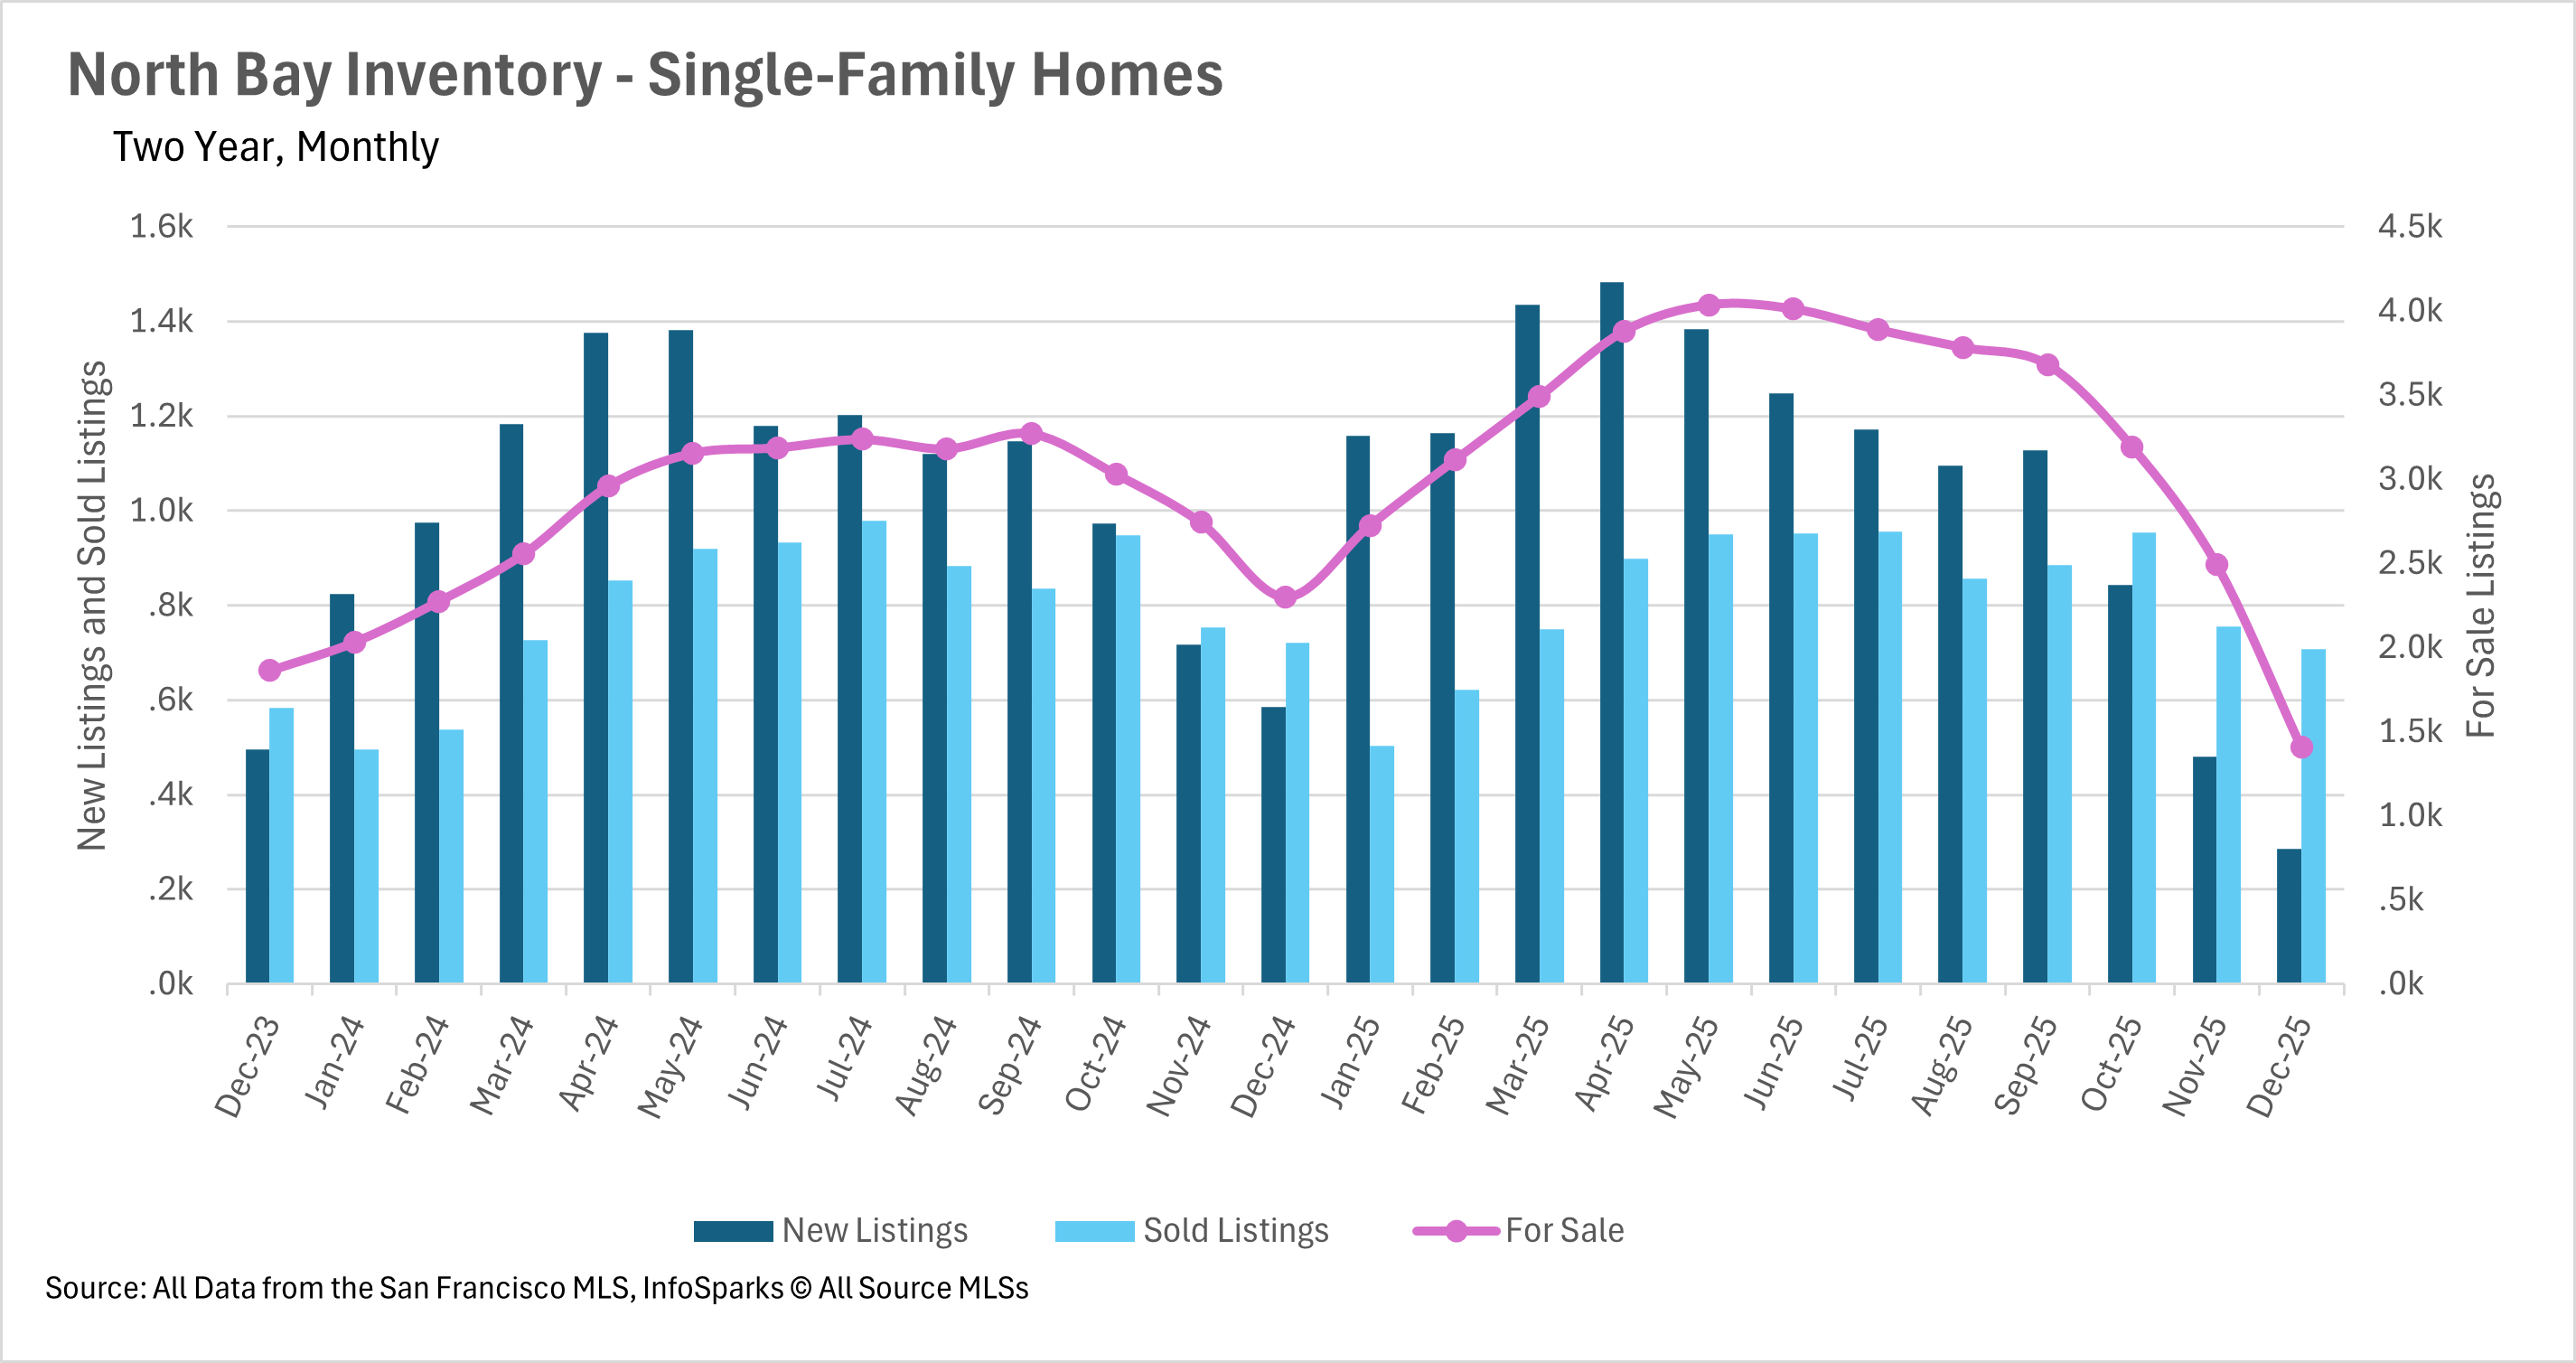
  • Inventory levels have plummeted dramatically, with single-family home inventory down 38.85% and condo inventory down 27.99% on a year-over-year basis.
  • Despite the inventory crunch, listings are spending considerably more time on the market than they did last year, with single-family homes in Solano County sitting 42.86% longer.


A tale of two markets: Napa rebounds while others soften

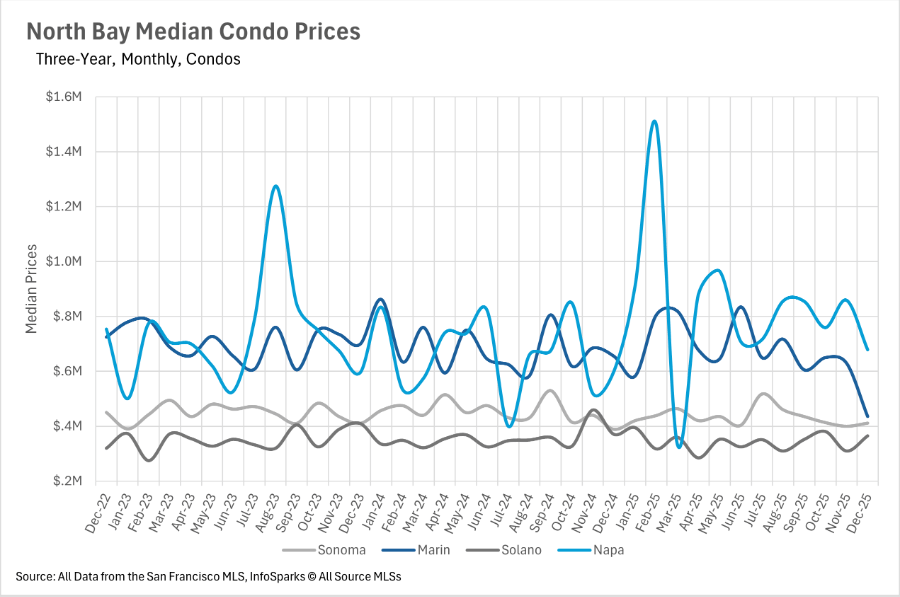
December brought a mixed bag of results across the North Bay's single-family home market. Napa County emerged as the clear winner, with the median single-family home selling for $944,624, representing a 7.34% increase compared to December 2024. Marin County also saw modest gains, with median sale prices ticking up 0.83% year-over-year to $1,512,500. However, Sonoma and Solano Counties continued to see softening, with median sale prices declining by 1.18% and 0.61% respectively. On the condo side, volatility remained the name of the game. Marin County condos saw a dramatic 33.59% year-over-year decline in median sale price, while Sonoma County condos actually increased by 5.86%. Napa County condos also saw healthy appreciation at 13.13% year-over-year.
 

The great inventory disappearing act

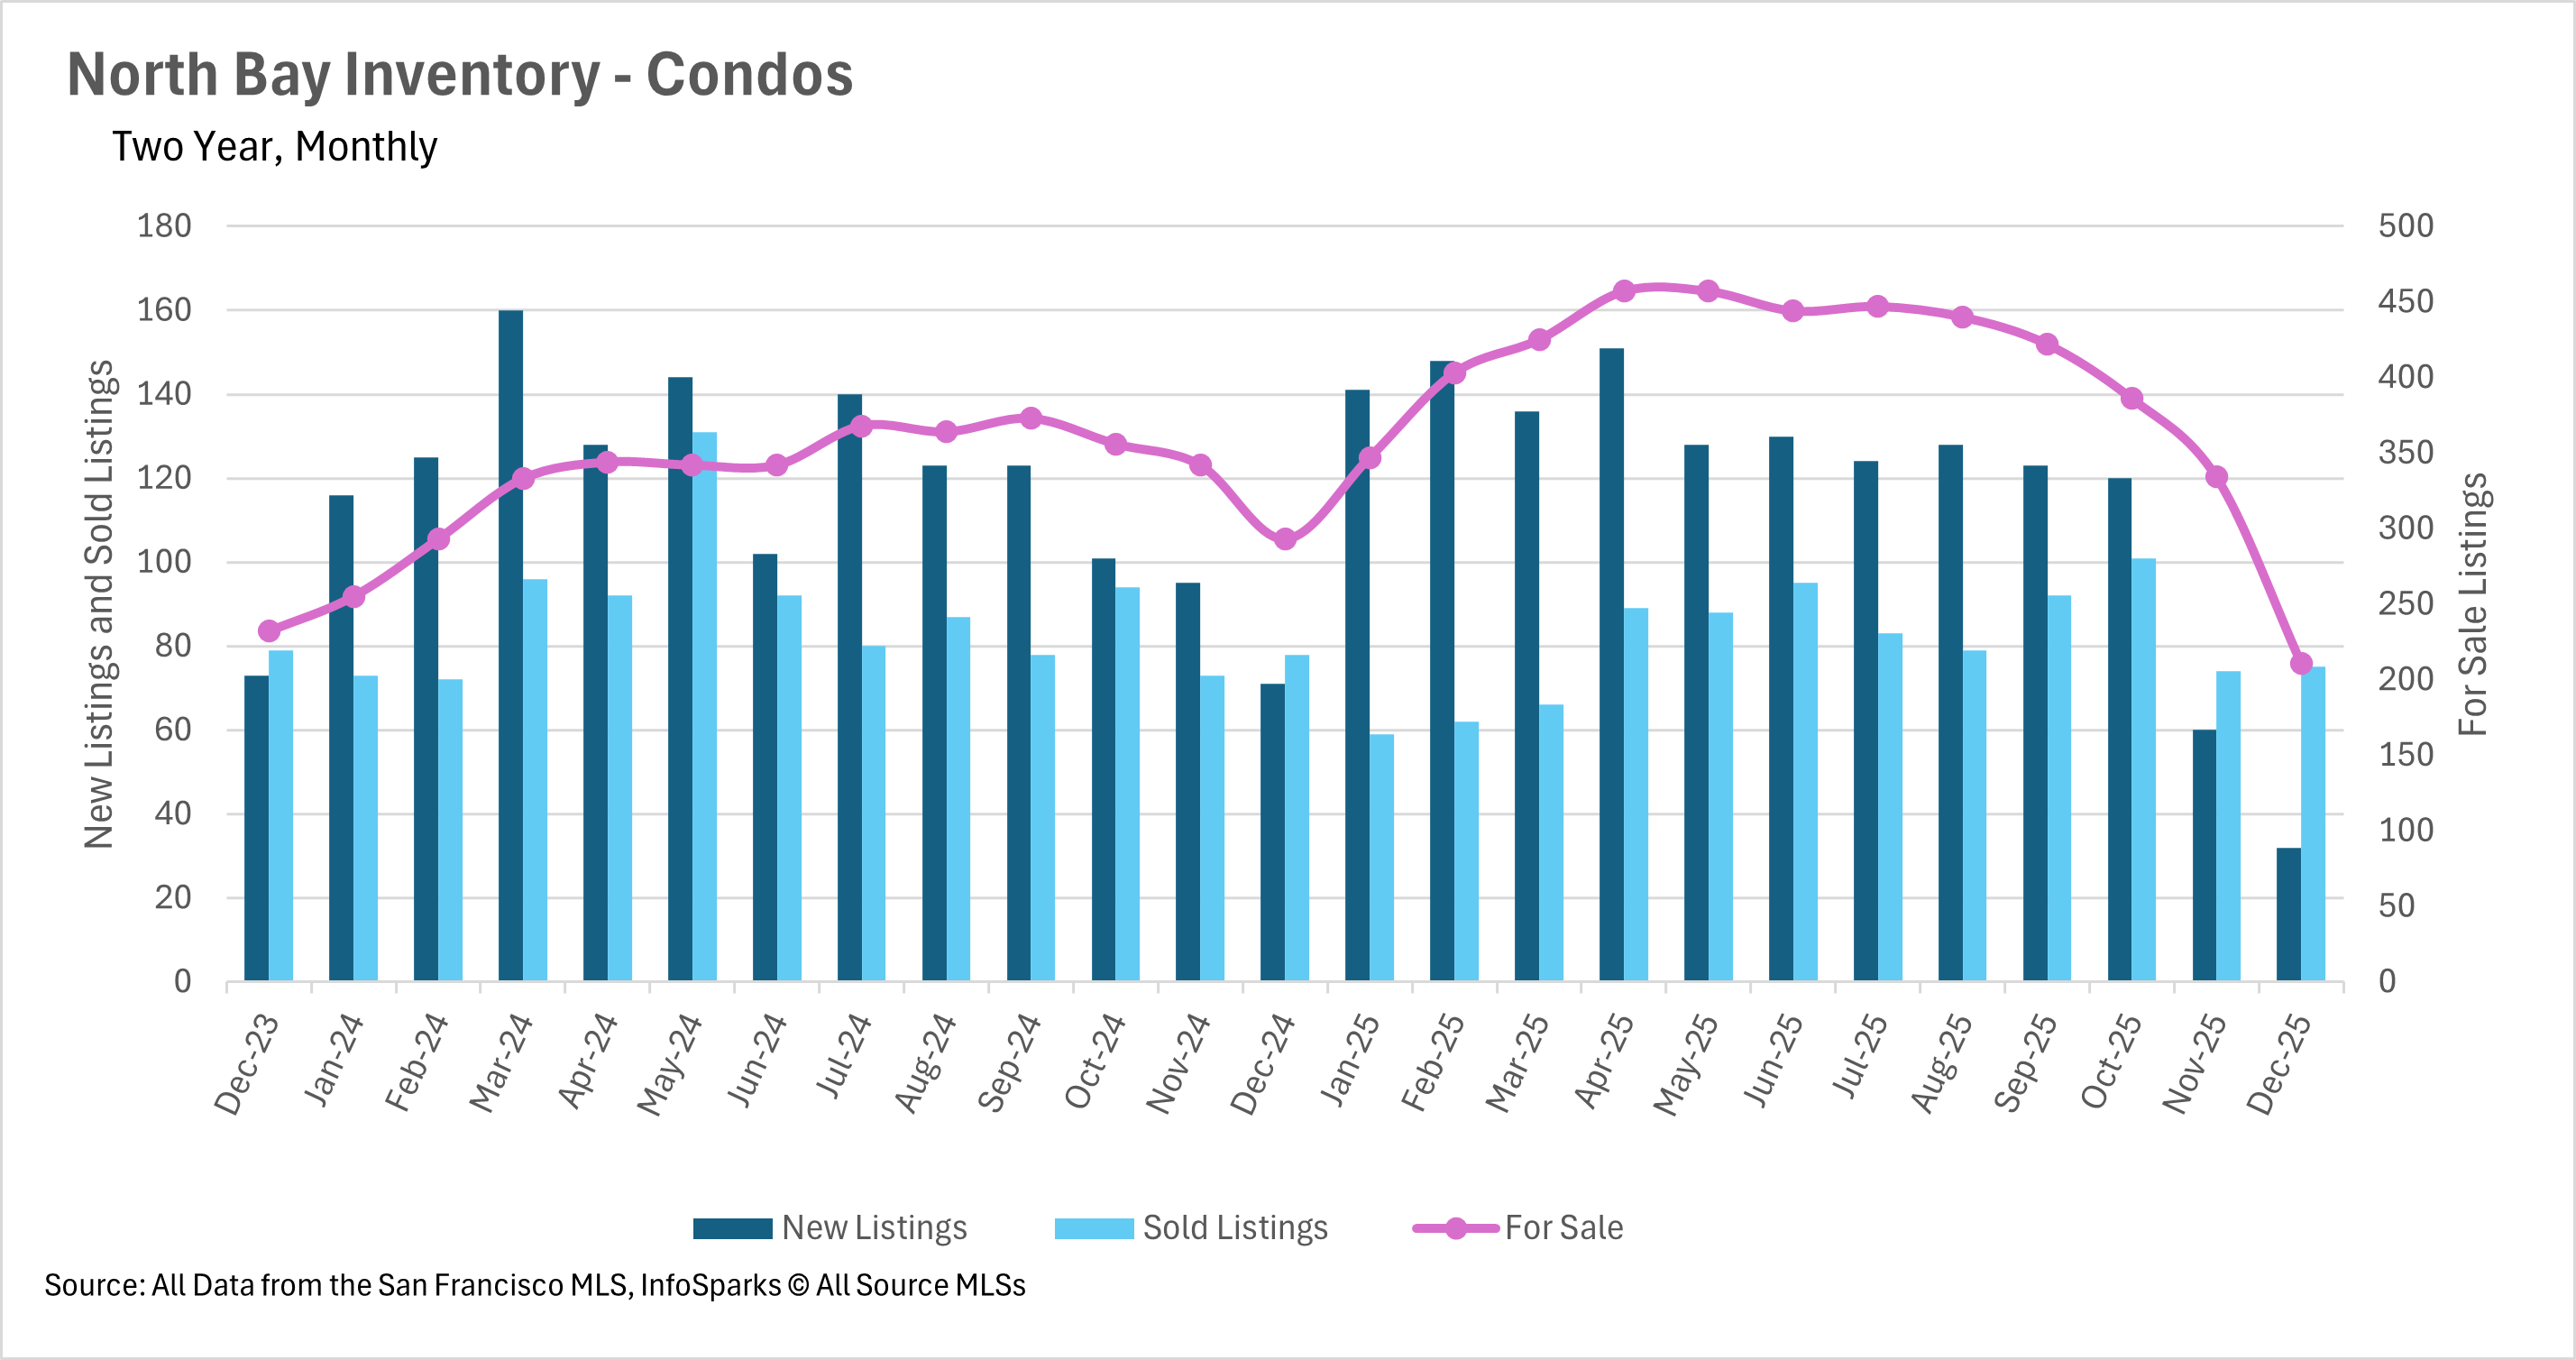
After a year of elevated inventory levels throughout much of 2025, December brought a dramatic reversal. Single-family home inventory plunged by 43.56% month-over-month and 38.85% year-over-year, leaving just 1,407 homes on the market across the North Bay. The condo market experienced a similar contraction, with inventory dropping 36.83% month-over-month and 27.99% year-over-year to just 211 units. This rapid decline in inventory is even more pronounced than typical seasonal patterns, suggesting that buyers who were waiting on the sidelines throughout the year have finally begun to act. With new listings also down dramatically, 51.19% year-over-year for single-family homes and 54.93% for condos, the supply squeeze is likely to continue into the new year.
 

Buyers are still taking their time despite dwindling options

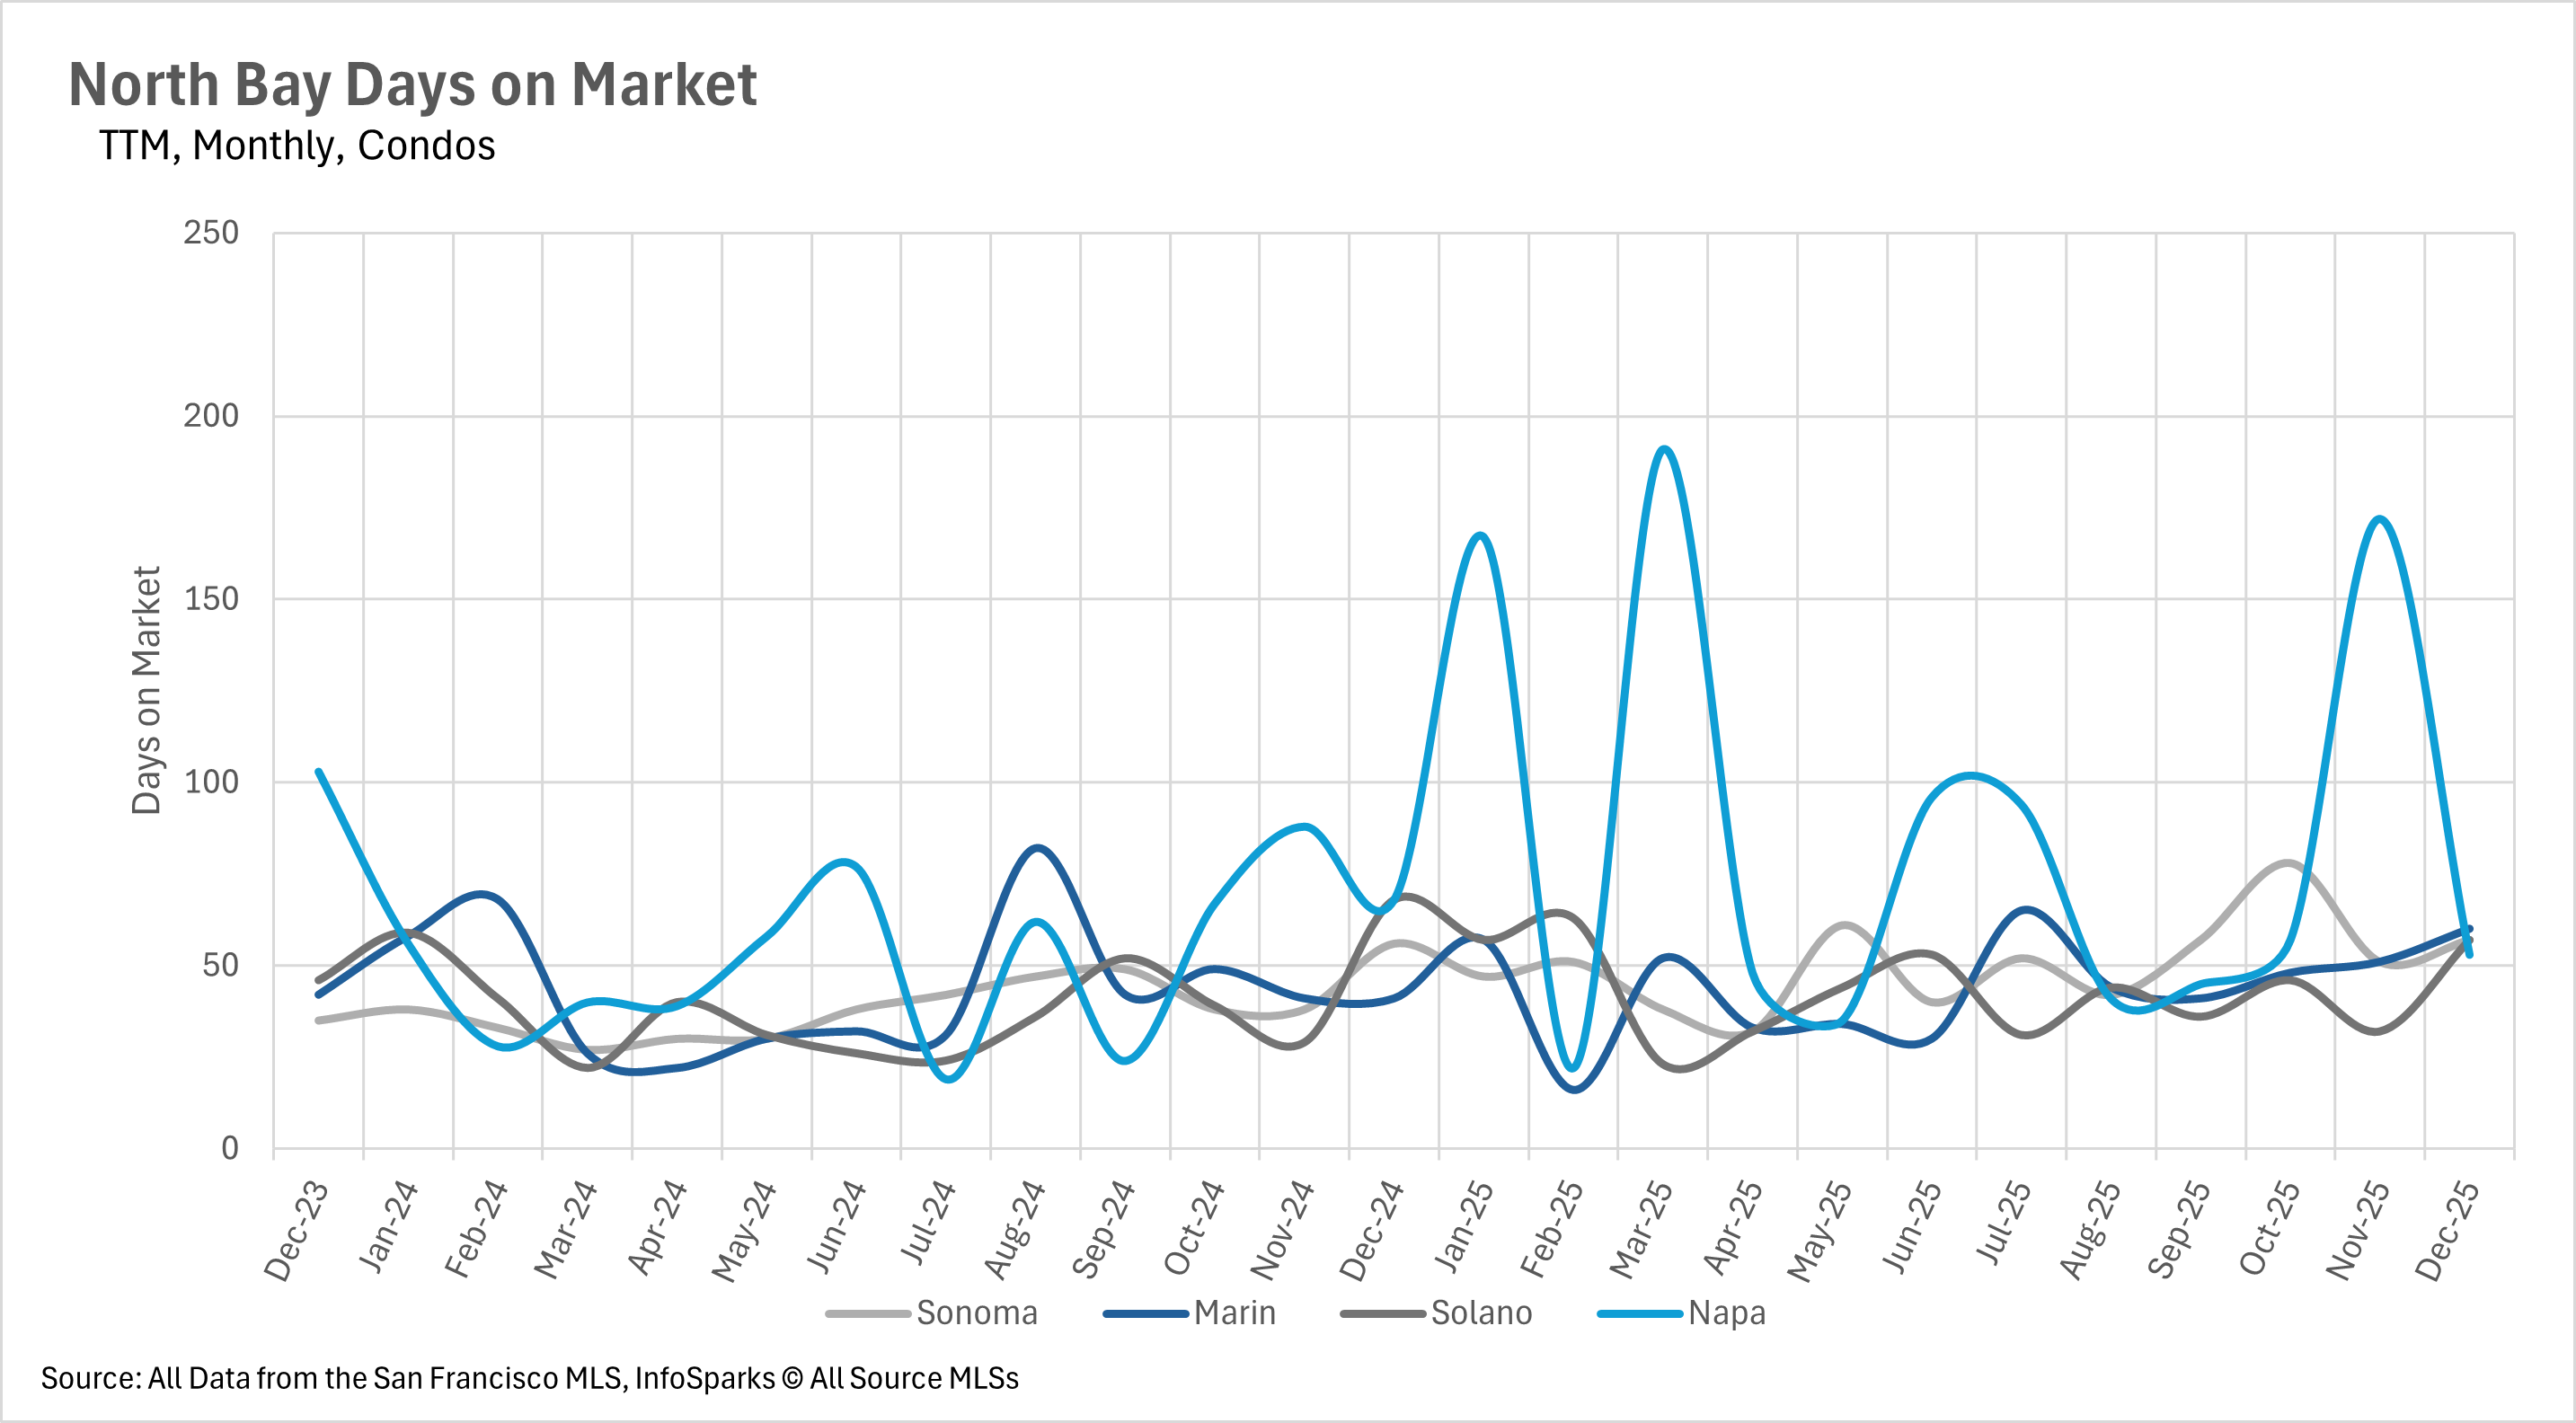
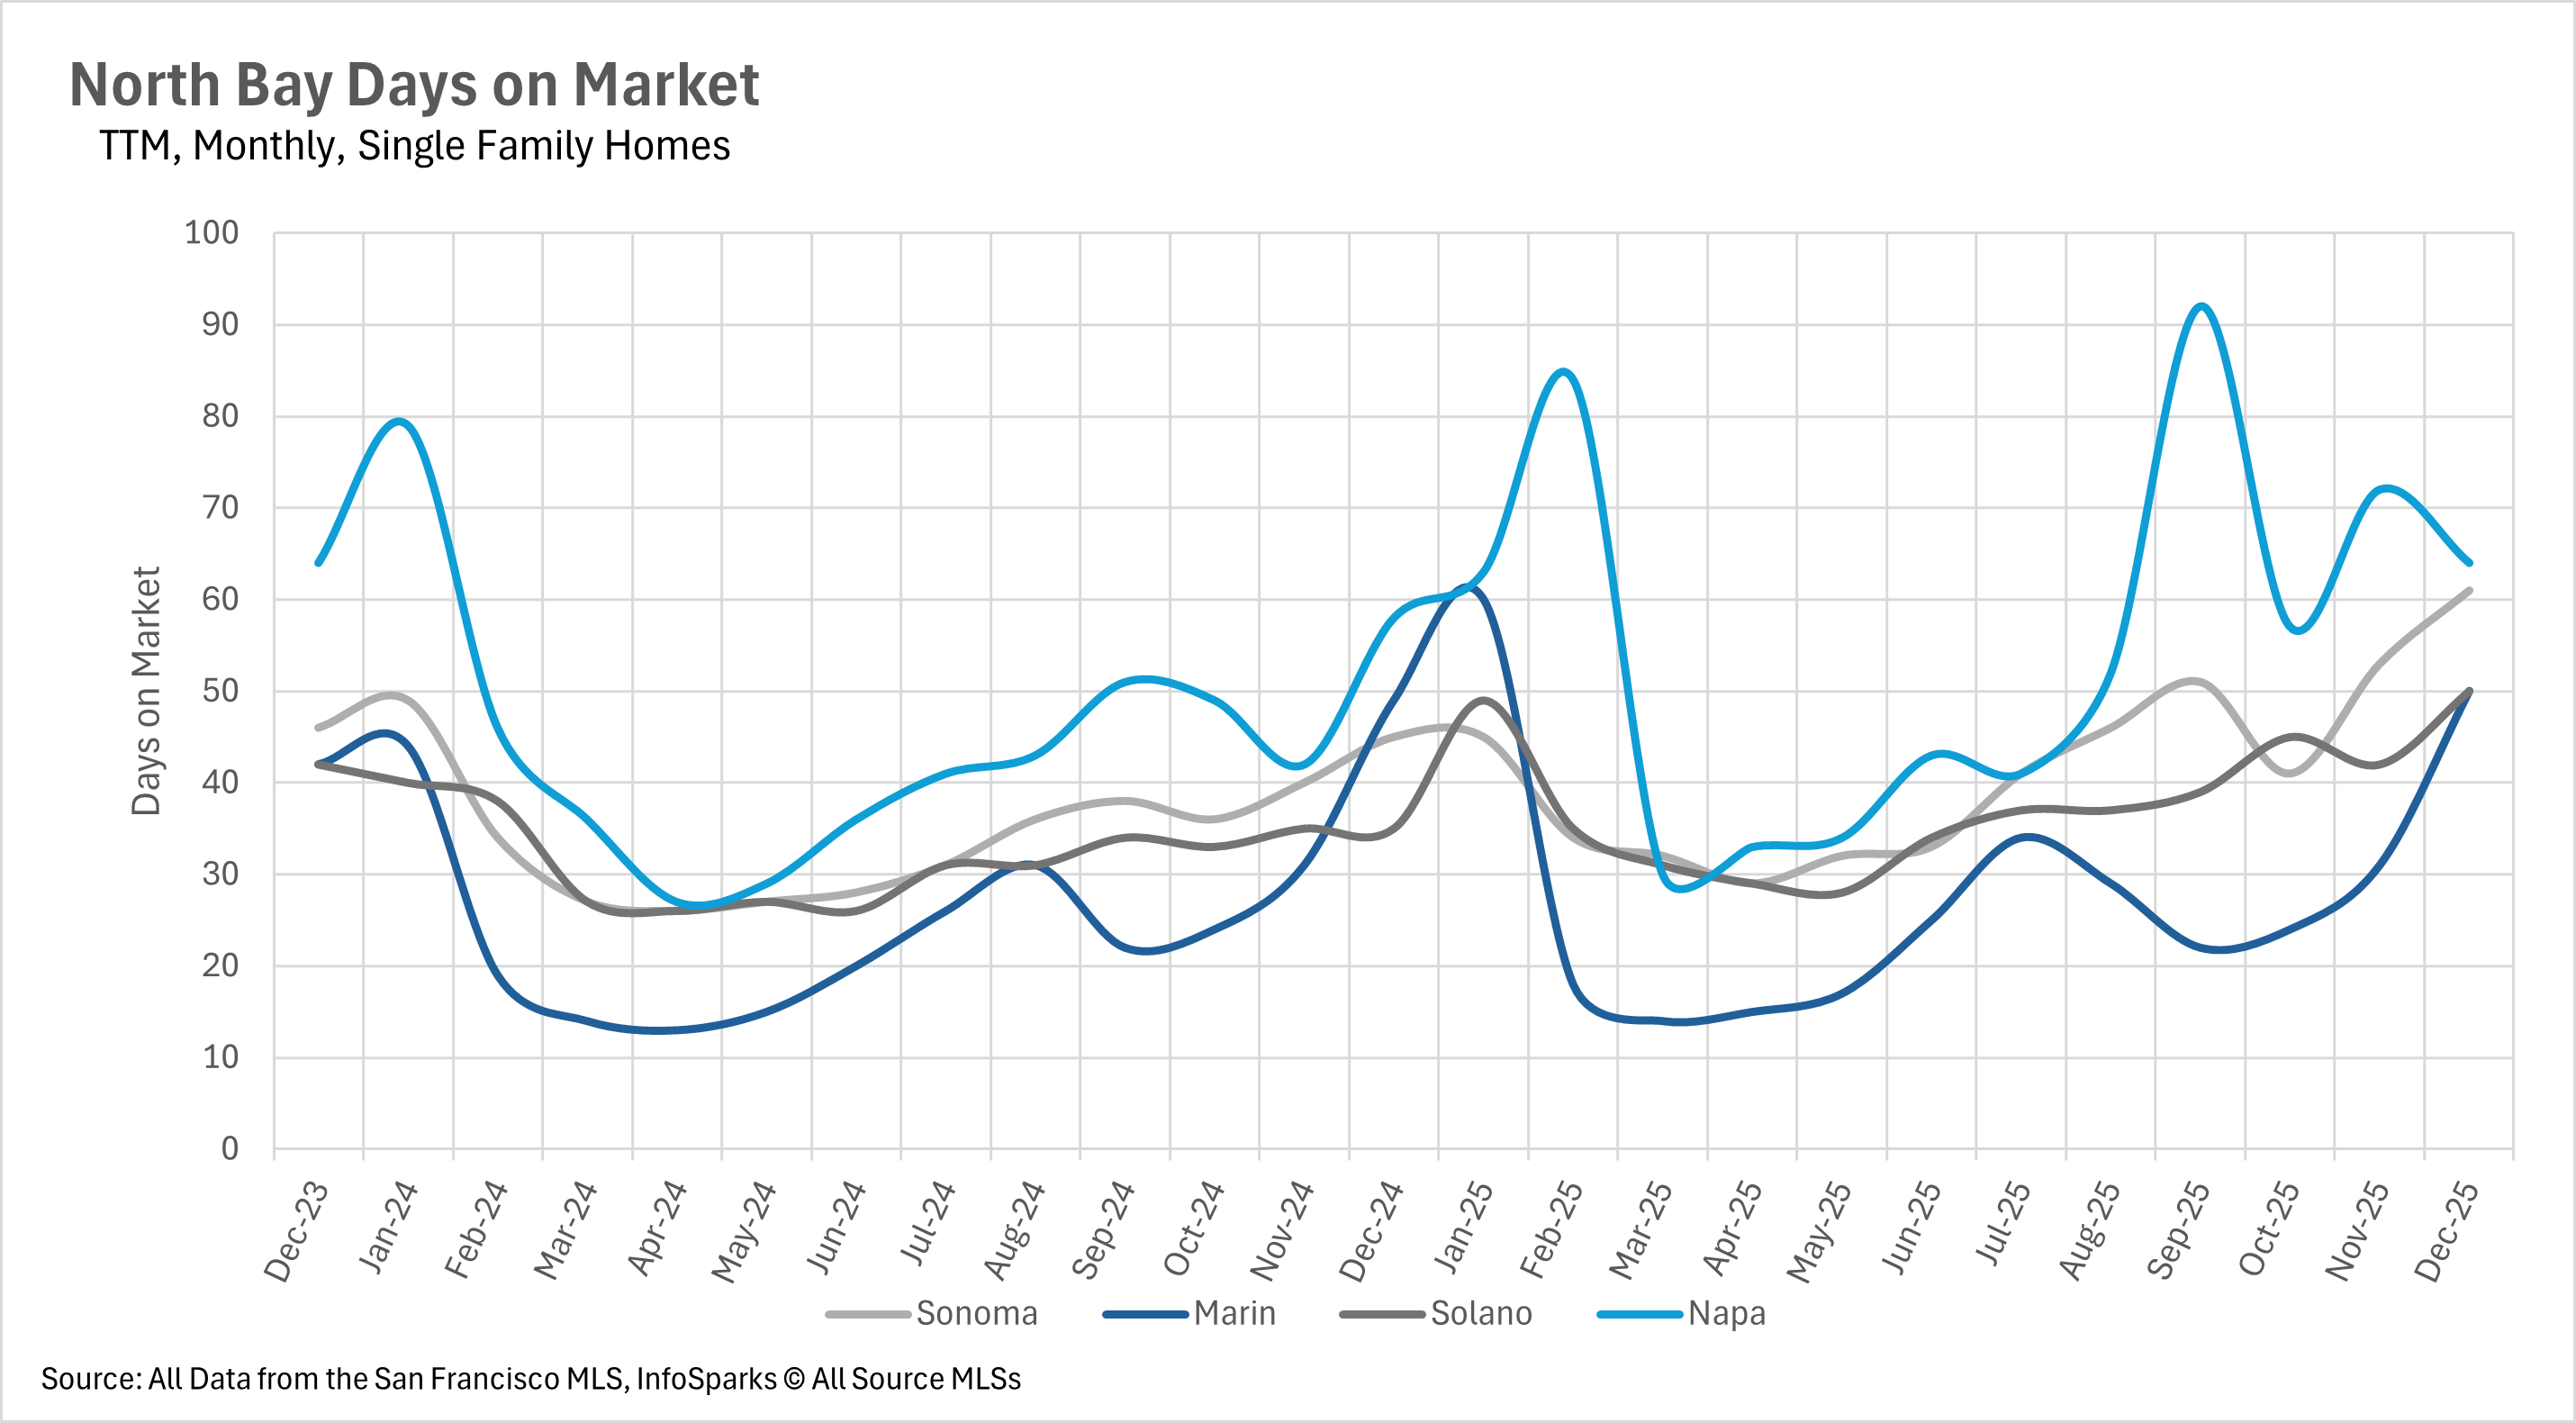
Even as inventory evaporates, listings are spending more time on the market than they did a year ago. Single-family homes in Sonoma County sat on the market for 61 days, a 35.56% increase compared to December 2024. Solano County saw the most dramatic jump, with the median single-family home spending 50 days on the market, a 42.86% year-over-year increase. Interestingly, Marin County bucked this trend somewhat, with days on market increasing only 2.04% year-over-year. On the condo side, the picture was mixed: Marin County condos are now spending 46.34% more time on the market, while Napa County condos actually moved faster, with a 22.06% year-over-year decrease in days on market.
 

The holiday season brings a sharp shift toward seller's markets

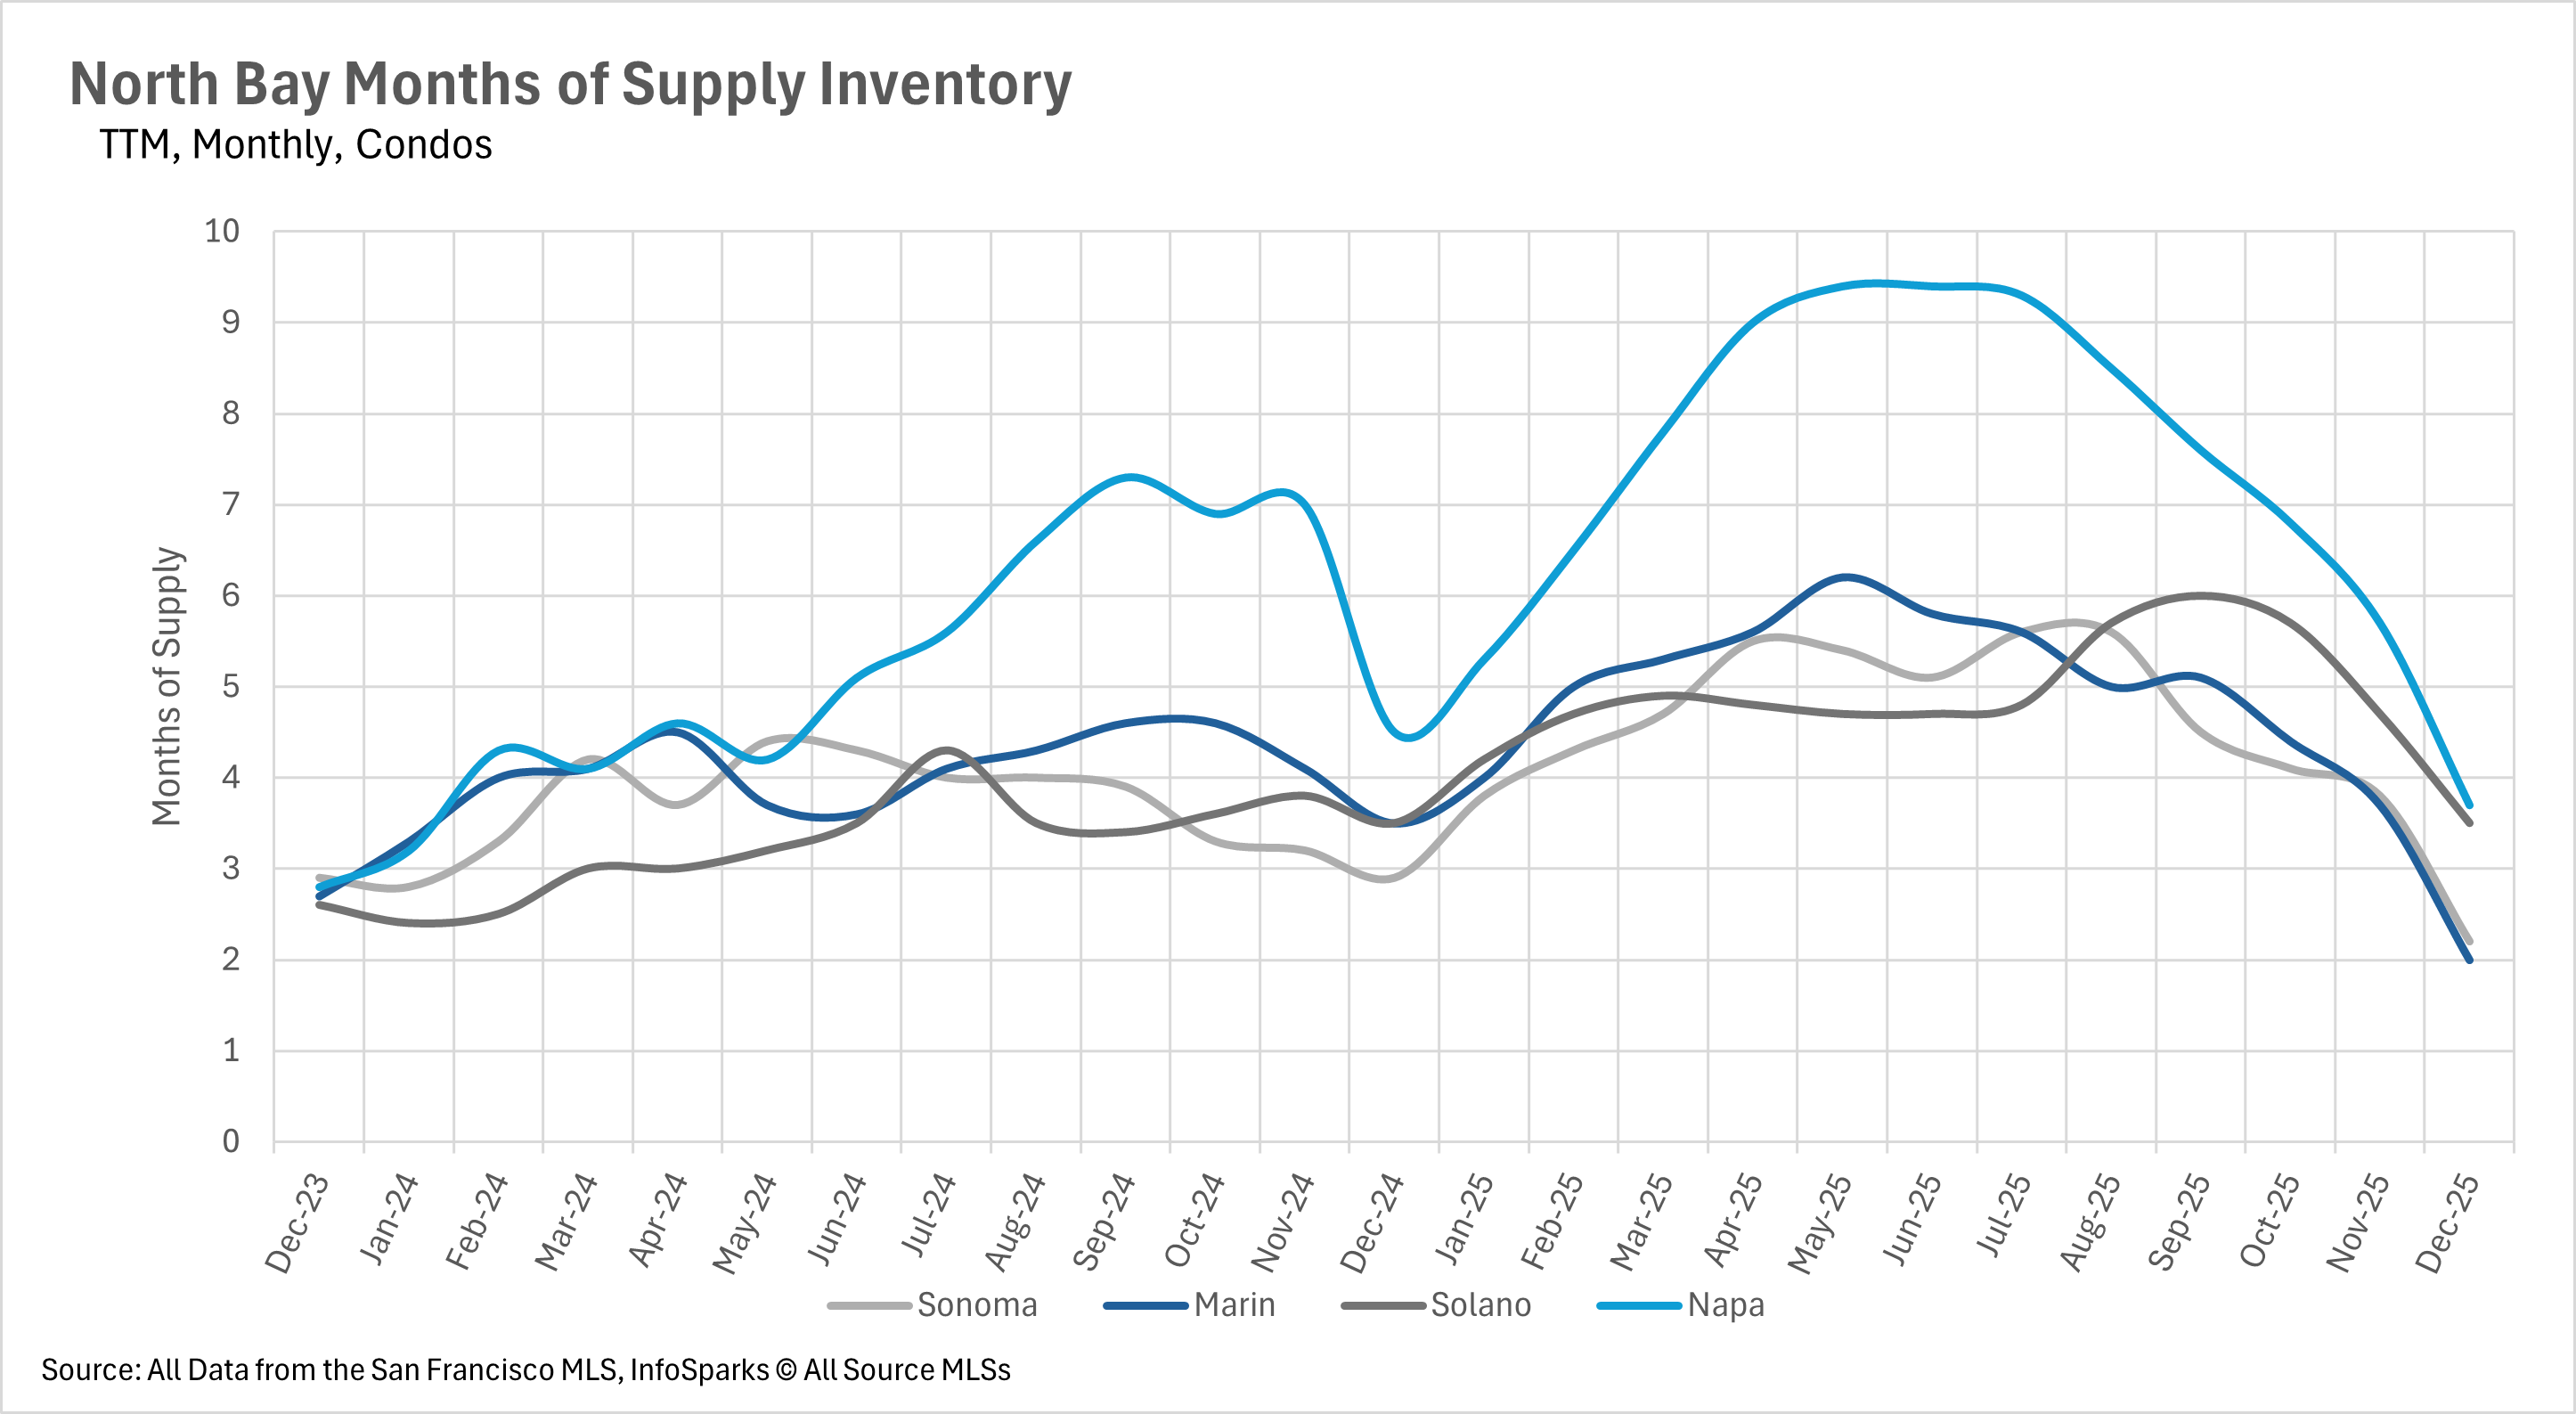
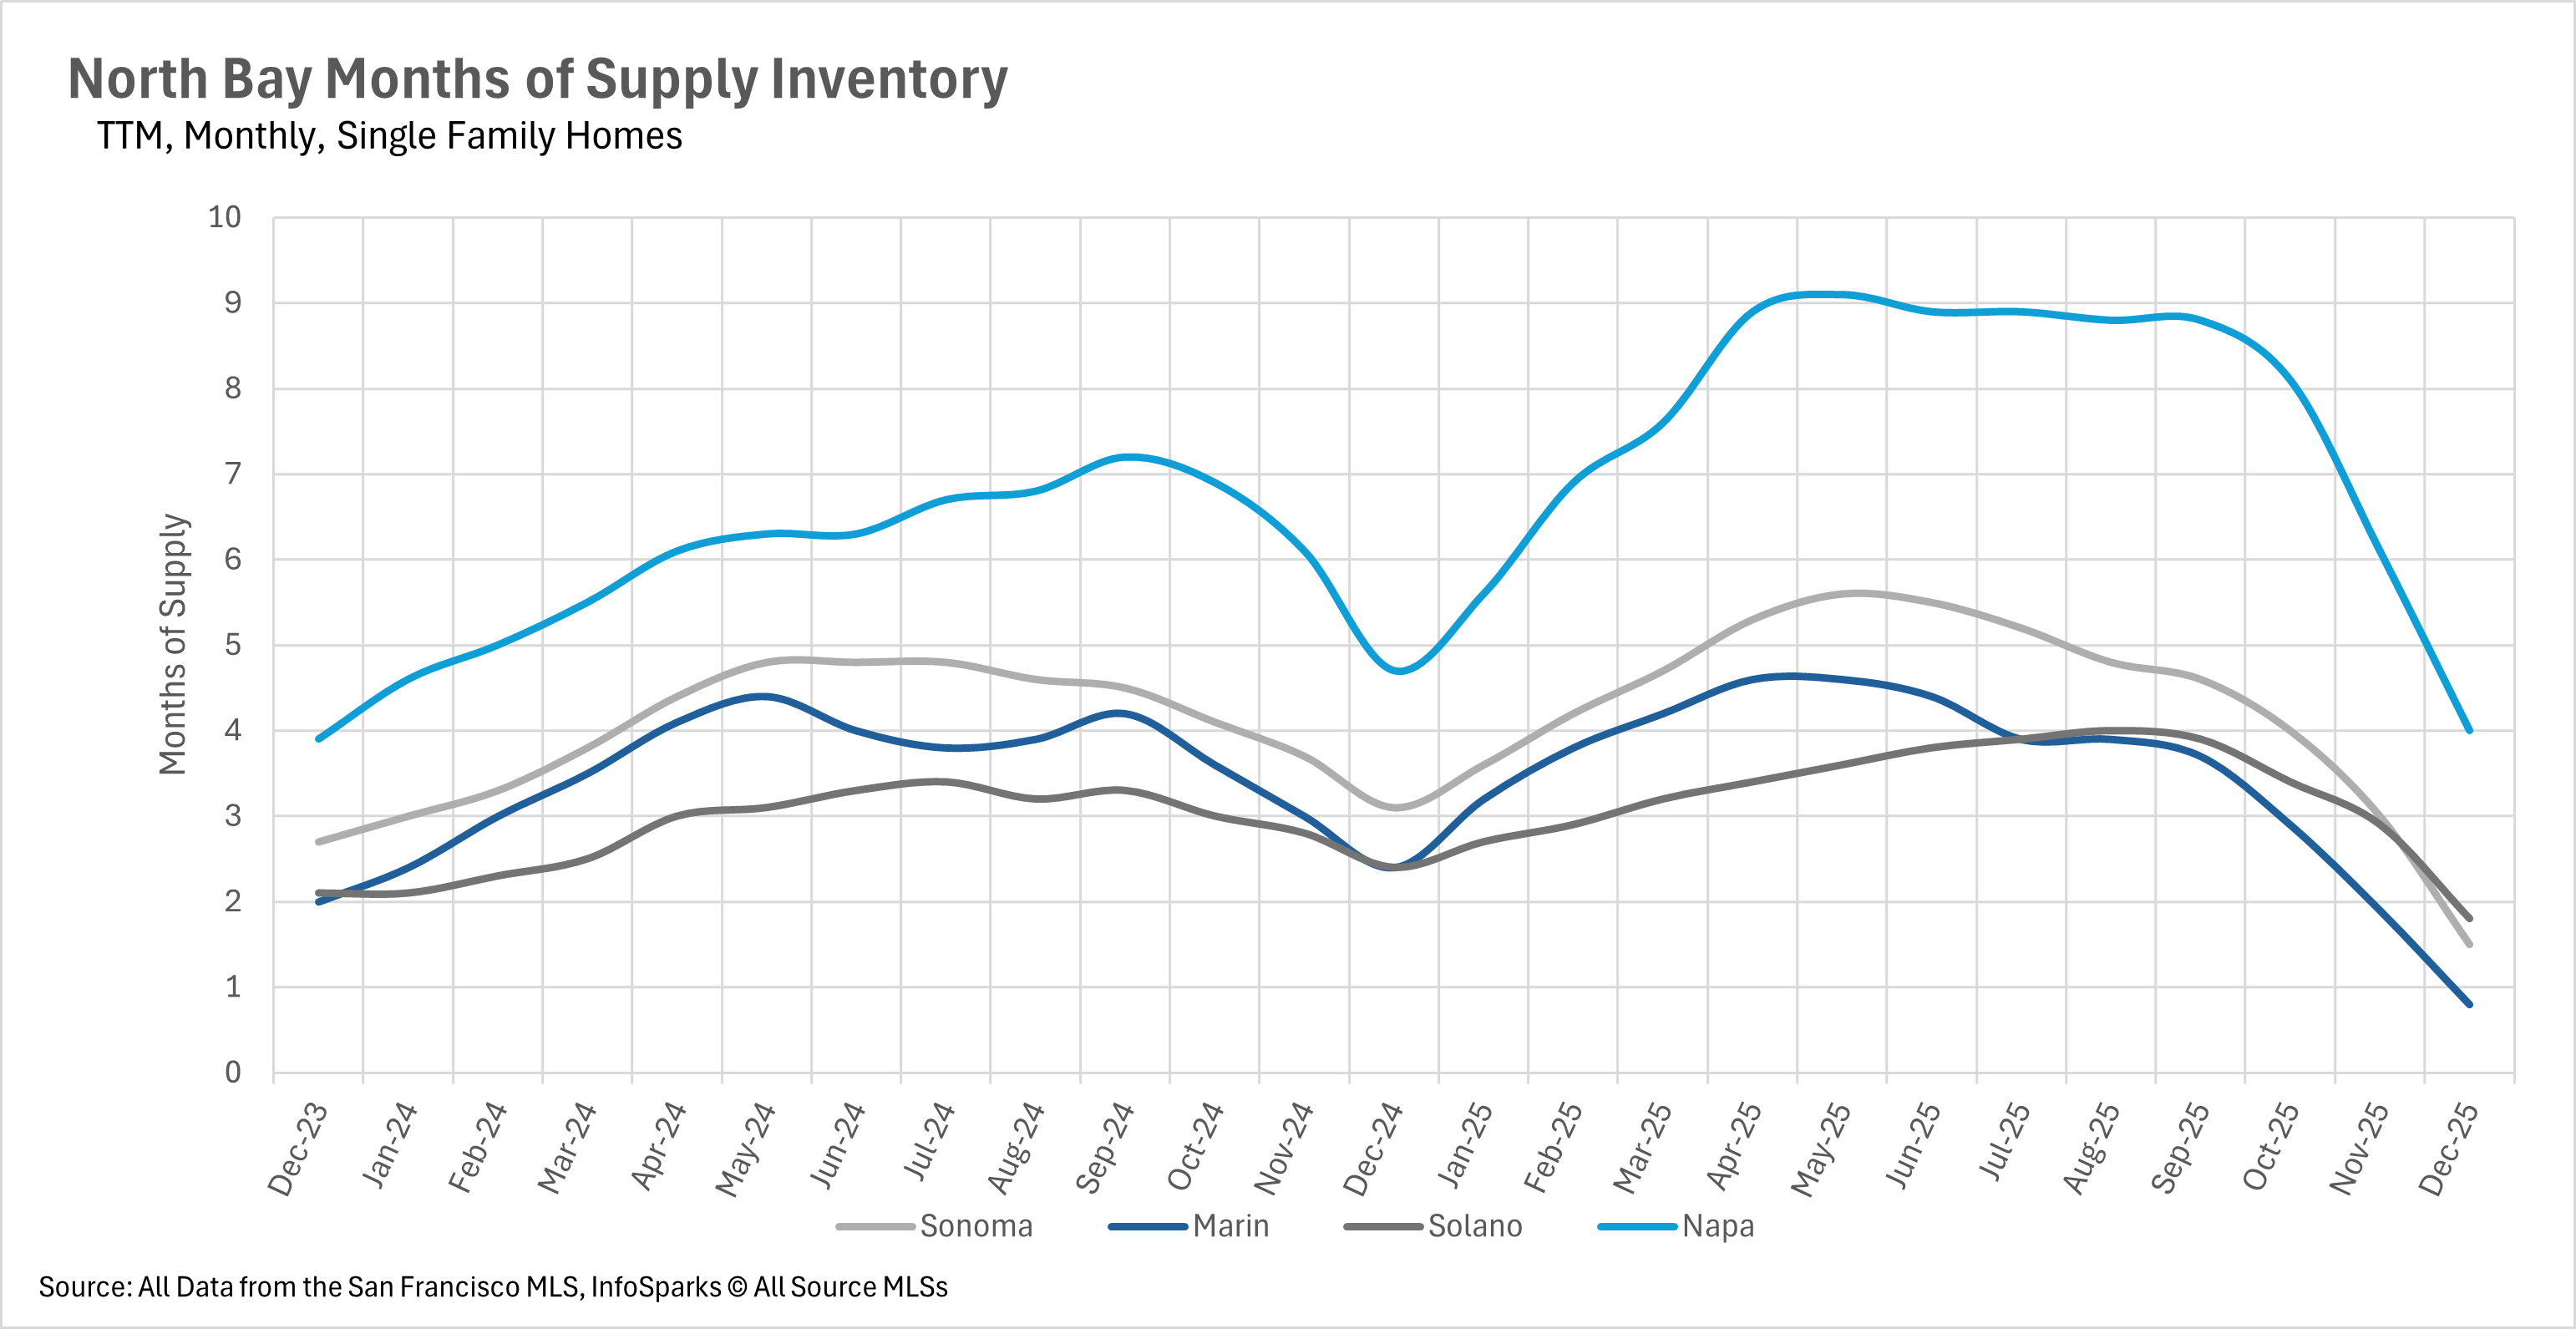
When determining whether a market is a buyers’ market or a sellers’ market, we look to the Months of Supply Inventory (MSI) metric. The state of California has historically averaged around three months of MSI, so any area with at or around three months of MSI is considered a balanced market. Any market that has lower than three months of MSI is considered a sellers’ market, whereas markets with more than three months of MSI are considered buyers’ markets.
 
December saw a dramatic shift toward seller's market conditions across the board. The single-family home market is now firmly in seller's territory, with Marin County leading the way at just 0.8 months of supply, down a staggering 66.67% year-over-year. Sonoma County has 1.5 months, Solano County has 1.8 months, and even Napa County, which had been a strong buyer's market throughout 2025, has dropped to 4 months of supply. The condo market has also tightened considerably, with Sonoma County at 2.2 months, Marin County at 2 months, Solano County at 3.5 months, and Napa County at 3.7 months of supply. If you've been waiting to list your home, the new year may present an excellent opportunity as buyers compete for an increasingly limited pool of properties.
 

Local Lowdown Data

Recent Blog Posts

Stay up to date on the latest real estate trends.

Selling Your Home in San Francisco? Here's How to Attract Serious Buyers From Day One

Michelle Kim  |  July 17, 2026

Discover the strategies that help San Francisco homes stand out, attract serious buyers, and maximize value before they even hit the market.

The Biggest Mistakes Home Sellers Make Before Listing Their Property

Michelle Kim  |  July 10, 2026

Avoid the most common mistakes homeowners make before listing their property and learn how preparation, pricing, and marketing can help you achieve a successful home s… Read more

Why Some Homes Receive Multiple Offers While Others Sit on the Market

Michelle Kim  |  July 6, 2026

Learn the key factors that help San Francisco homes attract multiple offers, from strategic pricing and professional marketing to home presentation and buyer demand.

The Local Lowdown: June 2026

Michelle Kim  |  July 1, 2026

Quick Take: Prices are rising across much of the Bay Area, with San Francisco single-family homes breaching the $2.2 million mark for the first time and the East Bay p… Read more

The Local Lowdown: June 2026

Michelle Kim  |  July 1, 2026

Quick Take: Median sale prices posted gains in three of four counties, with Sonoma County leading the way at 2.33% year-over-year growth, while Marin County saw a 4.70… Read more

The Local Lowdown: June 2026

Michelle Kim  |  July 1, 2026

Quick Take: Prices are on the rise across the board, with single-family homes and condos both posting year-over-year gains for the first time in over a year. Inventory… Read more

We Would Love to Meet You!

You’ve got questions and we can’t wait to answer them.