The Local Lowdown: January 2024

Michelle Kim  |  February 1, 2024

The Local Lowdown: January 2024

The Local Lowdown

Quick Take:
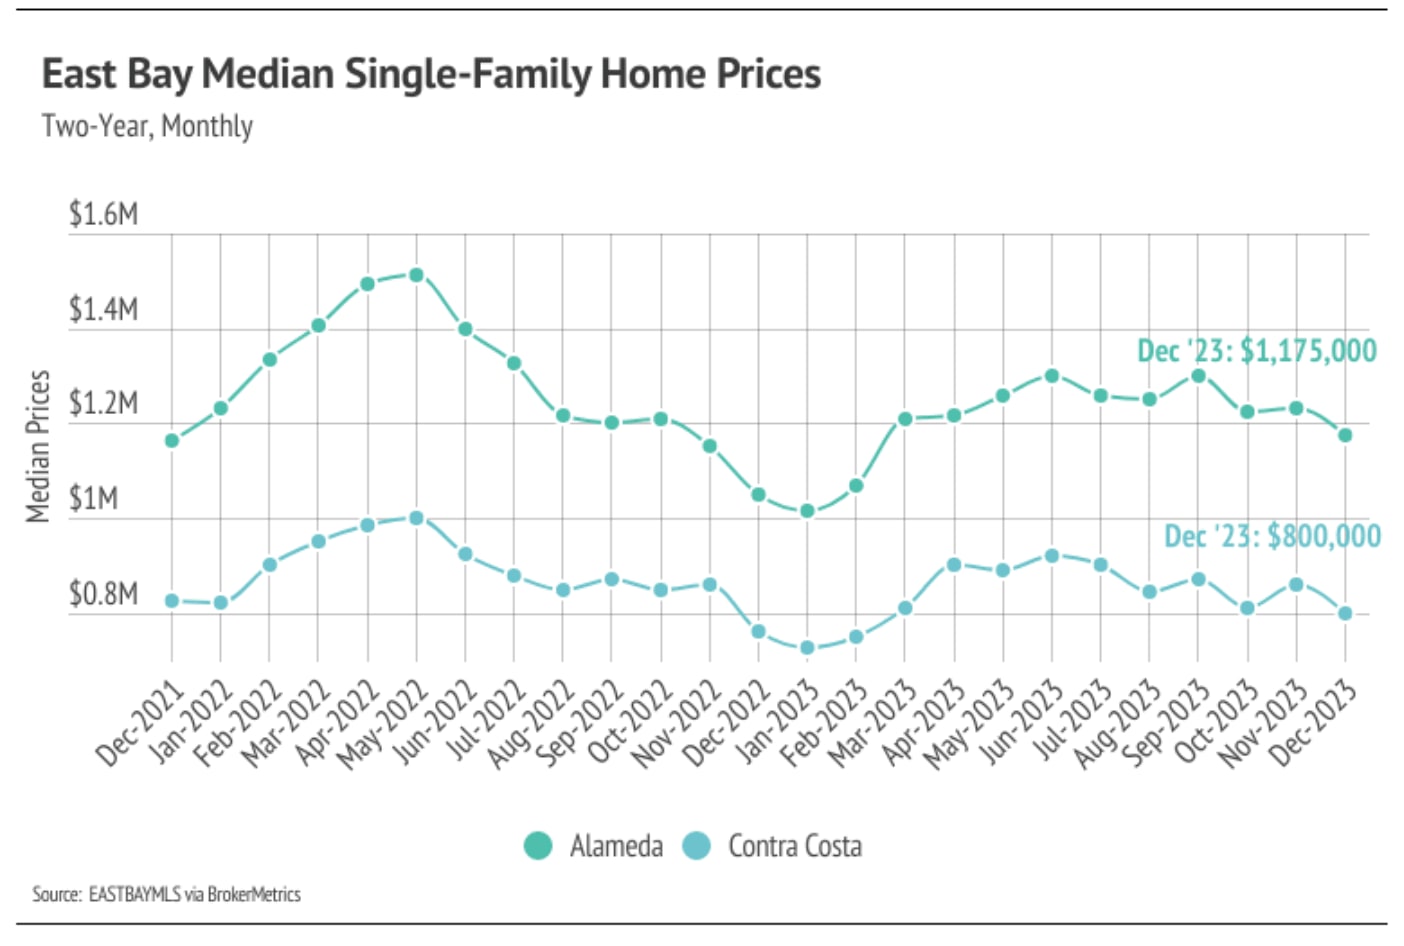
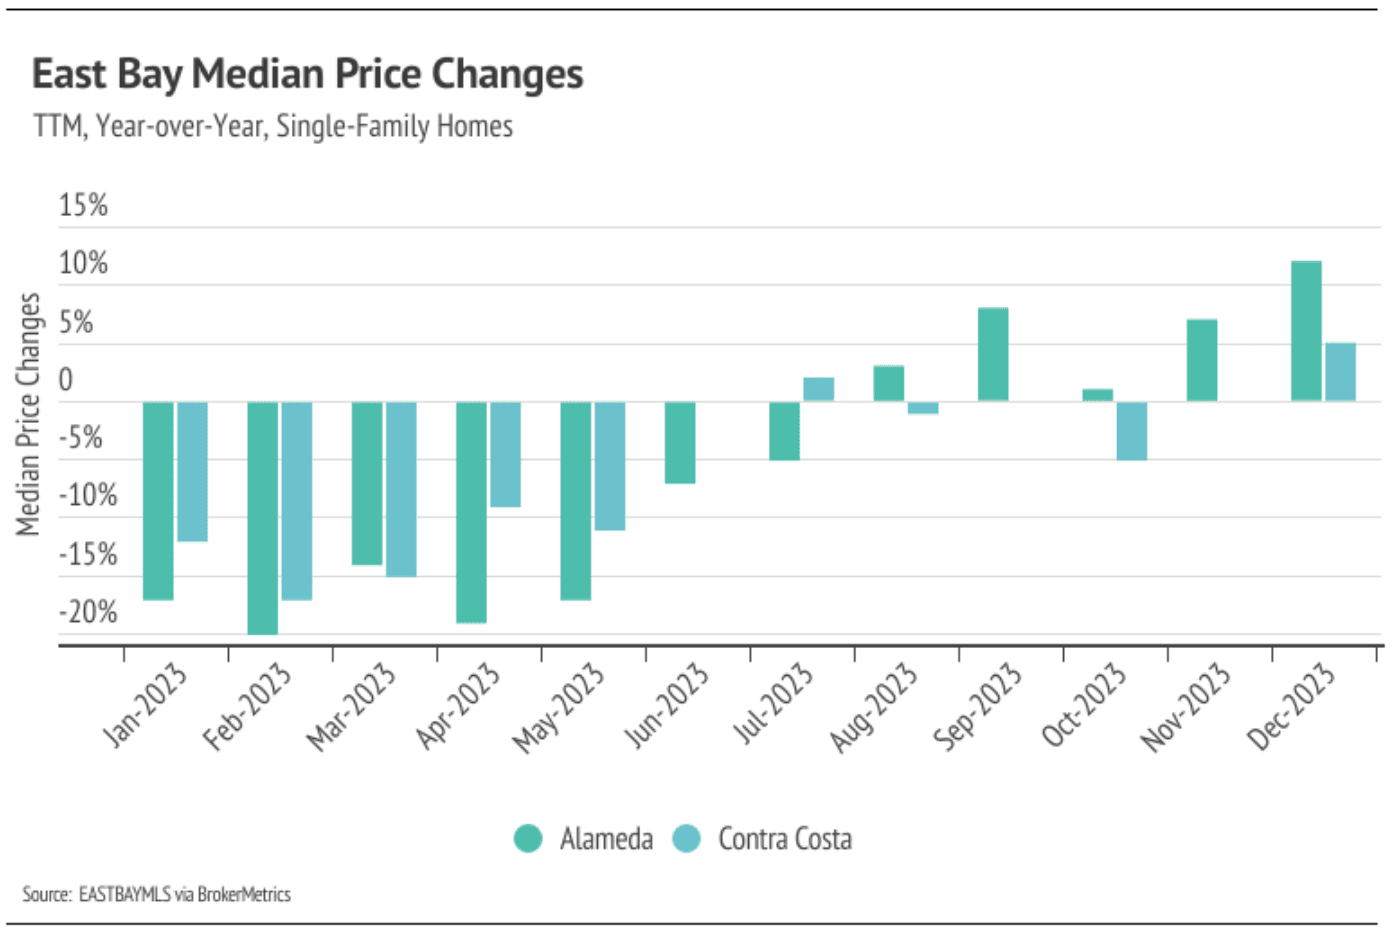
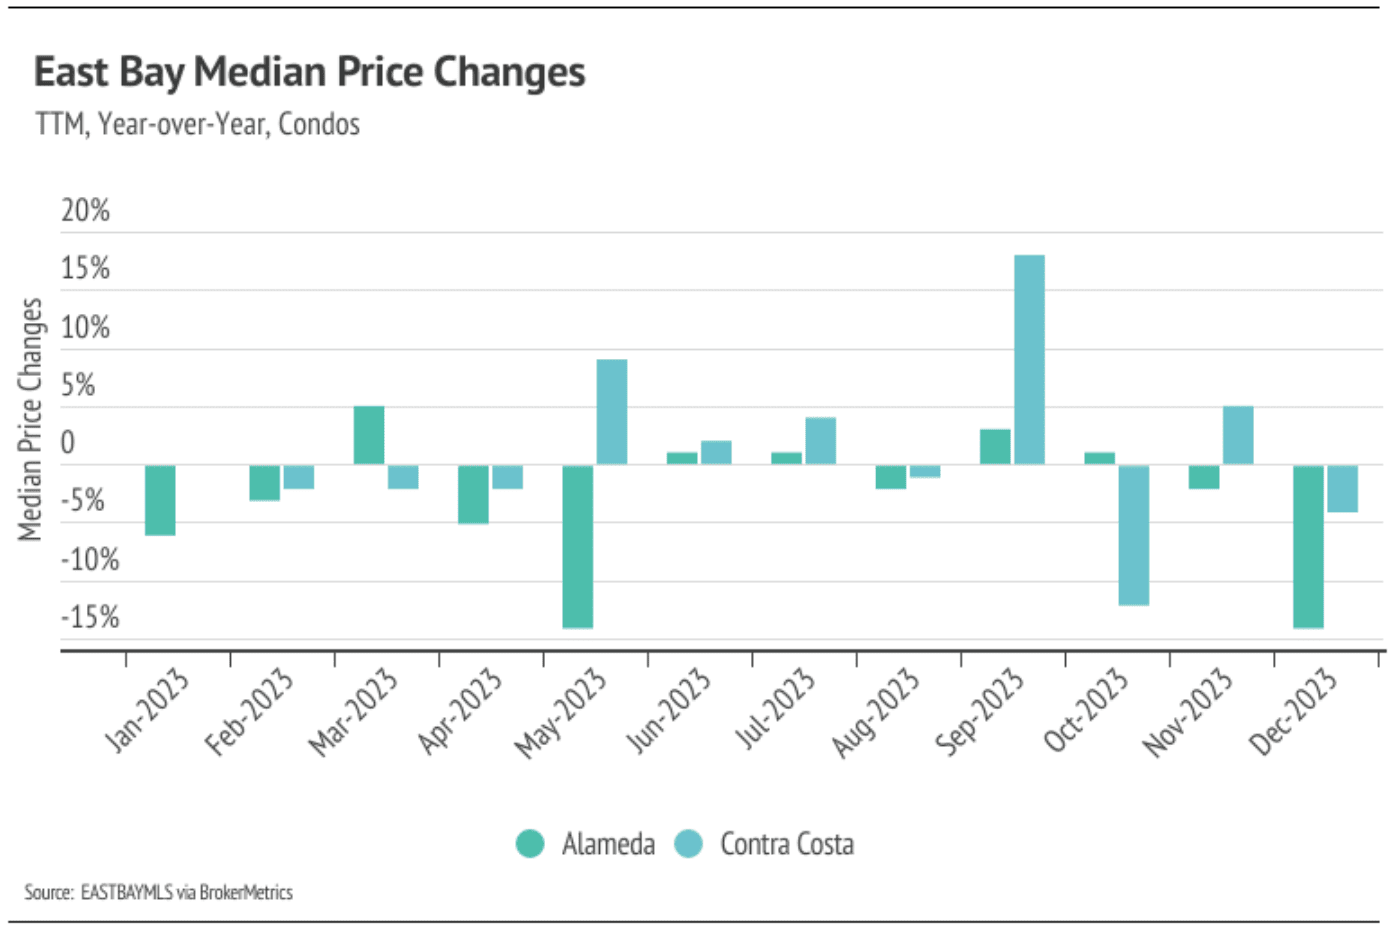
  • Median single-family home prices declined from November to December, which is normal this time of year. However, single-family home prices appreciated year over year, up 11.9% in Alameda and 5.3% in Contra Costa. Condo prices fell in the East Bay year over year.
  • Active listings in the East Bay fell 27% month over month, which is typical this time of year when new listings tend to decline significantly. As mortgage rates drop, we will likely see more new listings in the first quarter, which should help alleviate some excess demand.
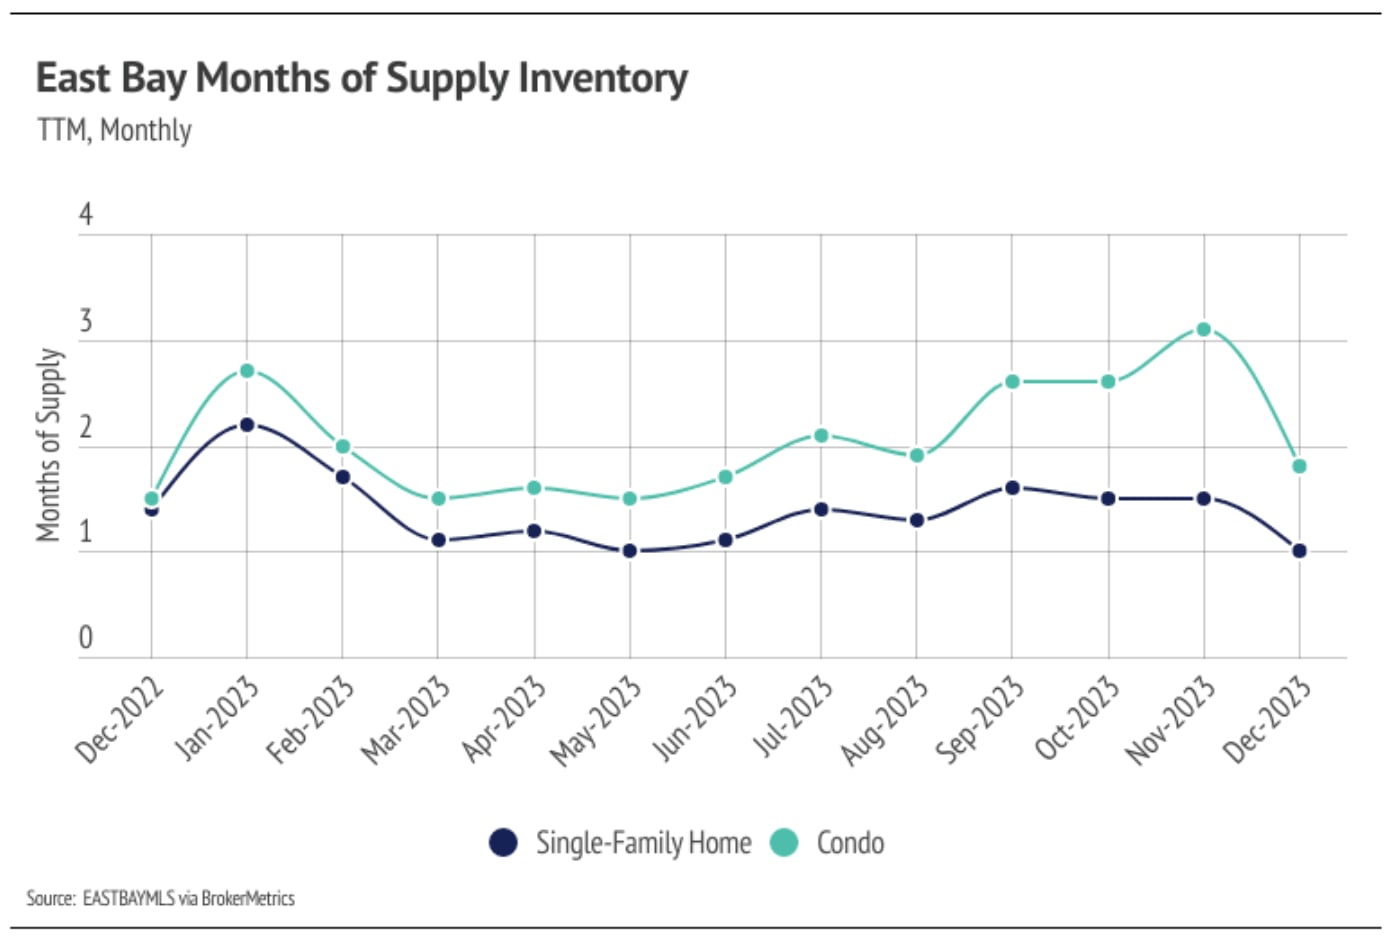
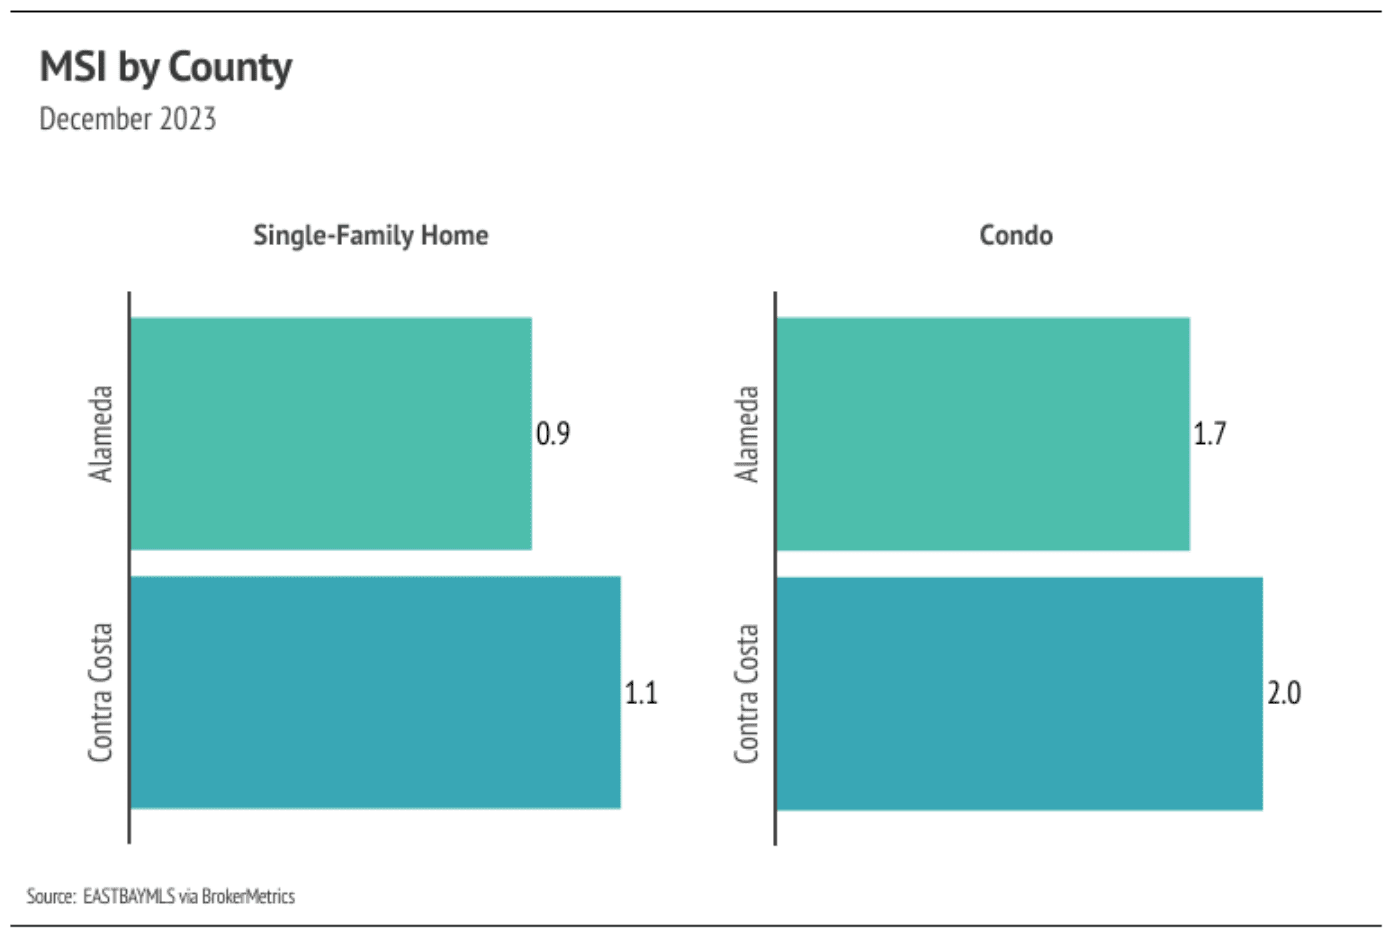
  • Months of Supply Inventory declined significantly in December, as sales outpaced new listings, indicating the market firmly favors sellers as we enter the new year.
Note: You can find the charts/graphs for the Local Lowdown at the end of this section.
 

Median single-family home prices close 2023 up year over year

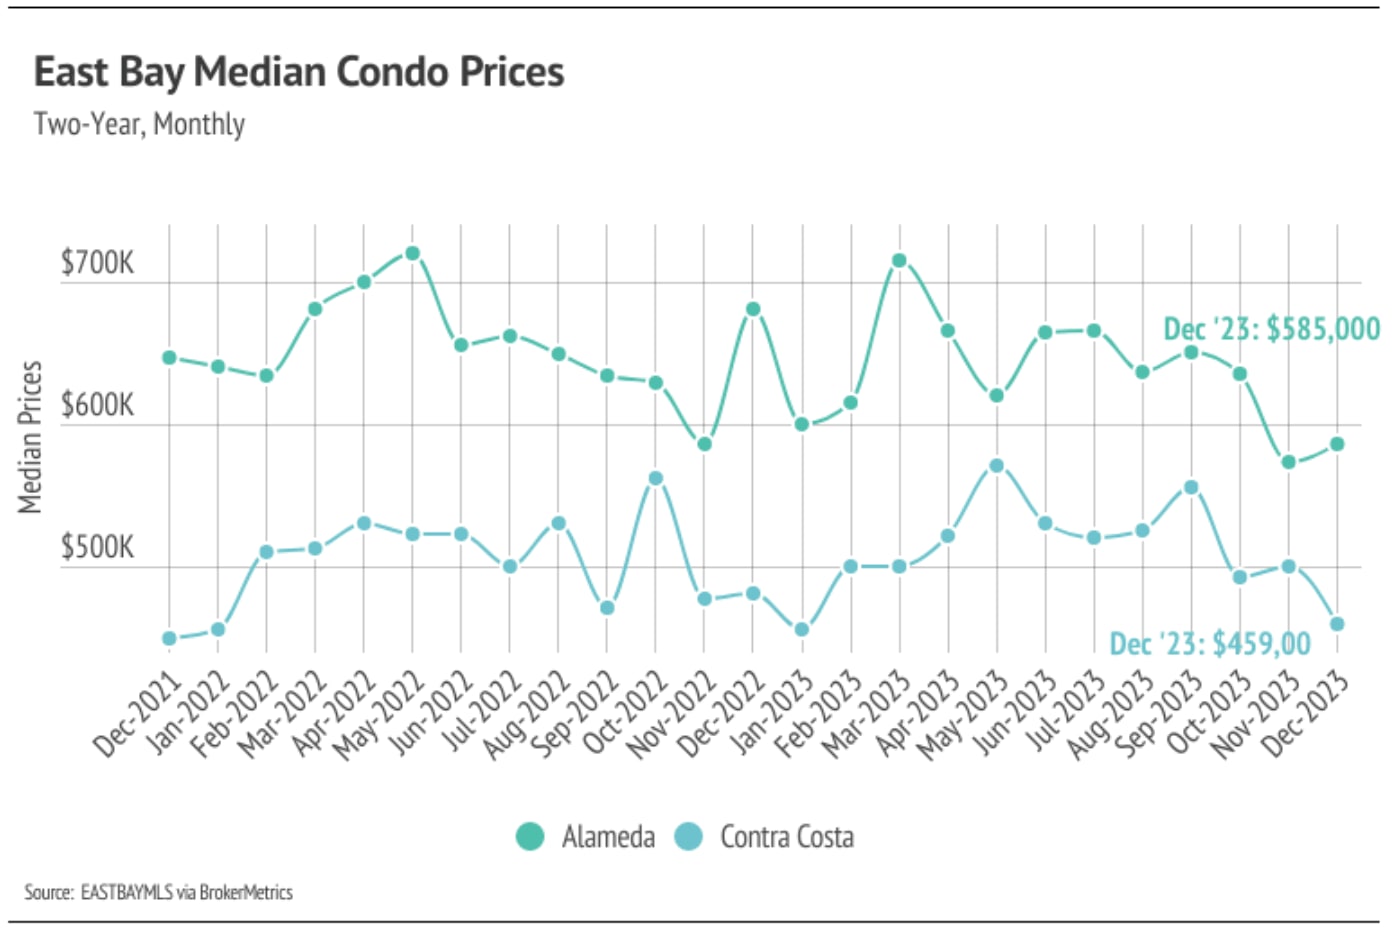
In the East Bay, home prices haven’t been largely affected by rising mortgage rates after the initial period of price correction from May 2022 to January 2023. Month over month, in December, the median single-family home price declined 4.5% in Alameda and 7.0% in Contra Costa. Condo prices were more mixed, with a 2.1% increase in Alameda and an 8.6% decrease in Contra Costa. We expect prices to remain fairly stable in the winter months, but as interest rates decline and more sellers come to the market, prices will almost certainly rise in the first half of 2024. More homes must come to the market in the spring and summer to get anything close to a healthy market.
 
High mortgage rates soften both supply and demand, so ideally, as rates fall, far more sellers will come to the market. Rising demand can only do so much for the market if there isn’t supply to meet it. Unlike 2023 inventory, 2024 inventory has a much better chance of following more typical seasonal patterns.
 

Inventory, sales, and new listings declined month over month

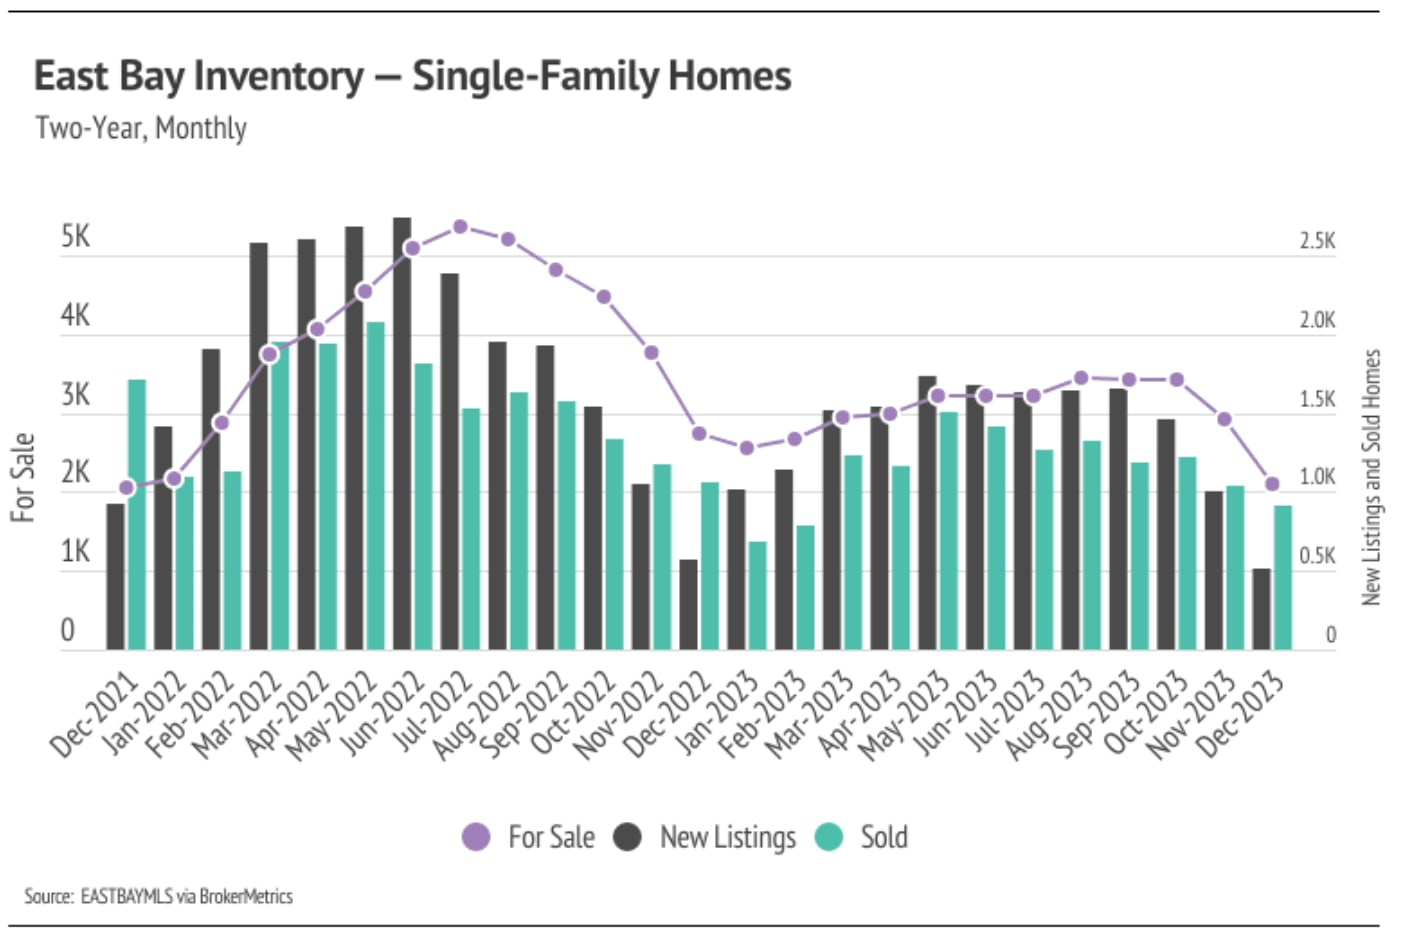
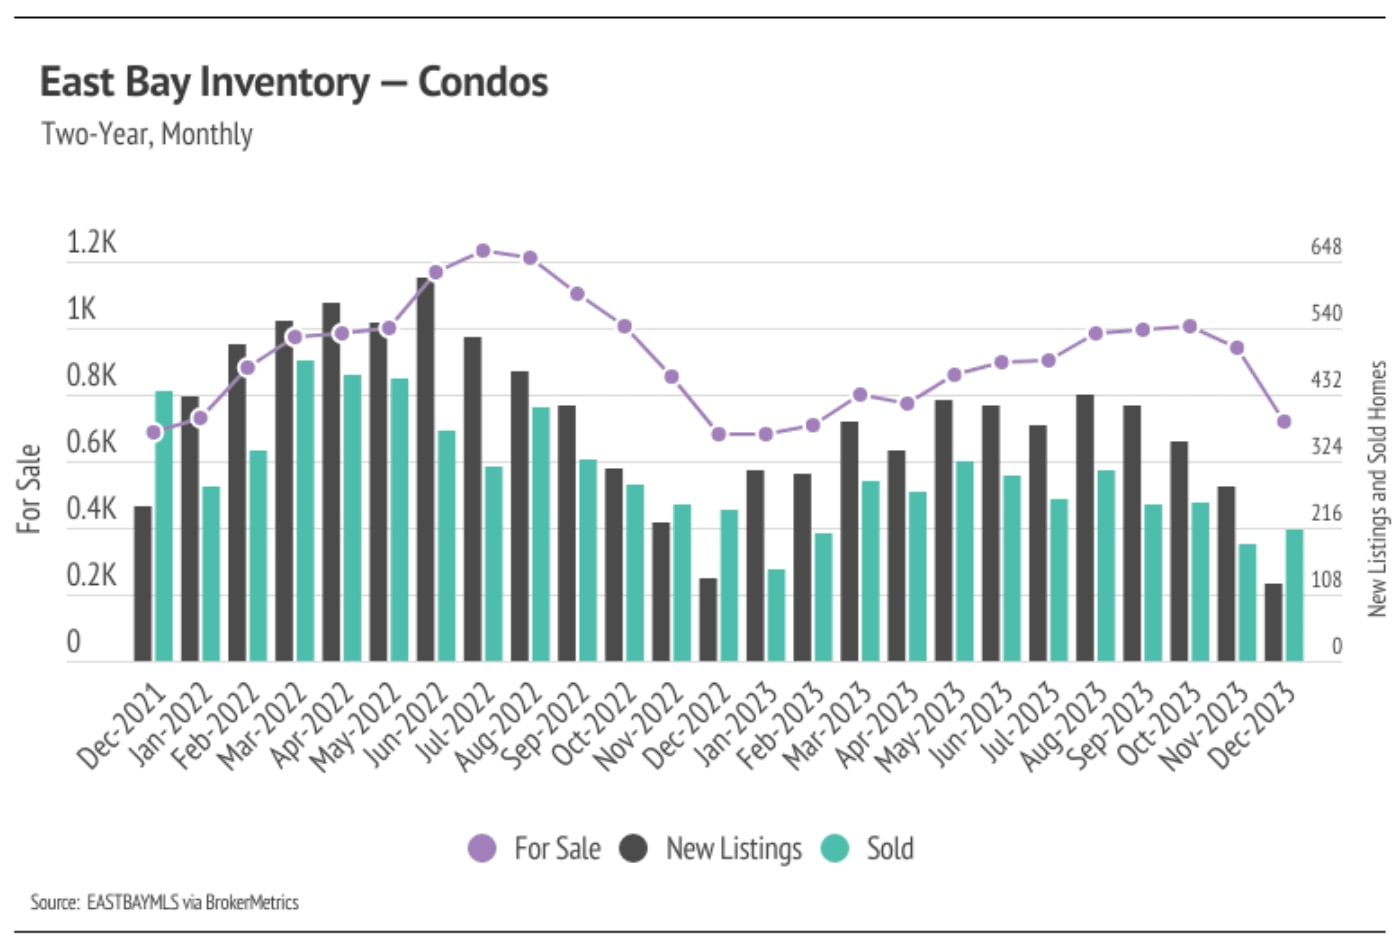
Single-family home and condo inventory barely increased at all last year, which is far from the seasonal norm. In 2023, inventory didn’t have anything resembling the typical sine wave, since far fewer sellers came to the market, especially in the first half of the year, and the low inventory and fewer new listings slowed the market considerably. New listings have been exceptionally low, so the little inventory growth last year was driven by softening demand. Typically, inventory peaks in July or August and declines through December or January. However, in 2023, inventory peaked in October, further highlighting the atypical supply trend. In November and December, inventory, sales, and new listings dropped, which is normal this time of year. With the current low inventory levels, the number of new listings coming to market is a significant predictor of sales. Month over month, new listings fell 50% and sales declined 8%. Total inventory is down 18% year over year.
 
As demand slows, buyers are gaining more negotiating power and paying less than they were during the busier summer season. In June 2023, the average seller received 105% of list price, compared to 101% of list in December. However, on average, buyers paid 4% more in December 2023 than December 2022. Inventory will almost certainly remain historically low for the next few months, and buyer competition will ramp up meaningfully in the spring, which will drive price appreciation.
 

Months of Supply Inventory in December 2023 indicated a sellers’ market

Months of Supply Inventory (MSI) quantifies the supply/demand relationship by measuring how many months it would take for all current homes listed on the market to sell at the current rate of sales. The long-term average MSI is around three months in California, which indicates a balanced market. An MSI lower than three indicates that there are more buyers than sellers on the market (meaning it’s a sellers’ market), while a higher MSI indicates there are more sellers than buyers (meaning it’s a buyers’ market). The East Bay market tends to favor sellers, which is reflected in its low MSI. MSI fell sharply in the first quarter of 2023 before gently trending higher from May to November. In December, MSI declined sharply. Currently, the East Bay housing market favors sellers.
 

Local Lowdown Data

Chart compares monthly median single-family home prices in Alameda and Contra Costa from December 2021 to December 2023.

Chart compares 2023 year-over-year single-family home median price changes in Alameda and Contra Costa counties.

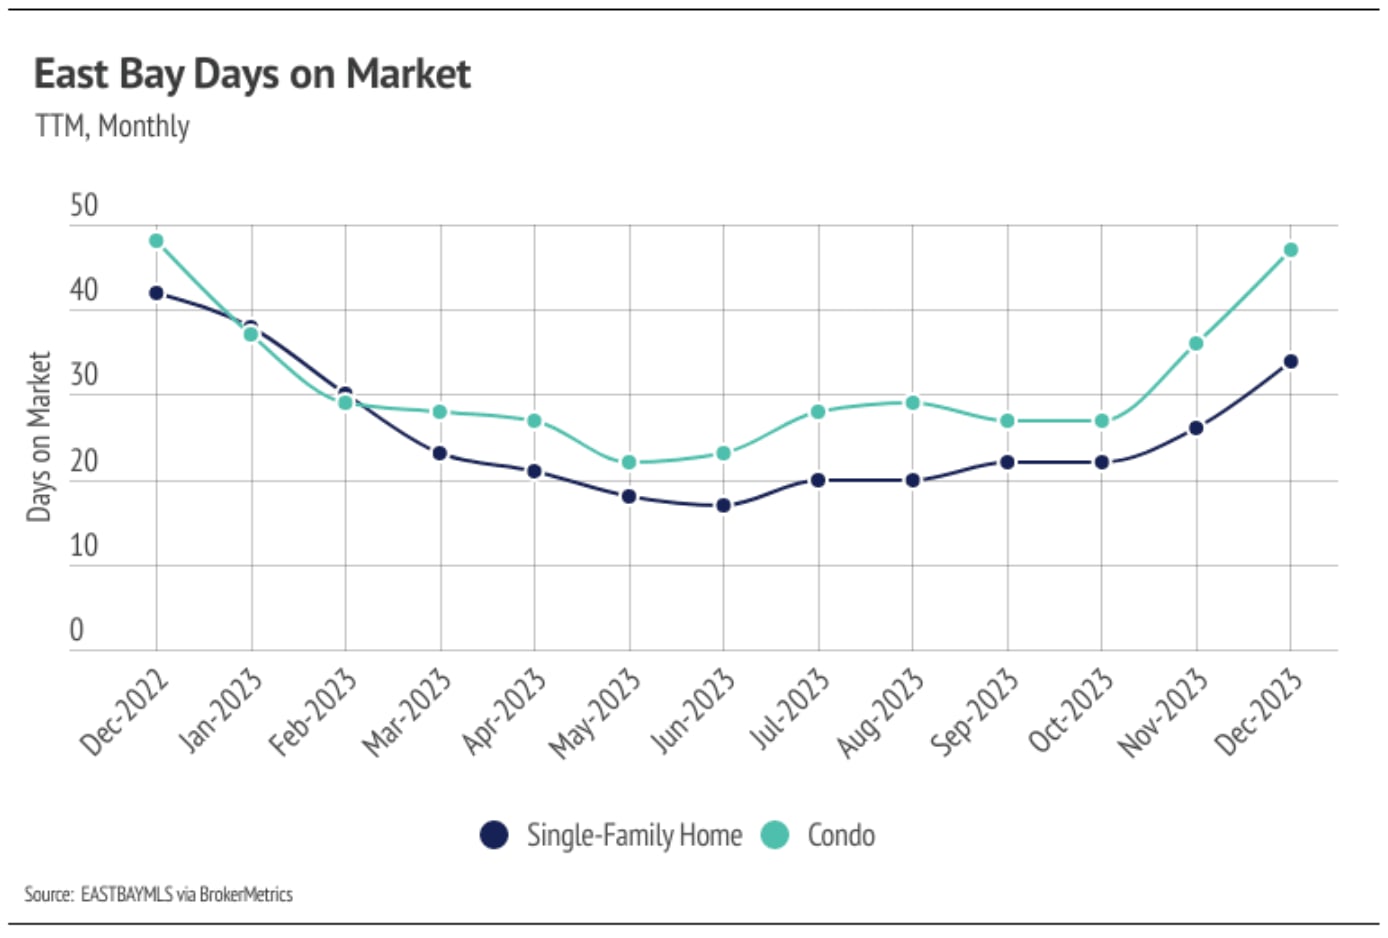
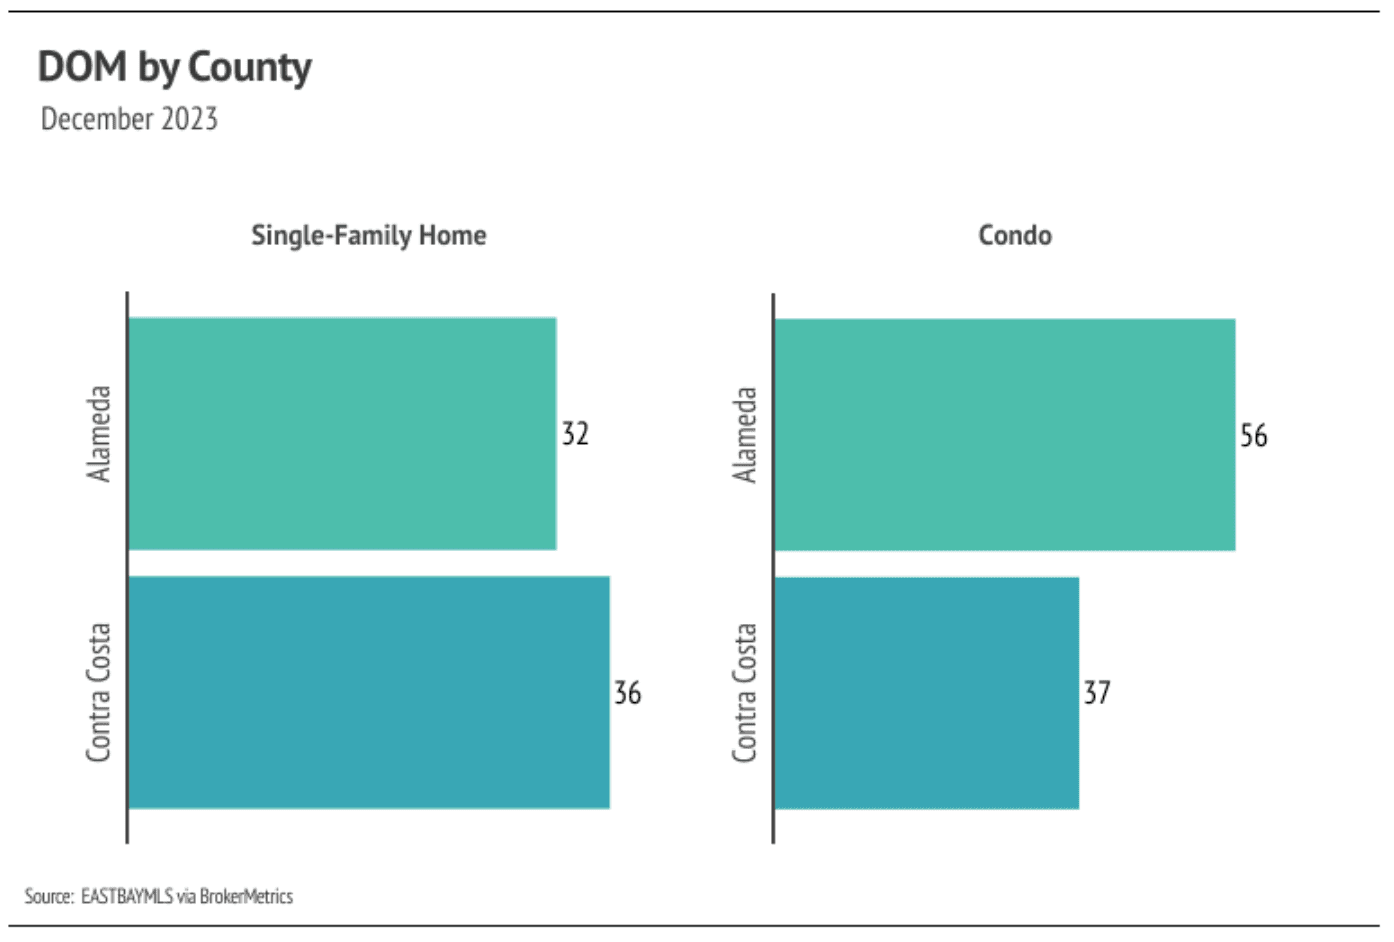
Line chart of monthly East Bay condo prices, December 2021–December 2023, comparing Alameda and Contra Costa.Chart comparing monthly year-over-year condo median price changes in Alameda and Contra Costa counties during 2023.East Bay single-family home inventory chart comparing homes for sale, new listings, and sales from December 2021 to December 2023.Chart tracking East Bay condo inventory, new listings, and sales monthly from December 2021 through December 2023.Chart comparing monthly East Bay days on market for single-family homes and condos in 2023.December 2023 days-on-market chart comparing single-family homes and condos in Alameda and Contra Costa counties.East Bay monthly inventory chart comparing months of supply for condos and single-family homes, December 2022–December 2023.December 2023 months of supply chart: single-family homes, Alameda 0.9 and Contra Costa 1.1; condos, 1.7 and 2.0.

We Would Love to Meet You!

You’ve got questions and we can’t wait to answer them.