The Local Lowdown: February 2025

Michelle Kim  |  February 28, 2025

The Local Lowdown: February 2025

The Local Lowdown

Quick Take:
  • The Bay Area market remains incredibly strong overall, despite some fluctuations across different regions.
  • Inventory trends are diverging, with some areas experiencing increasing supply while others continue to struggle with low active listings.
  • Market conditions heavily favor sellers in most counties, but select condo markets are seeing opportunities for buyers.
  • Pricing remains relatively resilient, though some regions have seen slight declines as interest rates influence affordability.
Note: You can find the charts/graphs for the Local Lowdown at the end of this section.

Resilience in the Bay Area Housing Market

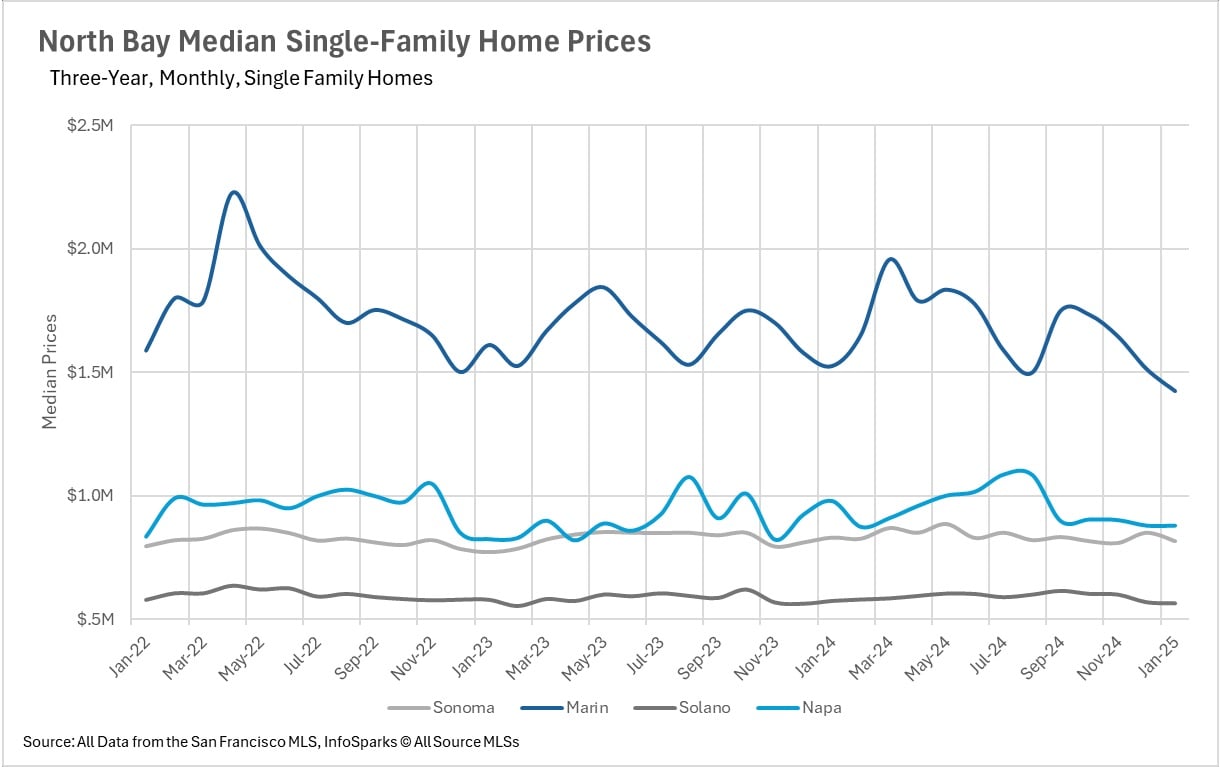
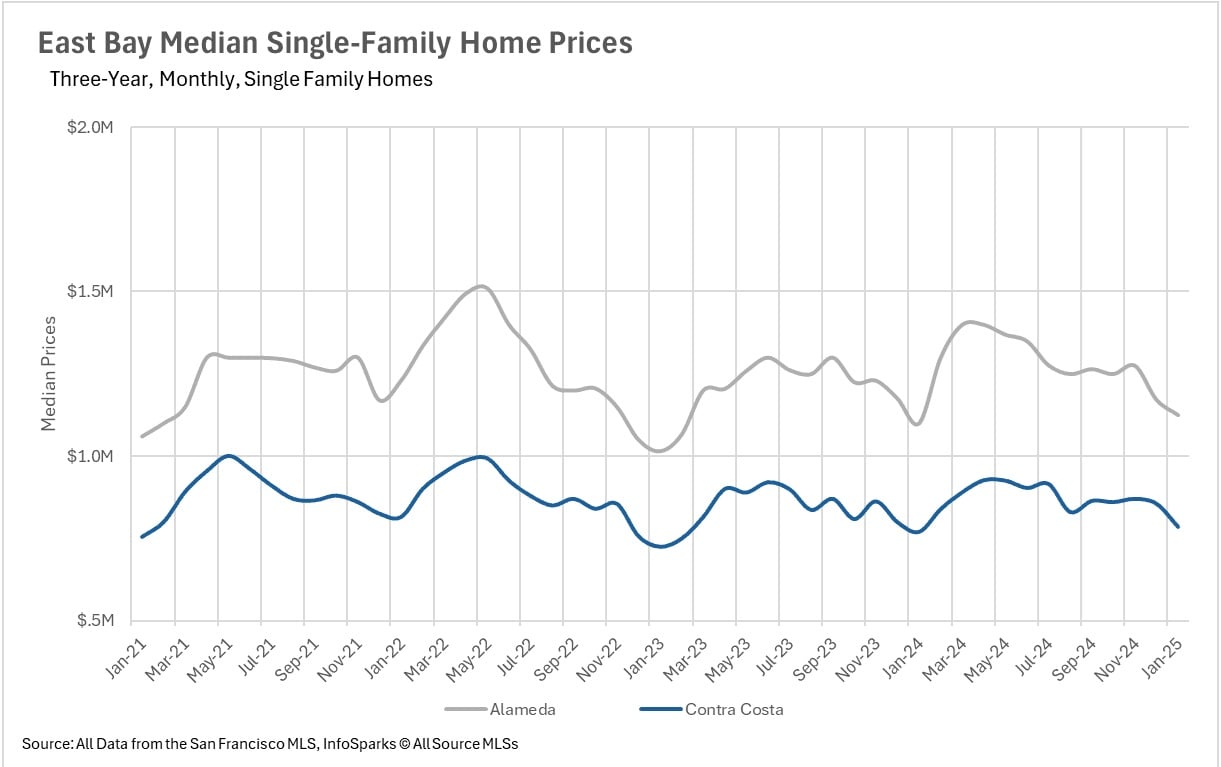
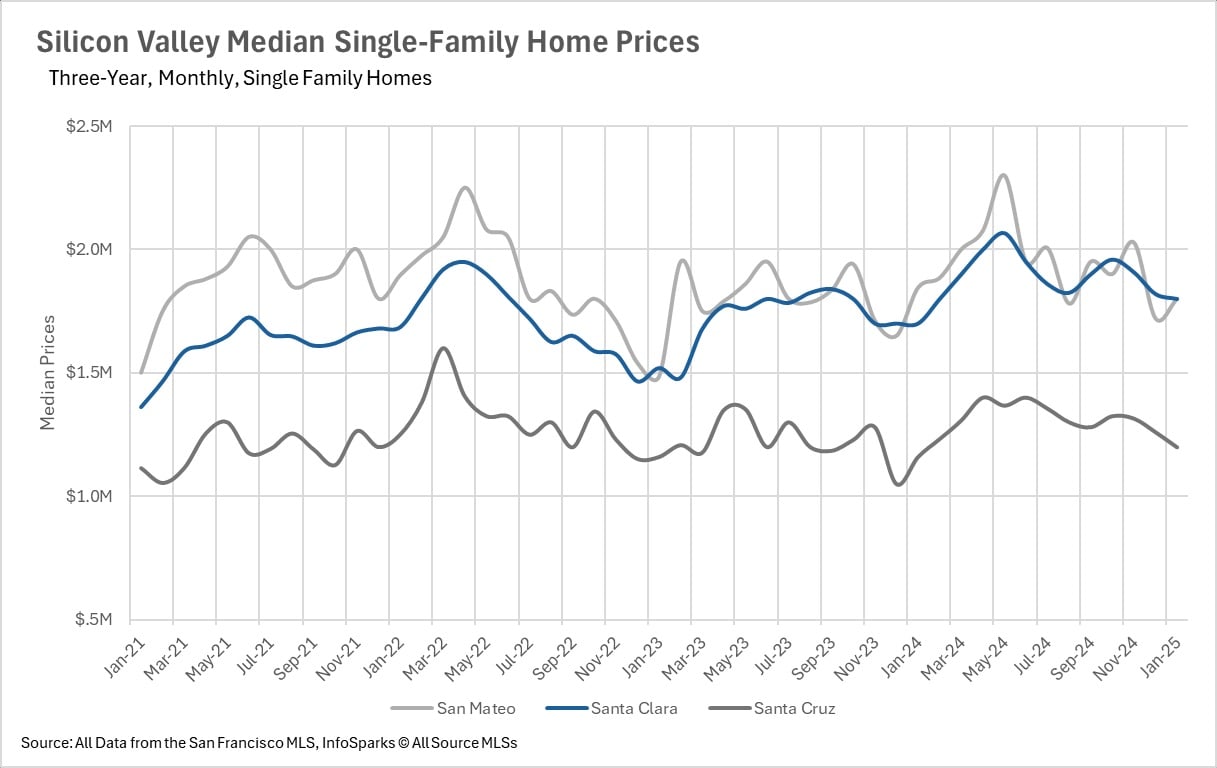
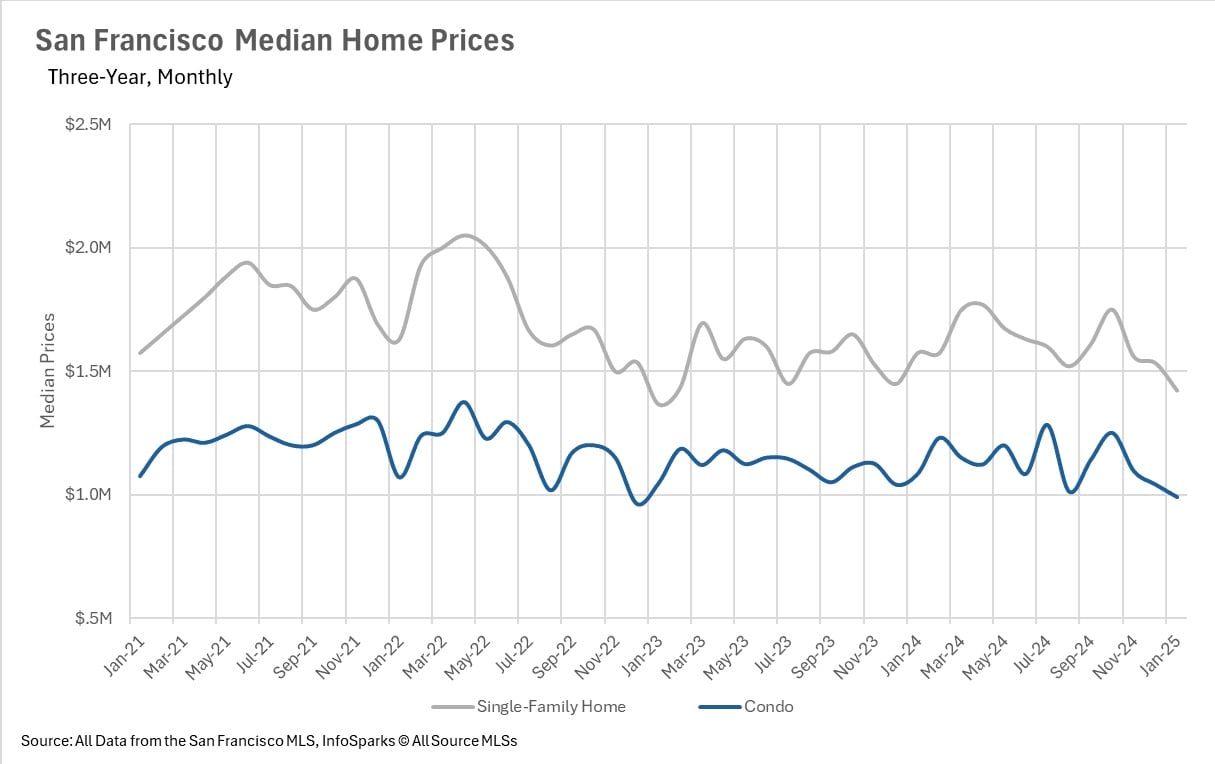
Despite economic uncertainty and fluctuating interest rates, the Bay Area housing market remains strong. While some regions saw modest price declines, others, like Alameda and Contra Costa, experienced year-over-year increases of 2.27% and 1.95%, respectively, in median single-family home prices. Silicon Valley continued its growth trajectory, with Santa Clara and Santa Cruz Counties posting 5.88% and 3.36% increases, respectively, while San Mateo saw a slight 2.44% dip. Meanwhile, San Francisco experienced declines, with single-family home prices dropping 9.68% to a median of $1,422,500 and condos falling 8.76% to $990,000. The North Bay showed stability, though Marin and Napa Counties gave back some of last year’s gains, with median price declines of 6.69% and 10.20%.

Inventory Trends Are Mixed Across the Bay

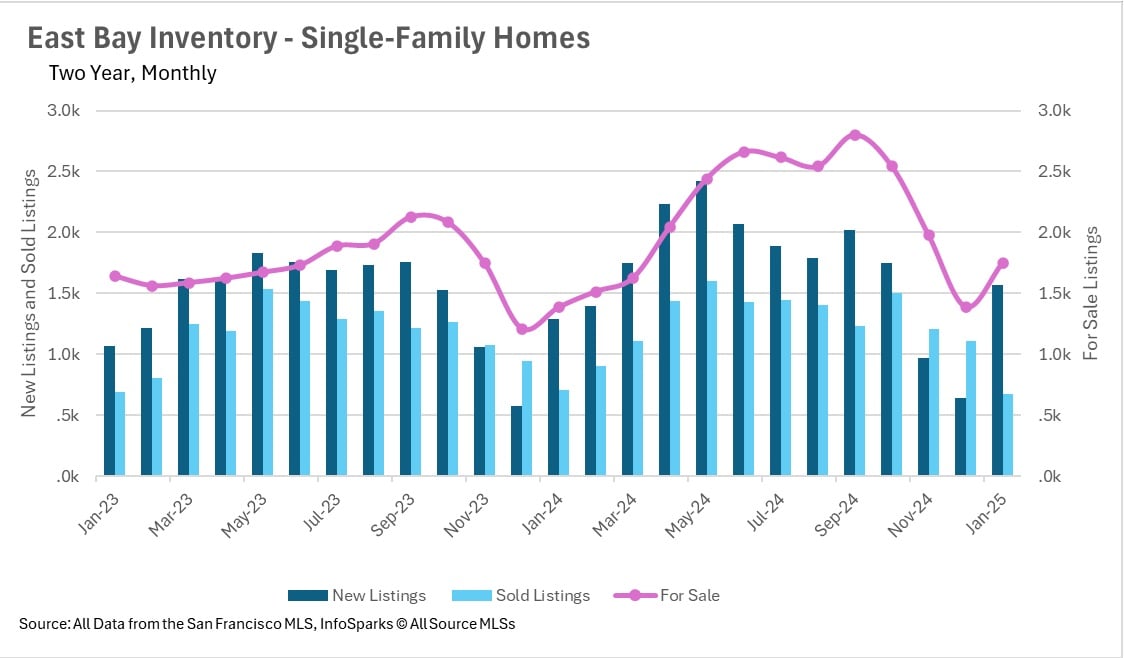
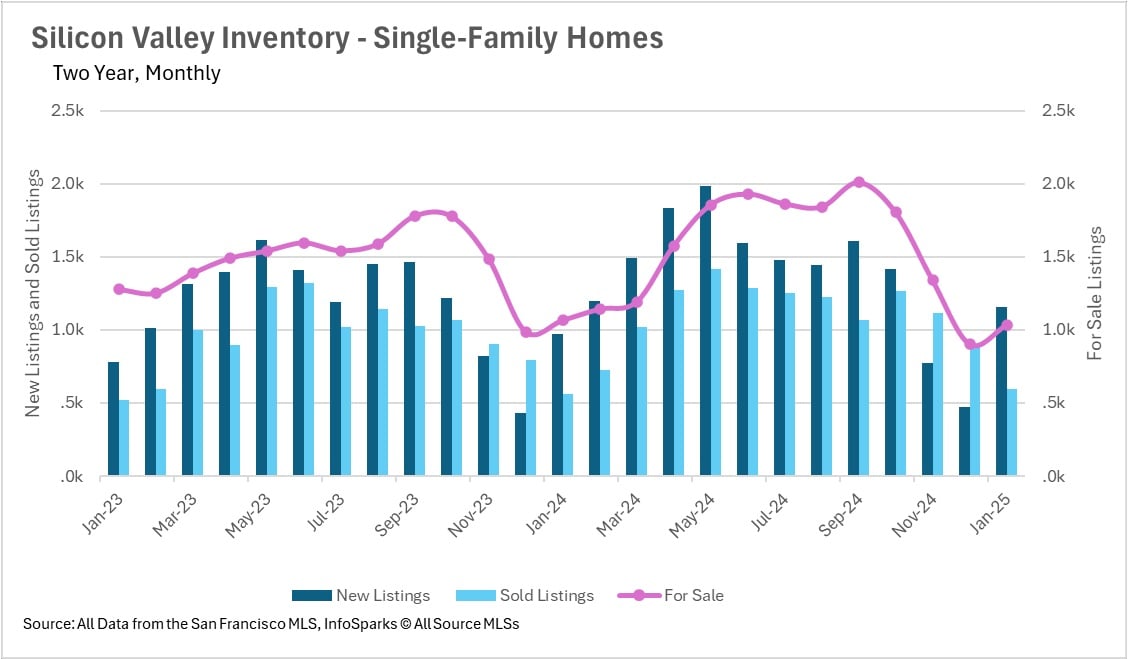
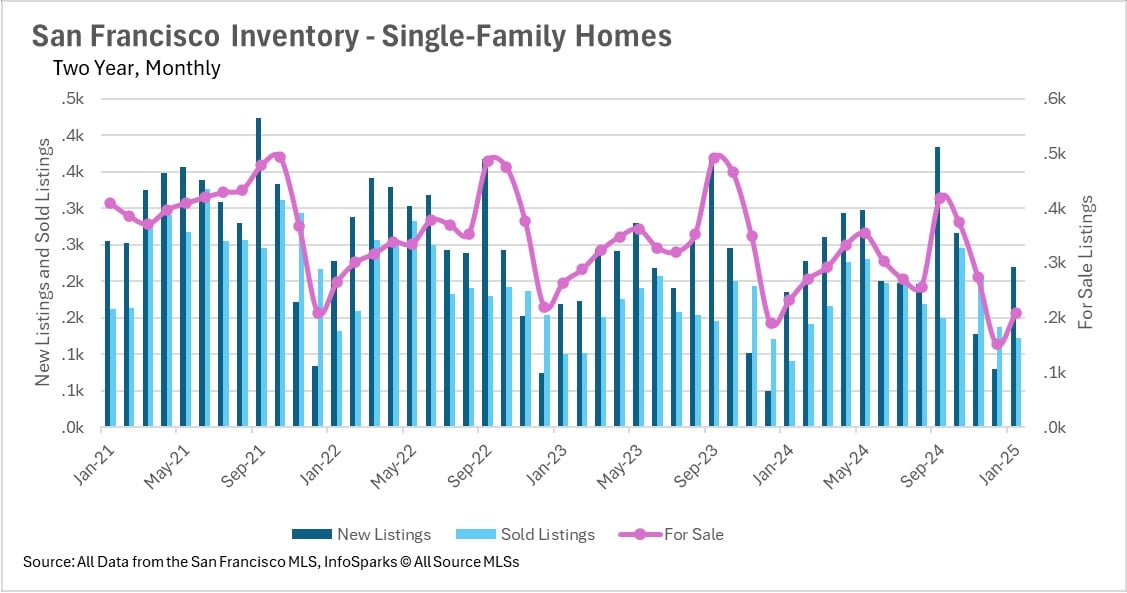
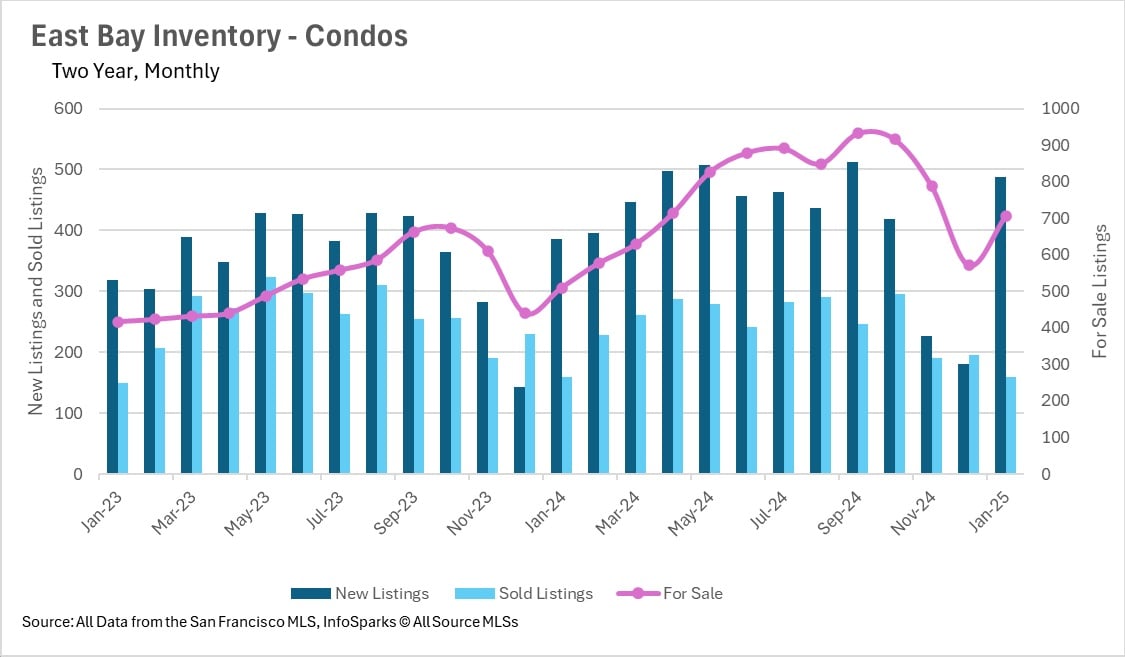
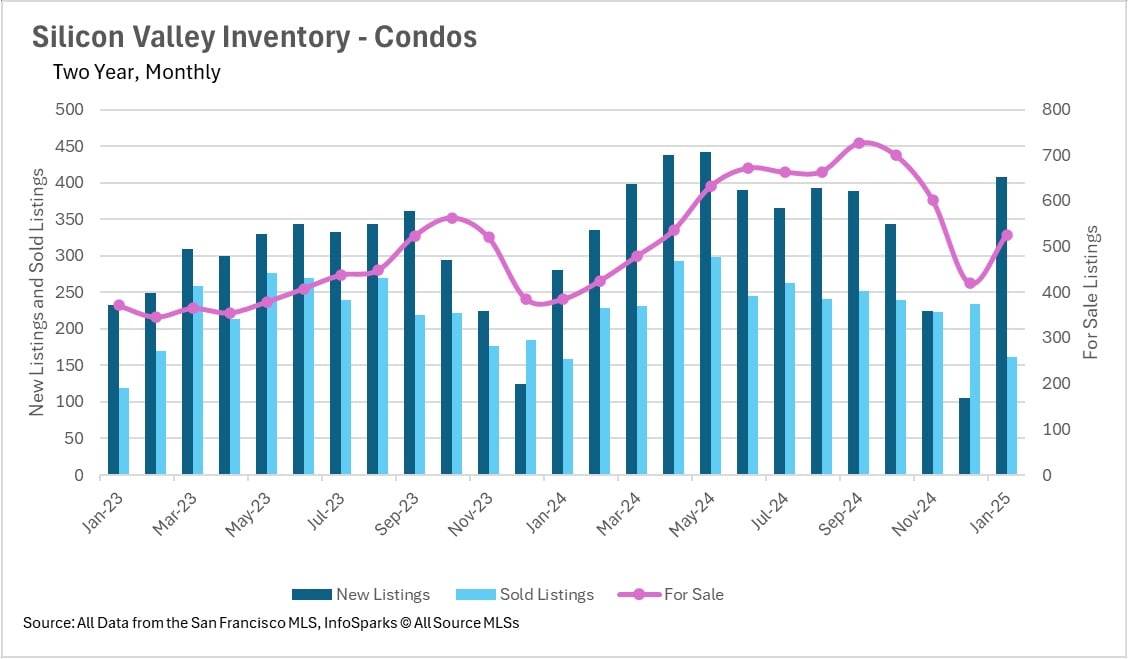
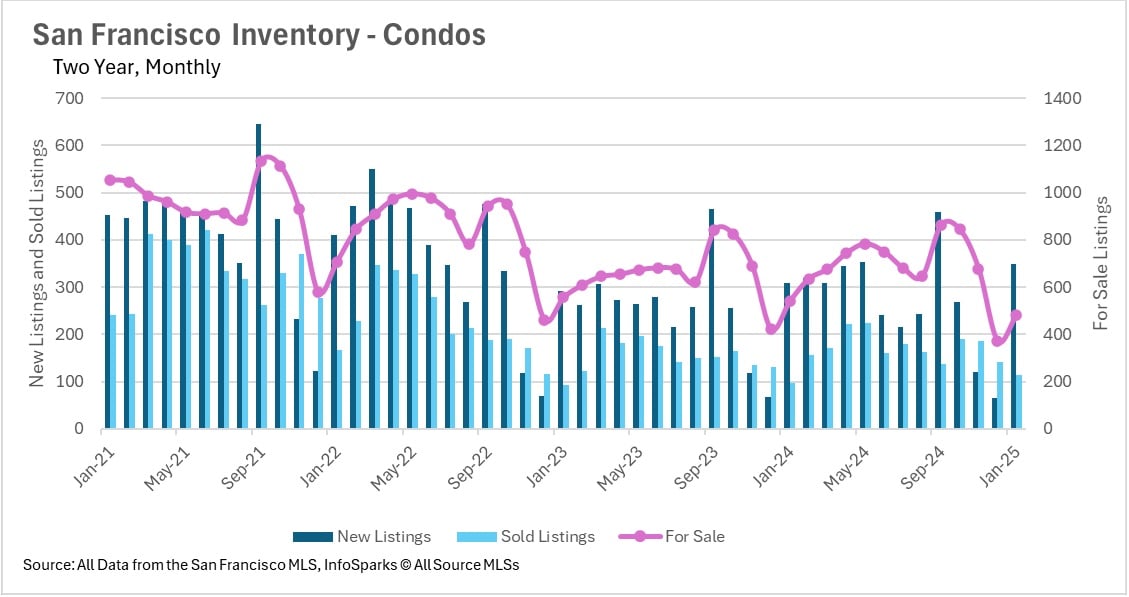
Inventory levels are diverging across regions. The East Bay saw a 21.59% increase in new single-family home listings and a 26.39% rise in active listings, while Contra Costa condo listings increased by 26.42% and active inventory surged 38.24%. In contrast, the North Bay faced a 16.55% drop in active single-family home listings, contributing to a tighter market. San Francisco remains constrained, with a 10.34% decline in single-family home inventory and a 10.91% drop in active condo listings. Silicon Valley’s condo market is an outlier, seeing a 36.62% rise in active listings and a 45.2% jump in new condo listings, signaling possible buying opportunities.

Days on Market & Buyer/Seller Power Balance

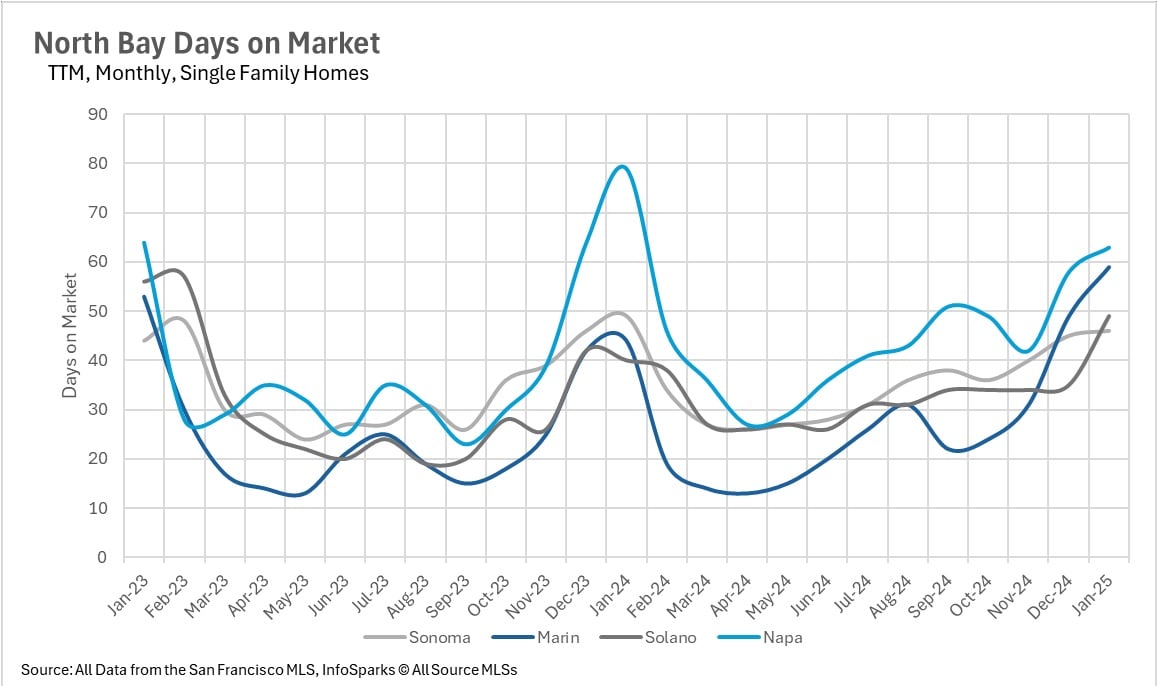
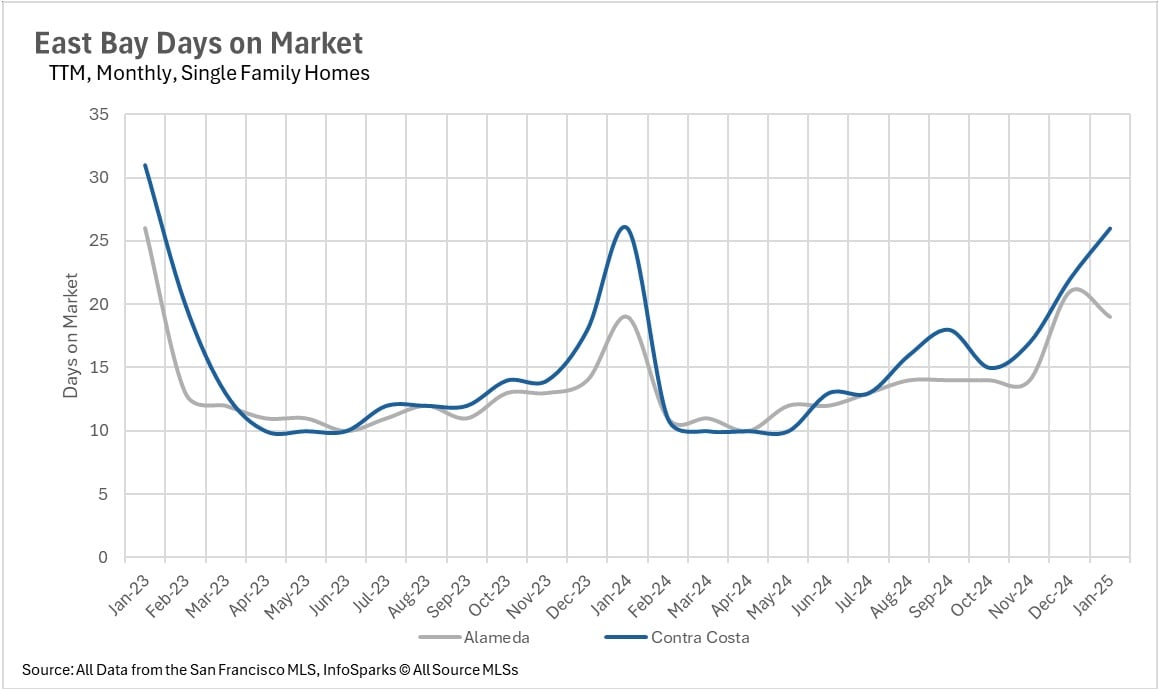
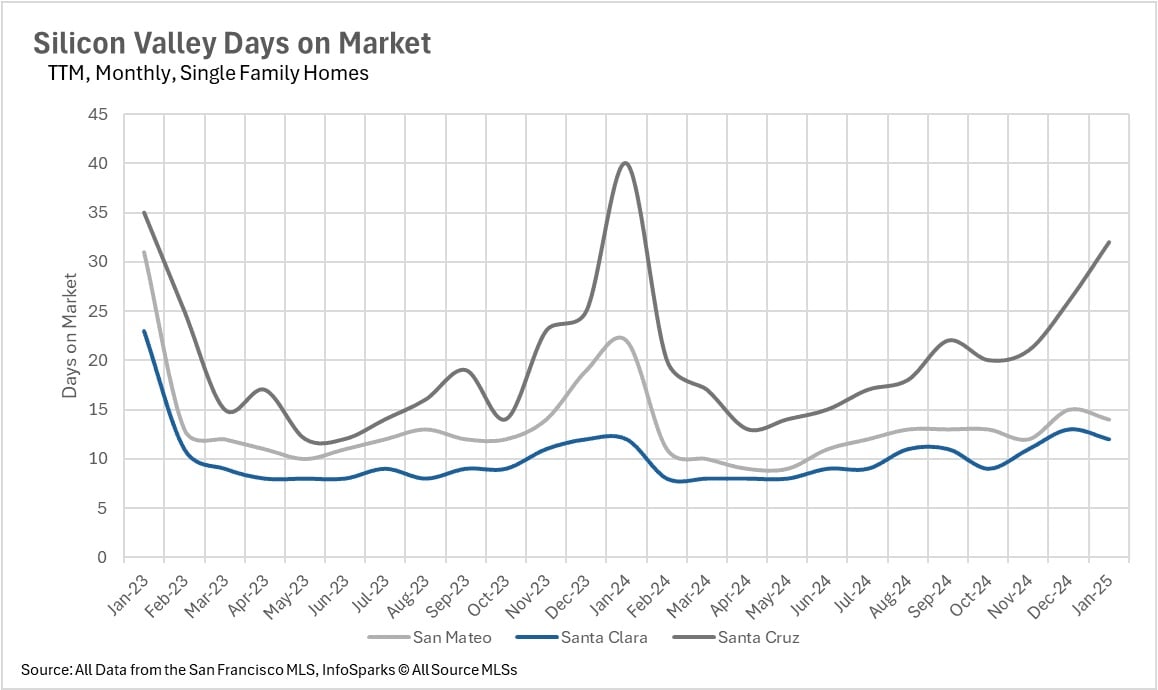
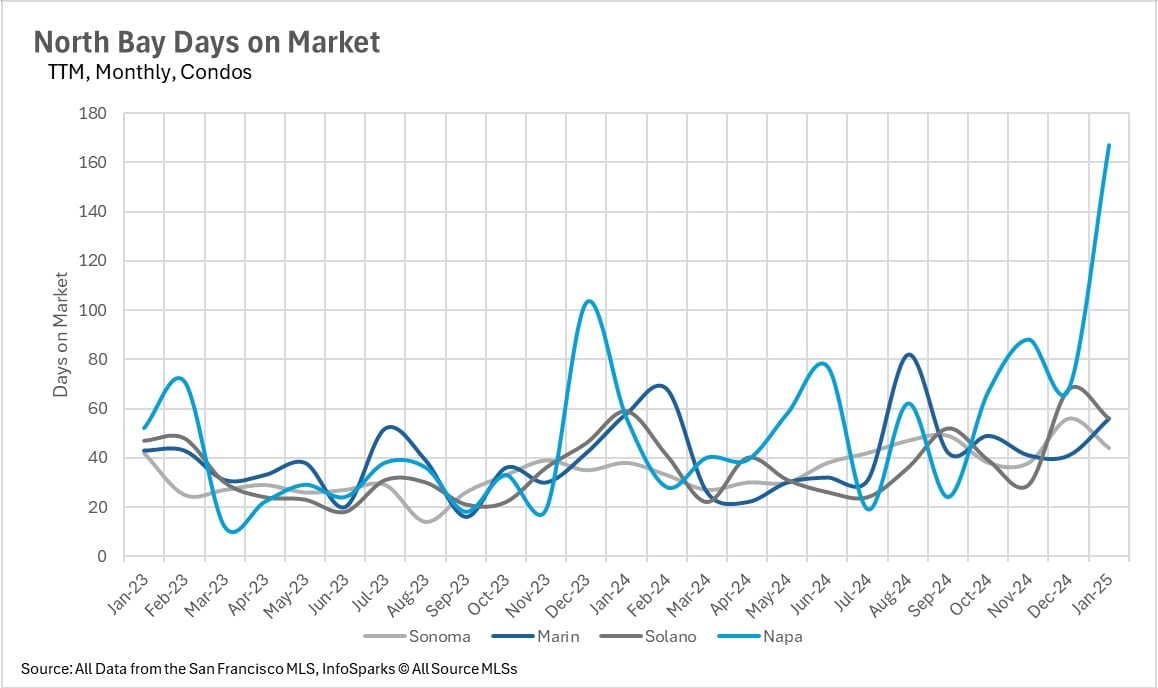
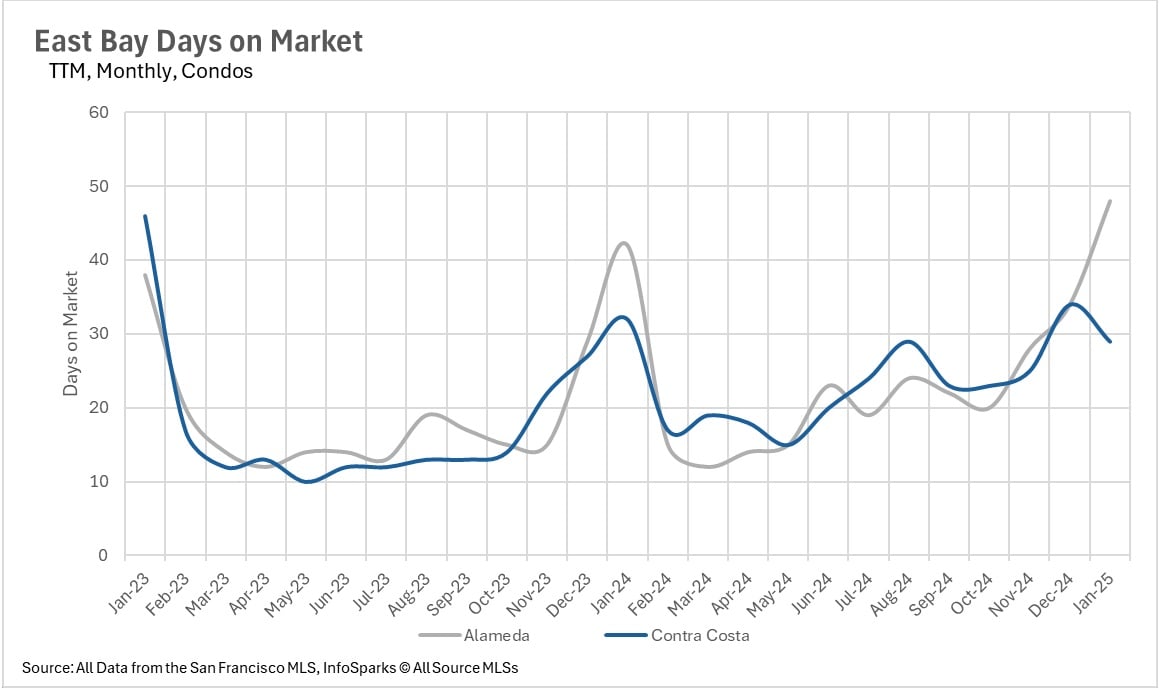
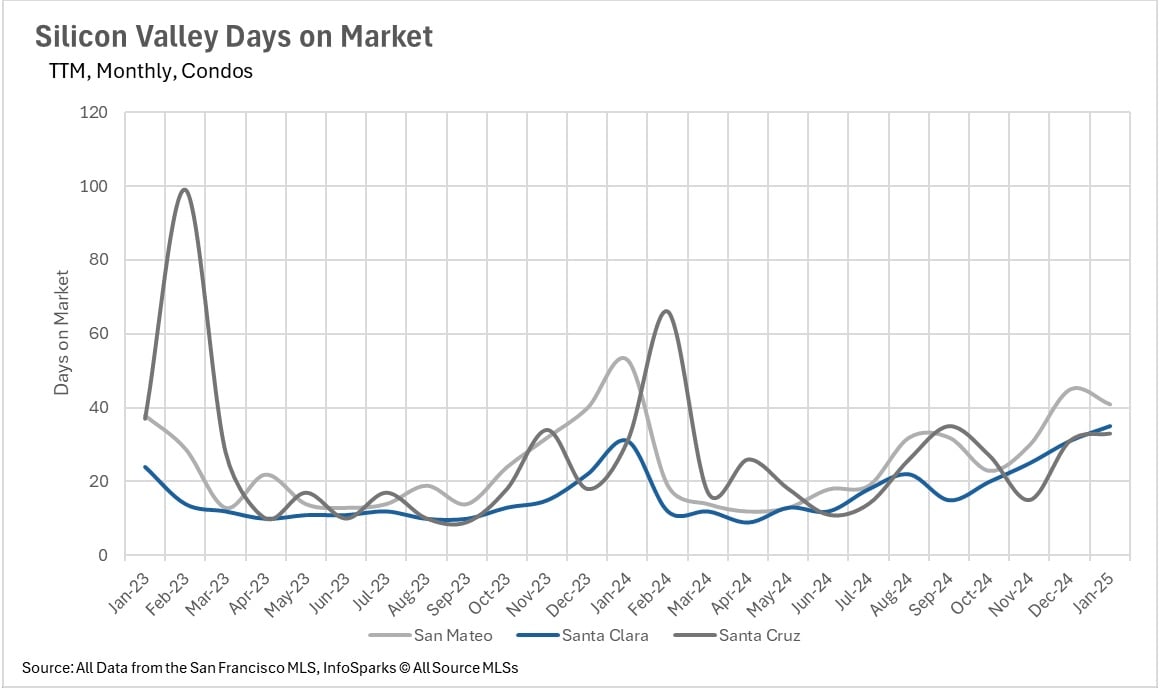
Homes are staying on the market longer in some regions while others continue to move quickly. Contra Costa single-family homes are sitting 26% longer than those in Alameda, while Alameda condos are lingering 65% longer than Contra Costa condos. In Marin, single-family homes are taking 34% longer to sell, and Napa condos saw a 198% spike in days on market. Meanwhile, Silicon Valley’s single-family home market remains highly competitive, with listings spending just 12 to 32 days on the market, while condos are taking 12.9% and 6.45% longer to sell in Santa Clara and Santa Cruz.

The Bay Area Remains a Sellers’ Market (With a Few Buyer-Friendly Spots)

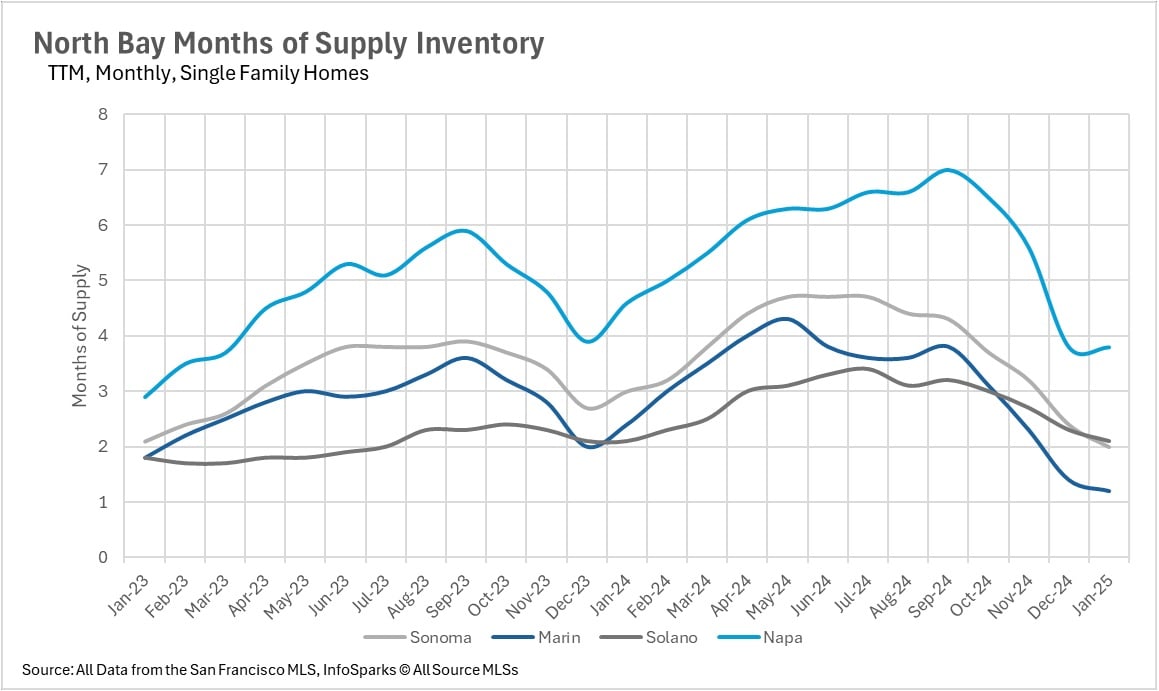
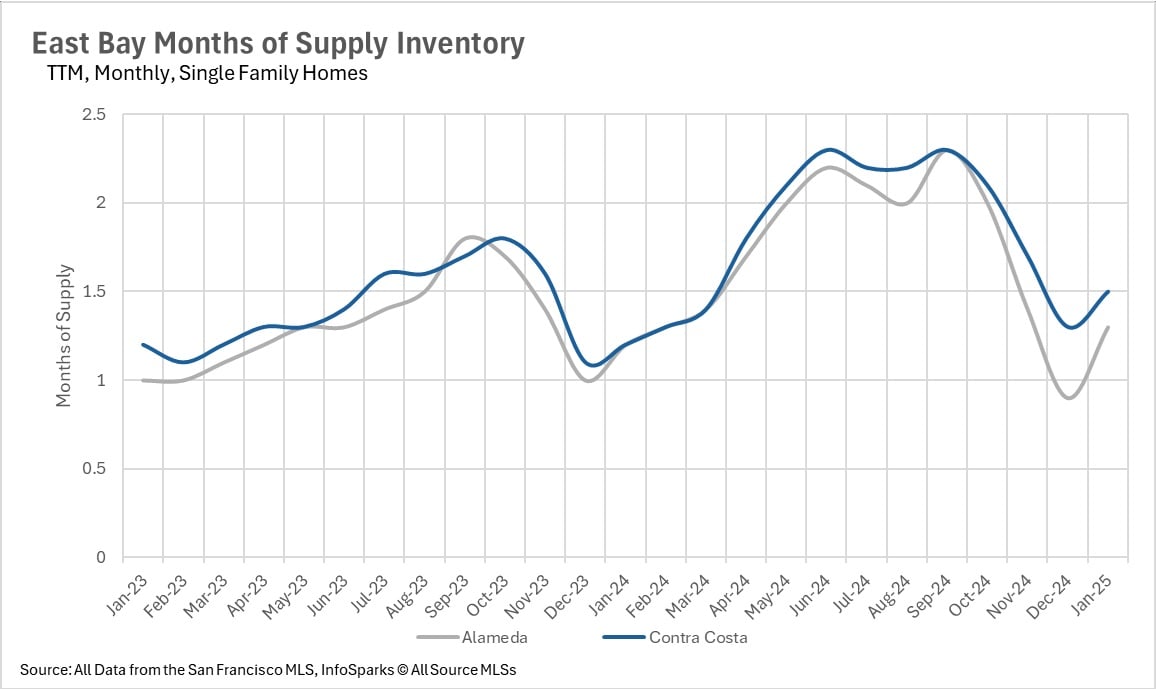
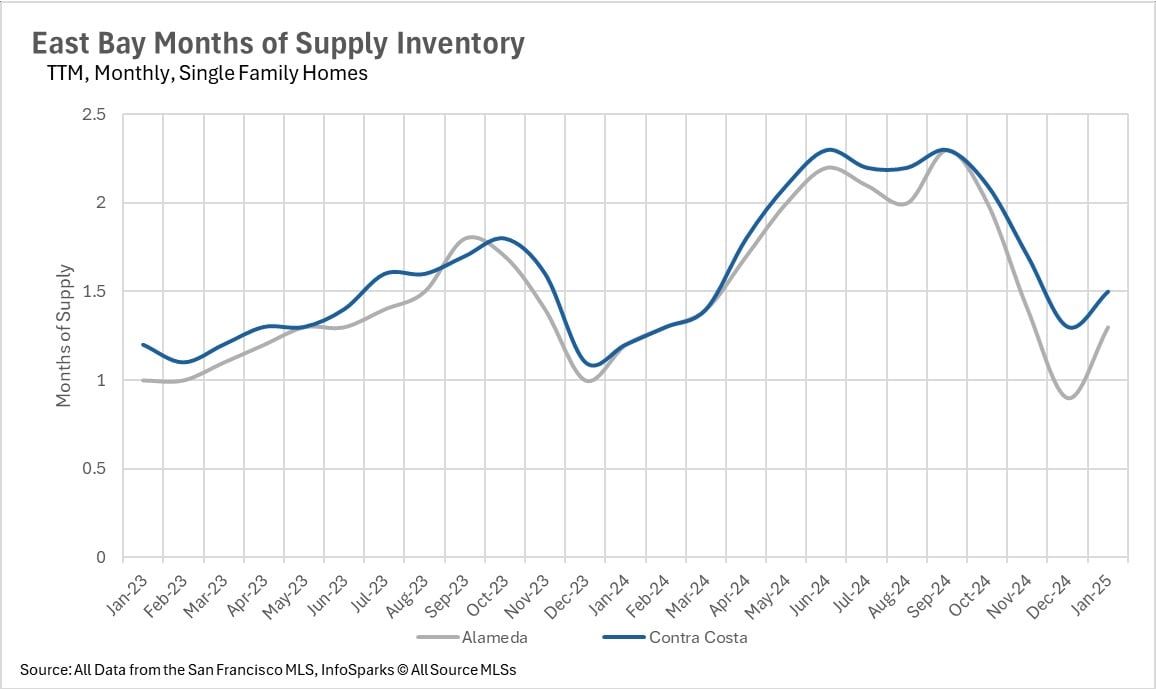
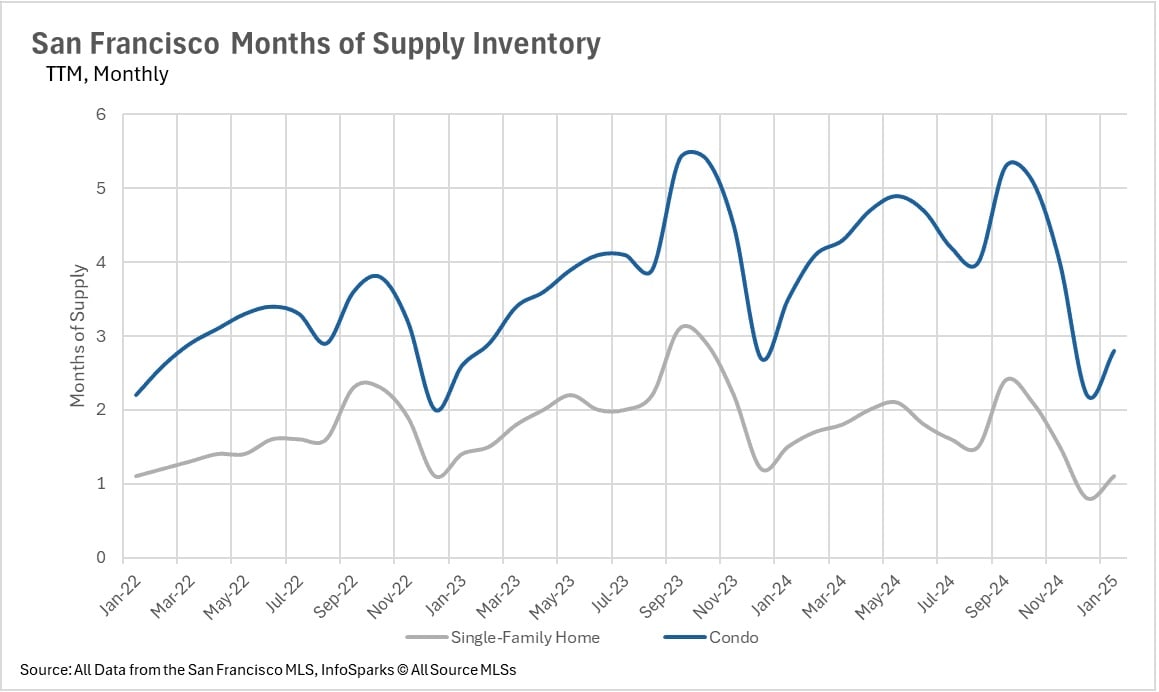
Most of the Bay Area continues to favor sellers, with low months of supply inventory. East Bay single-family homes remain in strong seller territory, with 1.3 and 1.5 months of inventory in Alameda and Contra Costa Counties, respectively, while condos hover near balance. Napa is a buyer’s market with 3.8 months of supply, while Sonoma (2.0), Marin (1.2), and Solano (2.1) remain seller-dominated. San Francisco also leans heavily in favor of sellers, with only 1.1 months of single-family home inventory and 2.8 months for condos. In Silicon Valley, single-family homes are firmly in a sellers’ market, with as little as 0.7 months of inventory in Santa Clara, while Santa Cruz condos, with 3.7 months of supply, favor buyers.

Looking Ahead

With demand staying strong and inventory constrained in many areas, competition is likely to persist. However, growing condo inventory in some markets may provide rare buying opportunities, particularly in Napa and Santa Cruz. As the spring season approaches, inventory trends and interest rate changes will shape the market’s next phase, making it crucial for buyers and sellers to stay informed.

Local Lowdown Data

Line chart comparing monthly median single-family home prices in Sonoma, Marin, Solano, and Napa counties, 2022–2025.

Line chart of East Bay median single-family home prices in Alameda and Contra Costa counties, January 2021–January 2025.

Chart comparing monthly median single-family home prices in San Mateo, Santa Clara, and Santa Cruz, 2021–2025.

Chart comparing San Francisco monthly median prices for single-family homes and condos from January 2021 to January 2025.

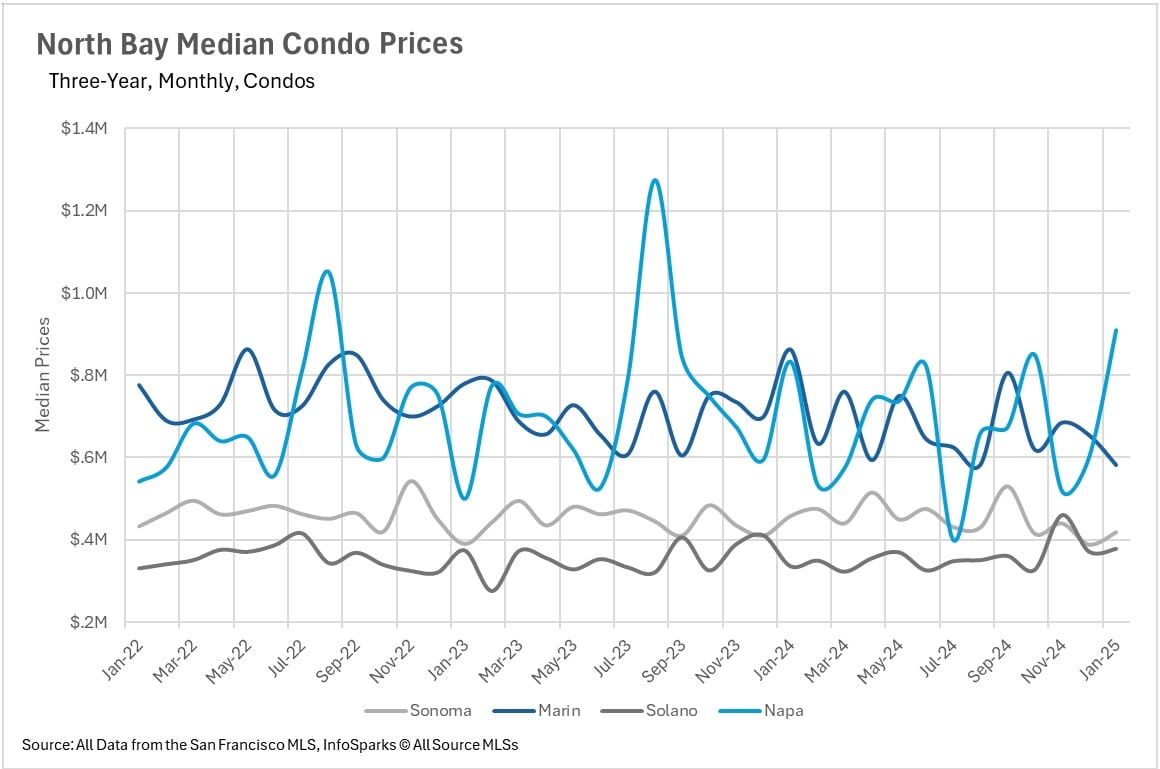
Line chart of monthly median condo prices in four North Bay counties, January 2022 to January 2025.

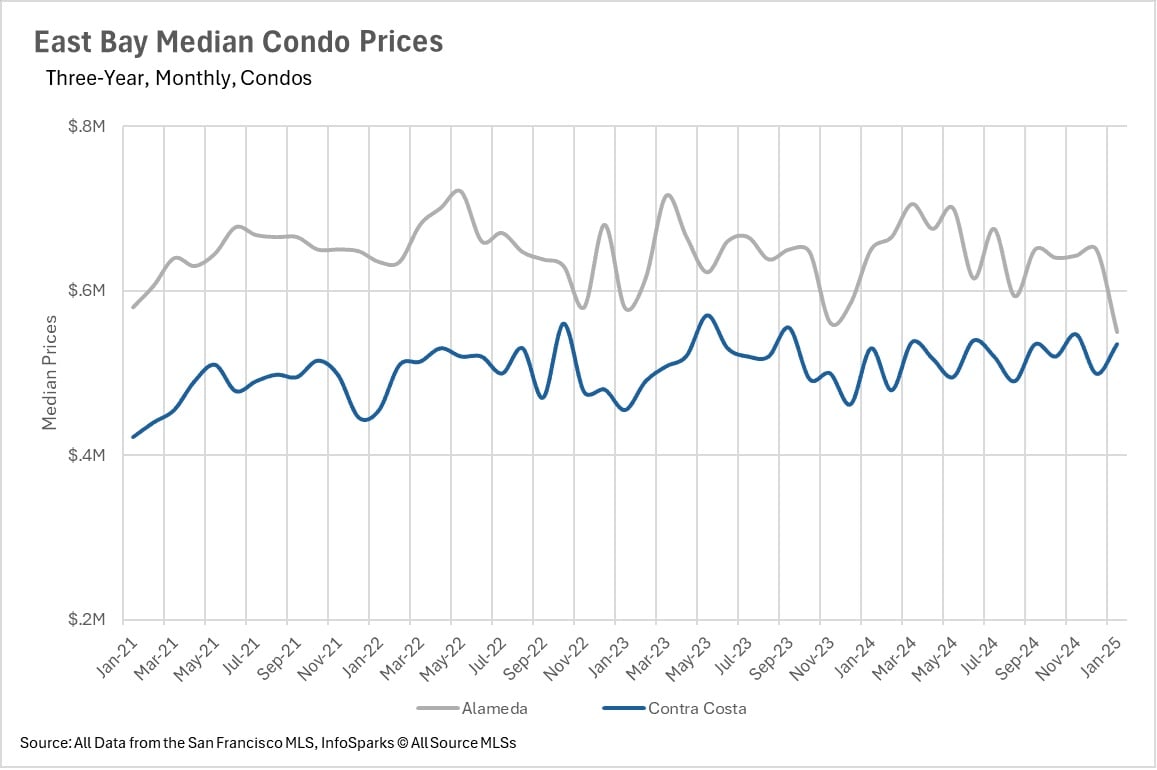
Line chart comparing monthly median condo prices in Alameda and Contra Costa from 2021 to 2025.

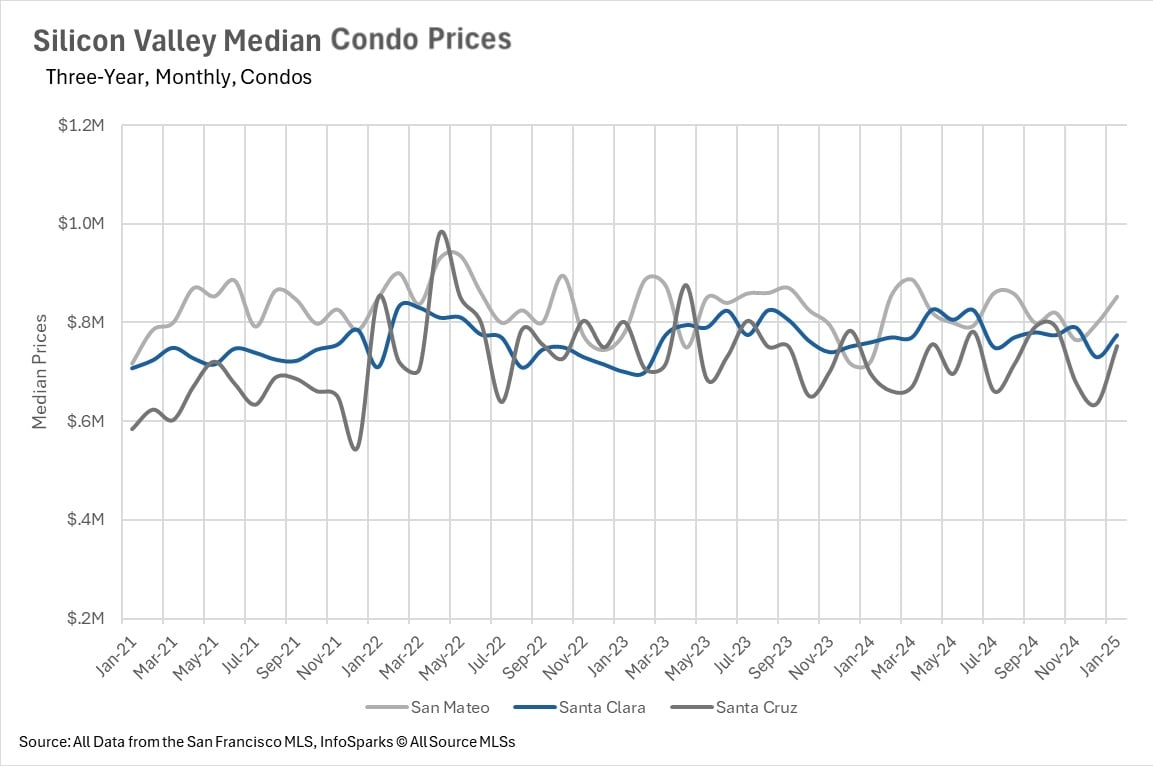
Line chart comparing monthly median condo prices in San Mateo, Santa Clara, and Santa Cruz from 2021 to 2025.

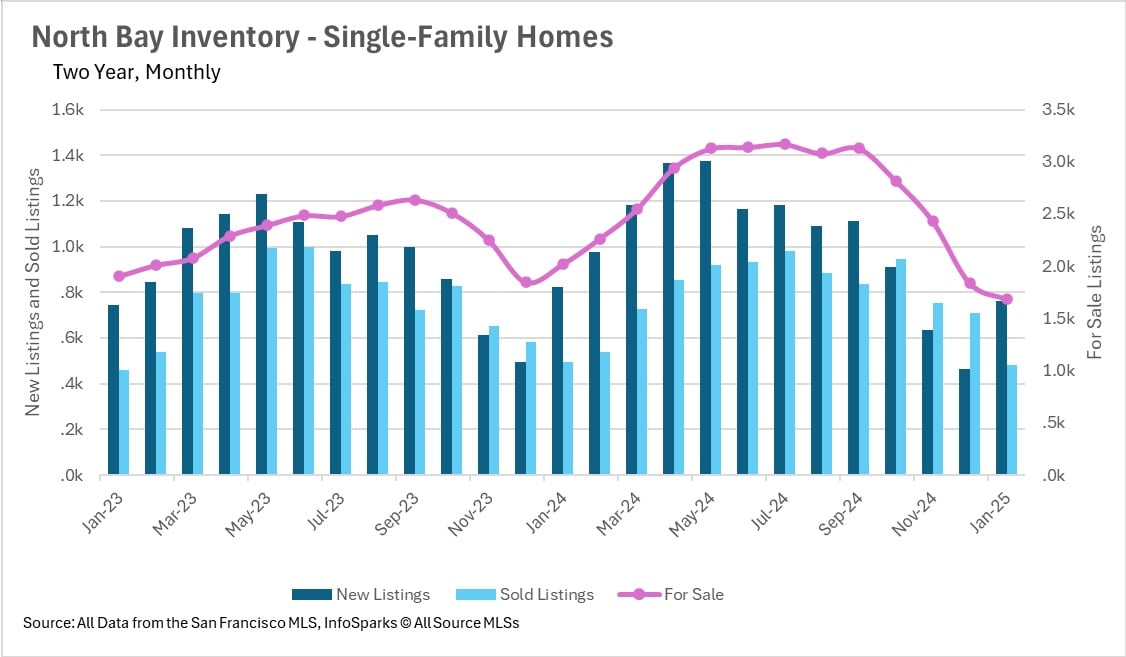
North Bay single-family home inventory chart showing new listings, sold listings, and homes for sale, January 2023–January 2025.

Chart of East Bay single-family home listings and inventory from January 2023 to January 2025.

Chart comparing monthly new listings, sold listings, and homes for sale in Silicon Valley from January 2023 to January 2025.

Chart of San Francisco single-family home listings and inventory from January 2021 to January 2025.

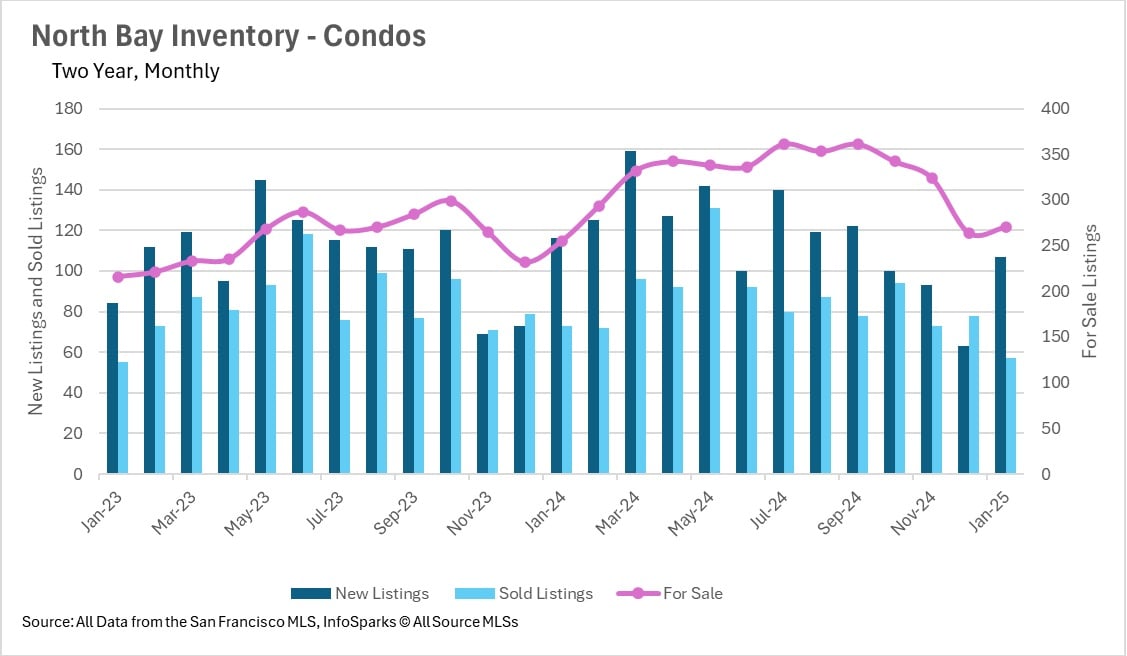
North Bay condo chart comparing monthly new listings, sold listings, and for-sale inventory, January 2023–January 2025.

East Bay condo inventory chart showing monthly new listings, sold listings, and homes for sale, January 2023–January 2025.

Silicon Valley condo inventory chart comparing monthly new listings, sold listings, and for-sale listings from January 2023 to January 2025.

Chart of San Francisco condo listings from 2021 to 2025, comparing new and sold listings with homes for sale.

Line chart comparing monthly days on market for single-family homes in Sonoma, Marin, Solano, and Napa, January 2023–January 2025.

Line chart of East Bay single-family home days on market, comparing Alameda and Contra Costa from January 2023 to January 2025.

Line chart comparing monthly days on market for single-family homes in San Mateo, Santa Clara, and Santa Cruz, January 2023–January 2025.

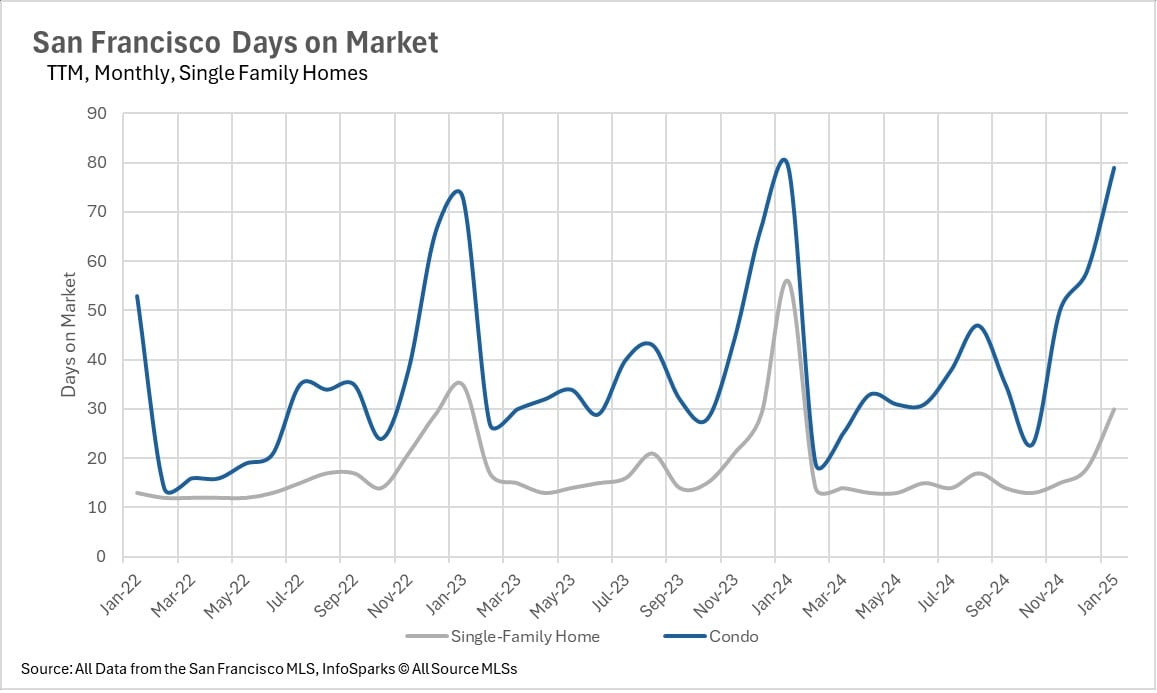
Line chart comparing San Francisco days on market for single-family homes and condos, January 2022–January 2025.

Chart of North Bay condo days on market by county, January 2023 to January 2025; Napa spikes in the final month.

Chart comparing monthly condo days on market in Alameda and Contra Costa, January 2023–January 2025.

Line chart comparing monthly condo days on market in San Mateo, Santa Clara, and Santa Cruz, January 2023–January 2025.

Line chart of monthly North Bay single-family home inventory by county, January 2023–January 2025.

East Bay months-of-supply chart comparing Alameda and Contra Costa single-family homes, January 2023 to January 2025.

Chart comparing monthly single-family home inventory supply in Alameda and Contra Costa, January 2023 to January 2025.

San Francisco months of supply chart, comparing single-family homes and condos from January 2022 to January 2025.

We Would Love to Meet You!

You’ve got questions and we can’t wait to answer them.