The Local Lowdown: February 2025

Michelle Kim  |  February 28, 2025

The Local Lowdown: February 2025

The Local Lowdown

Quick Take:
  • In January, we saw considerable decreases in San Francisco, in terms of both single-family homes and condos.
  • Despite the notable decreases in median sales price in San Francisco, single-family homes are still selling for more than asking price, on average.
  • Active inventory levels are considerably lower than this time last year, despite a healthy amount of supply hitting the market.
Note: You can find the charts/graphs for the Local Lowdown at the end of this section.

The January drop-off

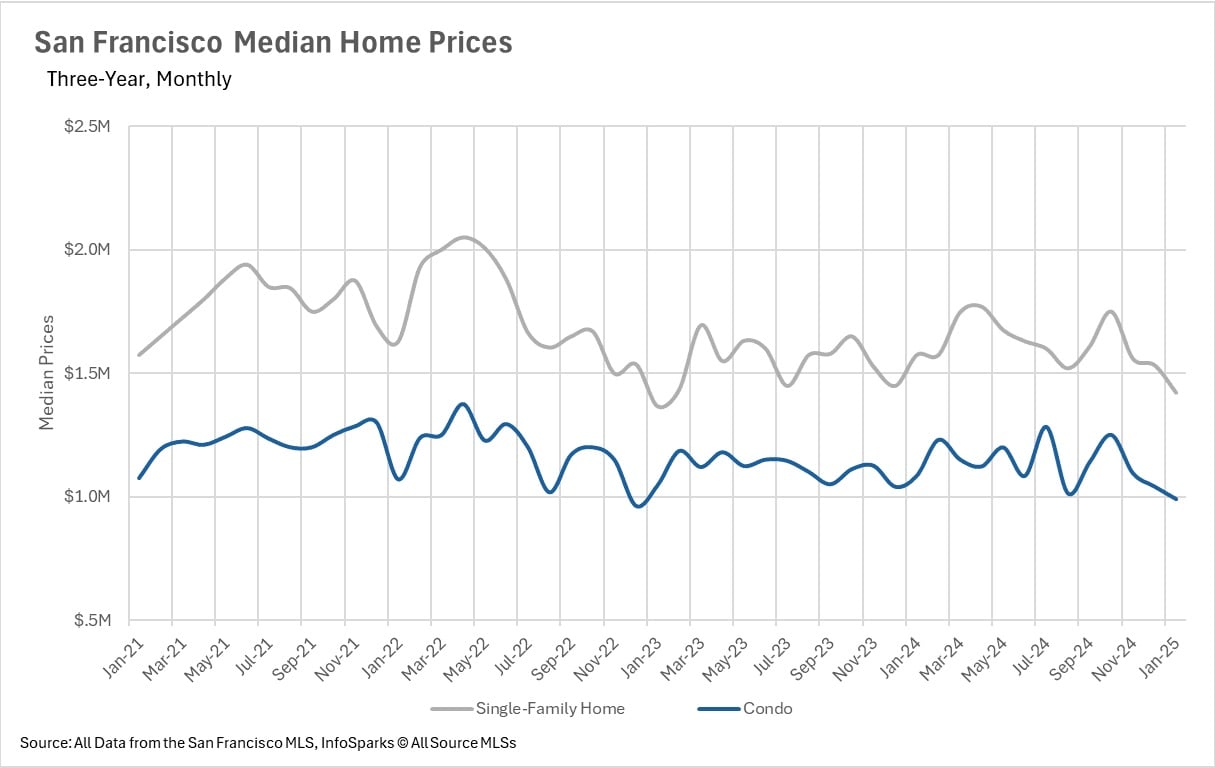
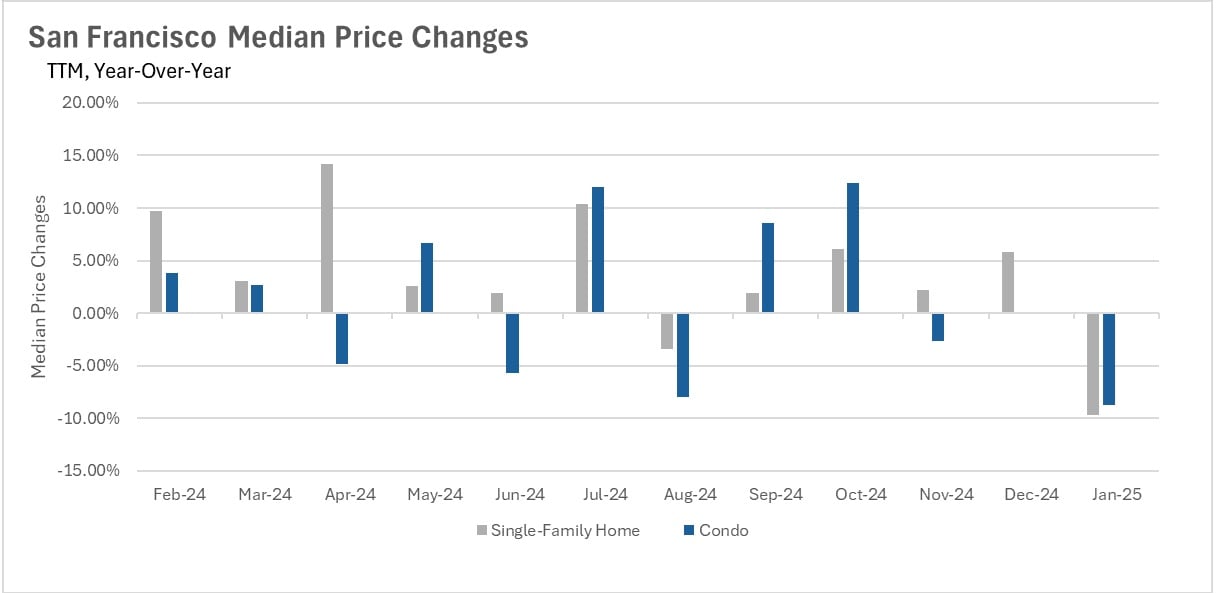
While median sale prices were holding steady throughout the fourth quarter, despite rising interest rates, we saw a considerable fall in the month of January. The median single-family home sale price fell by 9.68% to $1,422,500. Whereas the median condo sale price fell 8.76%, to $990,000. Despite relative strength post-rate cuts in the San Francisco market, prices are starting to tick back down to reflect the increased costs of borrowing.

Single-family homes in San Francisco are still selling for over listing price

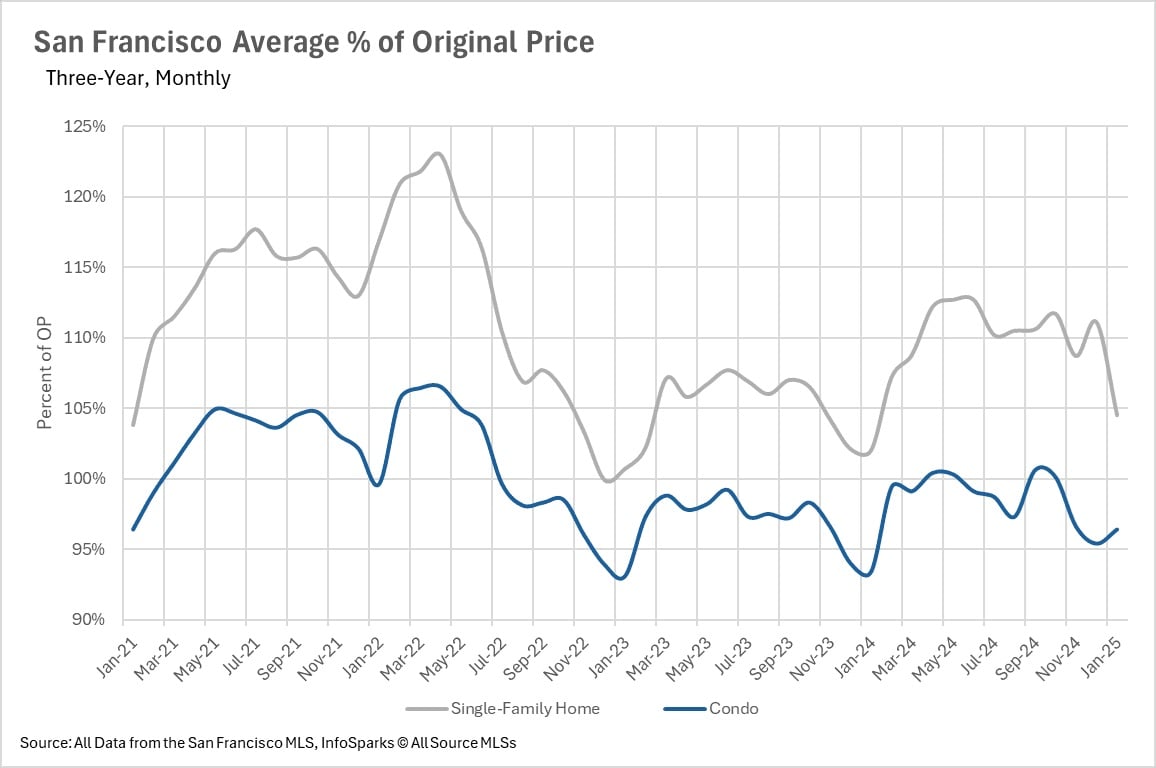
There’s a rather interesting phenomenon happening in San Francisco. If we were to tell you that the median sale price for homes dropped by nearly 10% on a year-over-year basis, you might assume that homes are selling for less than asking. However, that’s not the case in San Francisco. While the median condo is selling for slightly less than asking and fetching roughly 96% of its original price, the median single-family home is still fetching 105% of its original asking price. Despite the fact that prices fell a bit in January, by no means is the San Francisco market weak!

Inventories in San Francisco weren’t just a 2024 problem

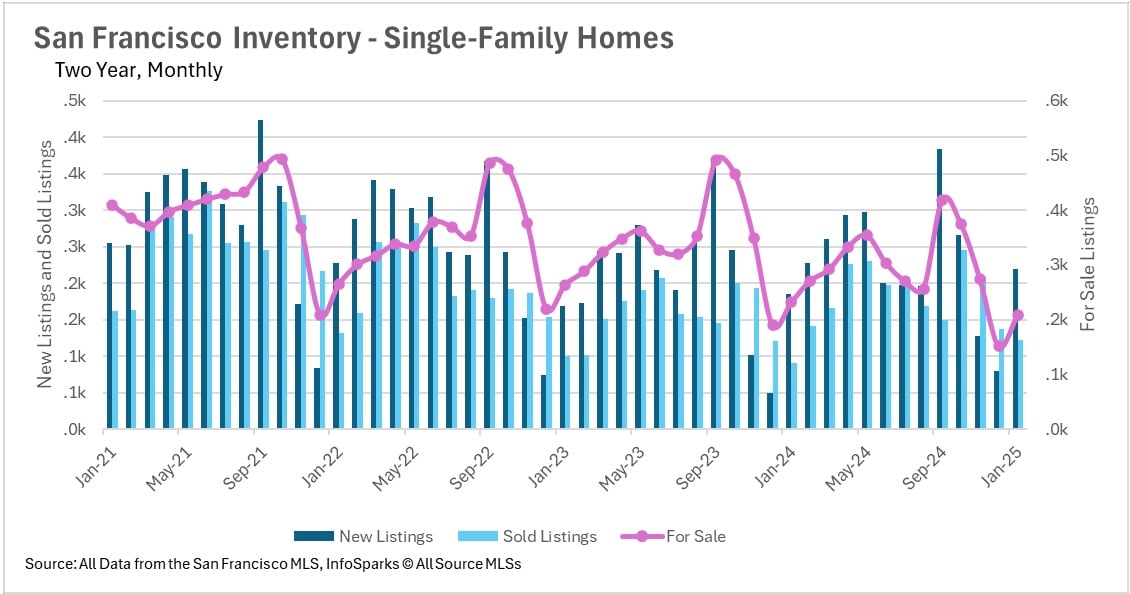
In 2024, active inventory was a huge issue for the San Francisco market. There simply weren’t enough homes on the market to satisfy the overwhelming demand. Unfortunately for buyers (and fortunately for sellers), this issue looks like it will continue to persist in 2025. In the single-family home market in January, we saw 18.38% more new listings, 34.07% more sold listings, and 10.34% fewer active listings on a year-over-year basis.
 
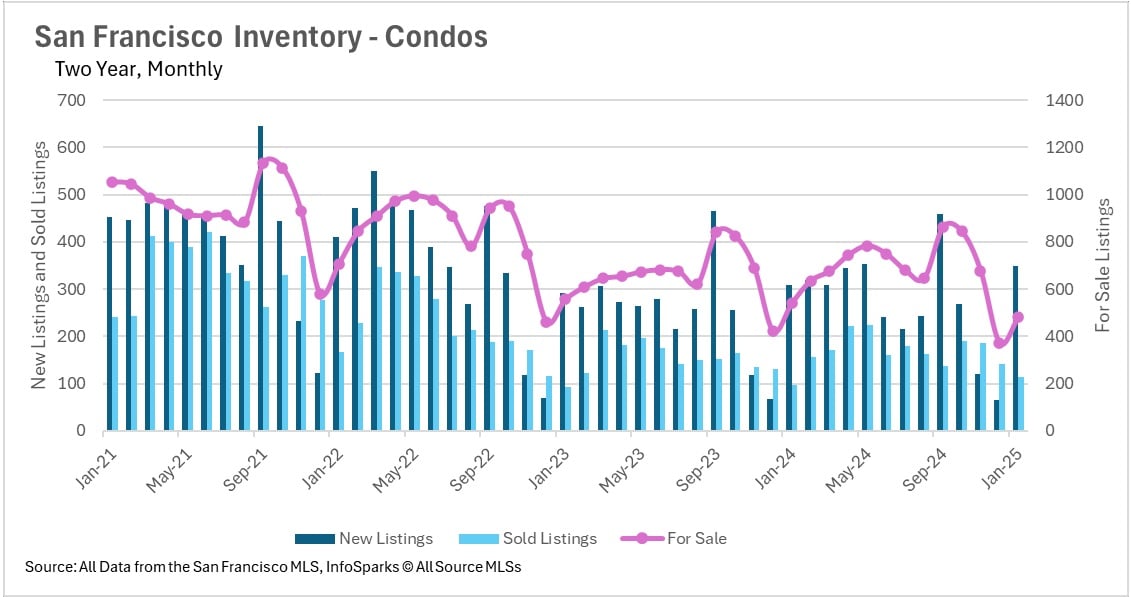
In terms of the condo market, we saw 12.62% more new listings, 17.71% more sold listings, and 10.91% fewer active listings on a year-over-year basis in January. Unfortunately, the downtrend isn’t showing any signs of slowing up, so naturally, we can expect this inventory issue to persist into the foreseeable future!

San Francisco is entirely a sellers’ market

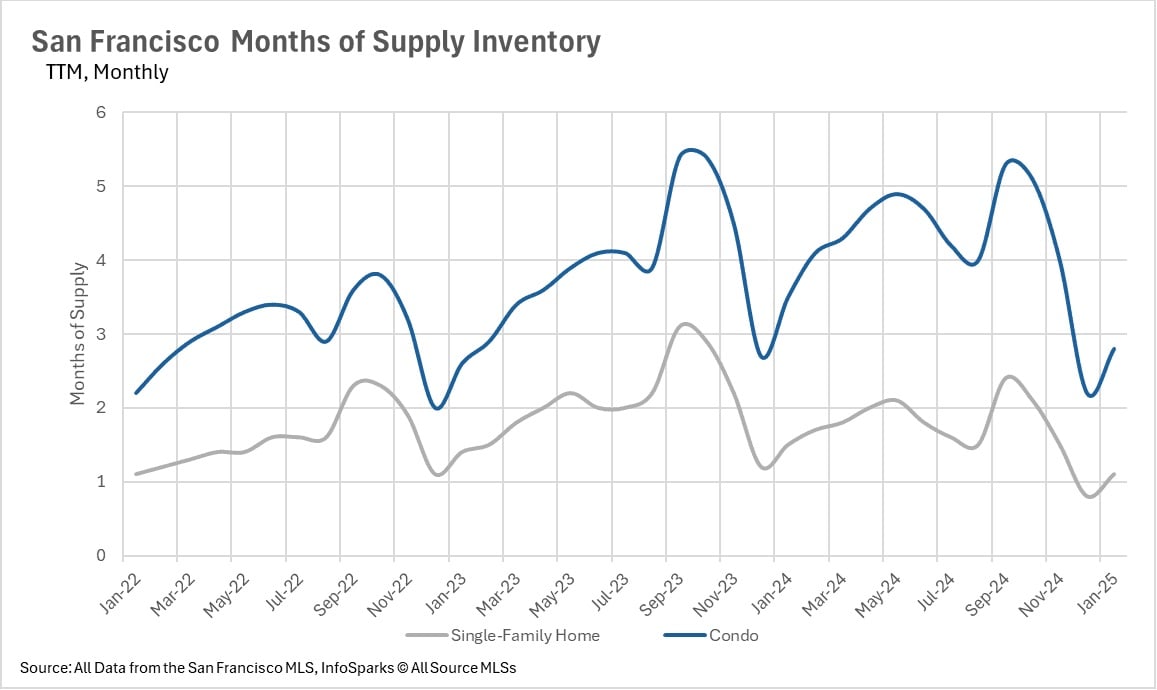
When determining whether a market is a buyers’ market or a sellers’ market, we look to the Months of Supply Inventory (MSI) metric. The state of California has historically averaged around three months of MSI, so any area with at or around three months of MSI is considered a balanced market. Any market that has lower than three months of MSI is considered a sellers’ market, whereas markets with more than three months of MSI are considered buyers’ markets.
 
With just 1.1 months worth of single-family homes and 2.8 months worth of condos available for sale at this point in time, the entire San Francisco market has become a sellers’ market. The slow trickle of supply that we’re seeing simply can’t keep up with the overwhelming demand we’re seeing in the market, making it tough to strike a deal!

Local Lowdown Data

Chart of San Francisco median home prices, comparing single-family homes and condos from 2021 to 2025.

Bar chart comparing San Francisco year-over-year median price changes for single-family homes and condos, February 2024–January 2025.

Line chart comparing San Francisco single-family home and condo prices as a percentage of original price, January 2021–January 2025.

Chart of San Francisco single-family home listings and homes for sale, monthly from January 2021 to January 2025.

Chart of San Francisco condo listings from 2021 to January 2025, with new listings, sold listings, and inventory for sale.

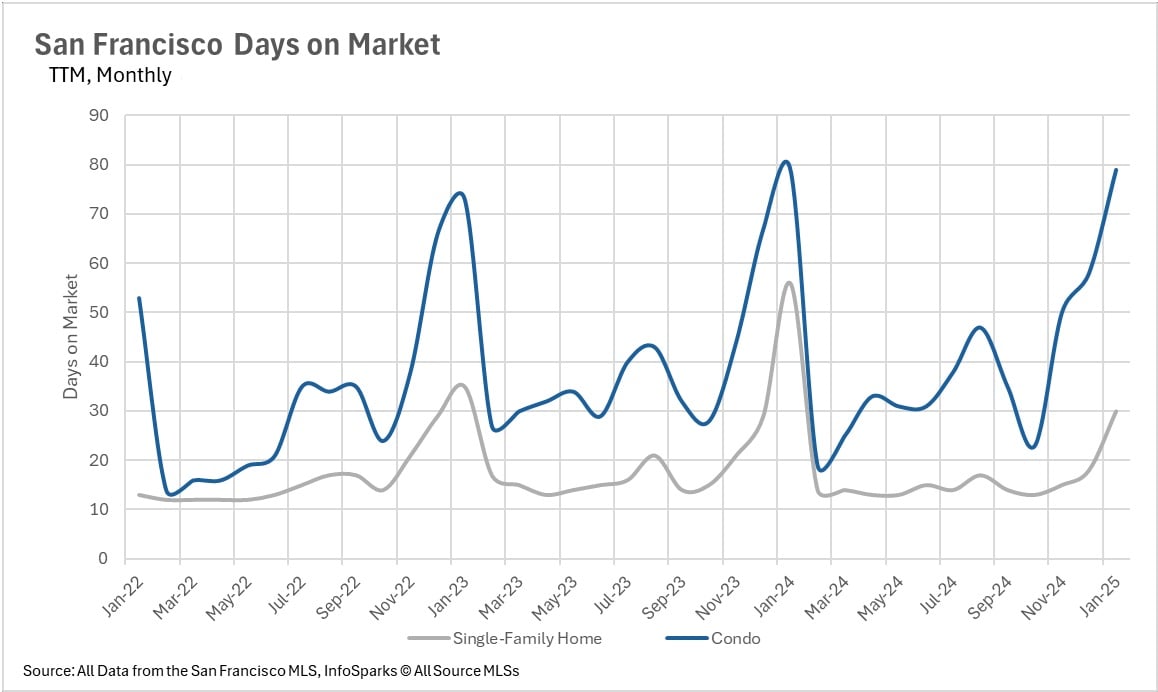
San Francisco days-on-market chart comparing single-family homes and condos from January 2022 to January 2025.

San Francisco months of supply chart comparing single-family homes and condos, January 2022 to January 2025.

We Would Love to Meet You!

You’ve got questions and we can’t wait to answer them.