The Local Lowdown: April 2025

Michelle Kim  |  May 1, 2025
The Local Lowdown: April 2025

The Local Lowdown

Quick Take:
  • Median sale prices throughout the North Bay have remained fairly strong, with little deviation from their long-term averages.
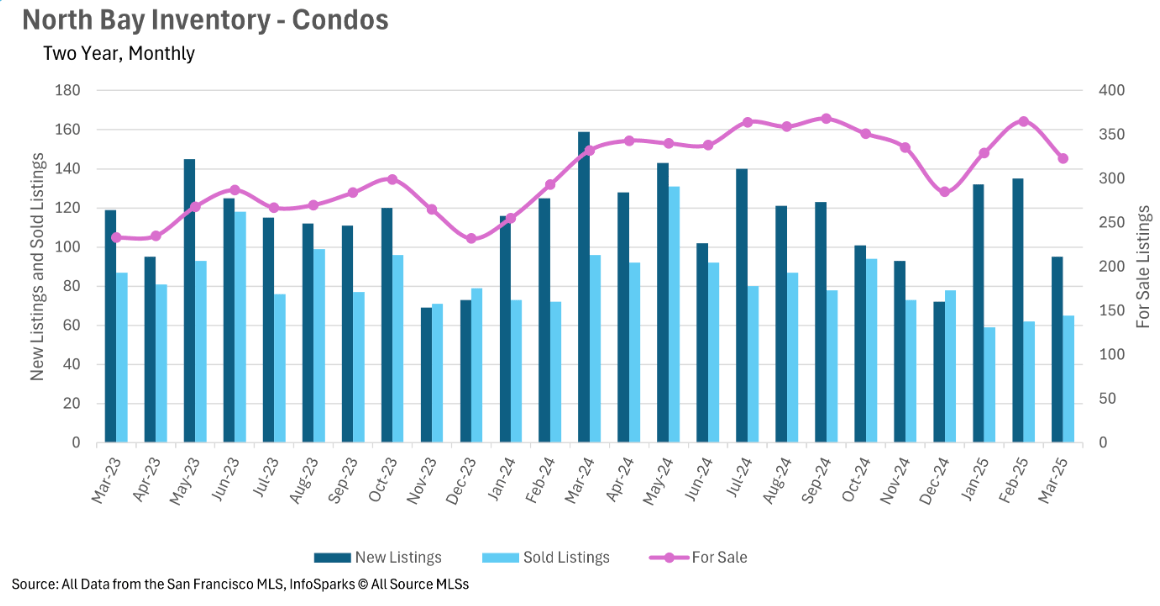
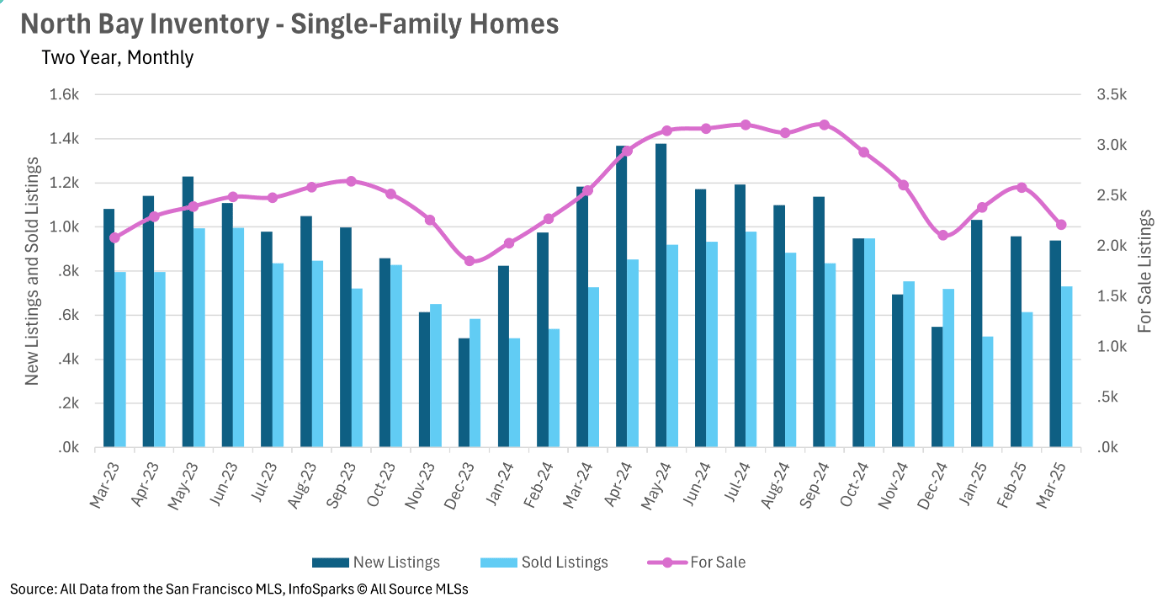
  • Inventory has fallen by a considerable margin, as the number of homes remains stagnant and the number of new listings drops.
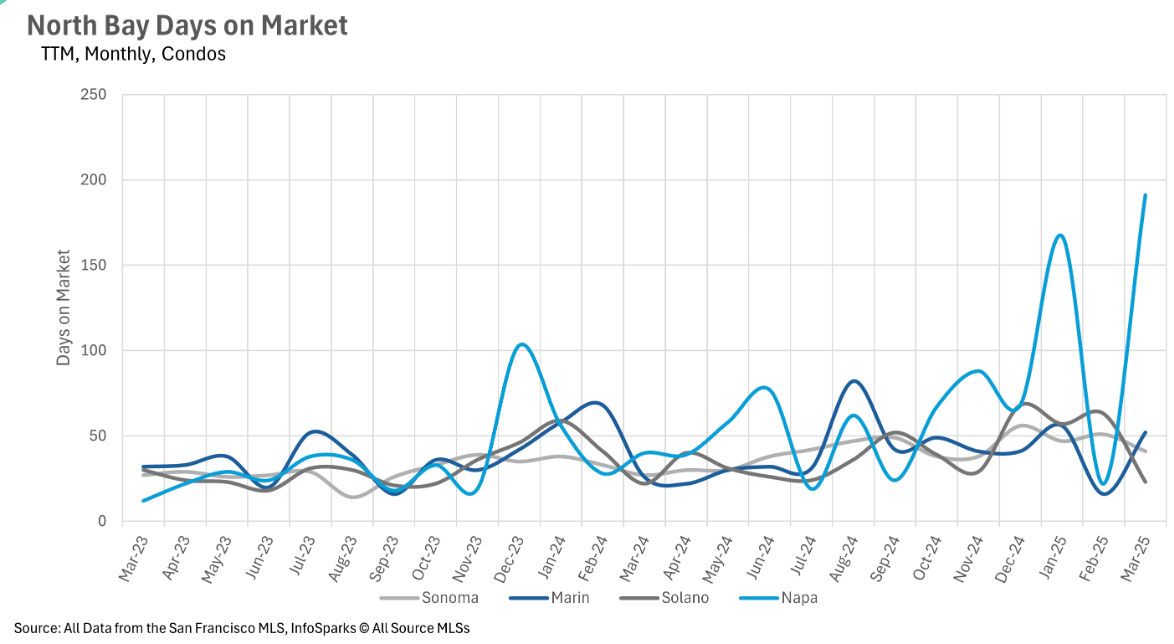
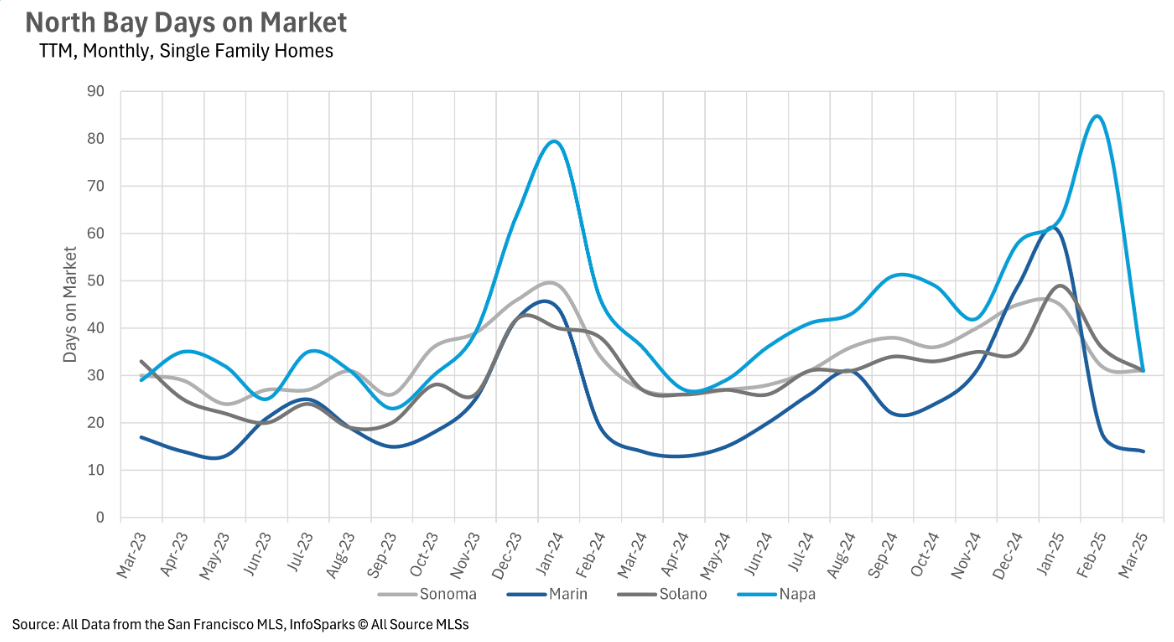
  • Despite the drop in inventory, homes are sitting on the market for longer, with homes in Solano and Sonoma counties sitting on the market for roughly 15% longer than they did last year.
Note: You can find the charts/graphs for the Local Lowdown at the end of this section.
 

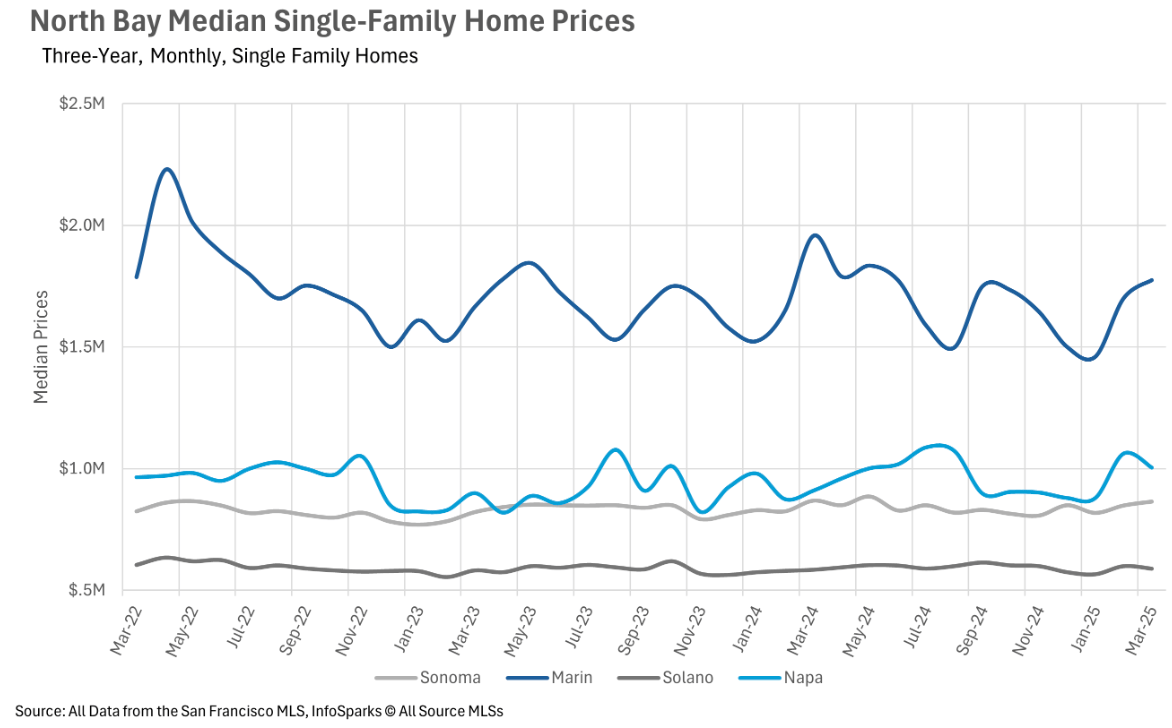
Median sale prices remain strong in the North Bay

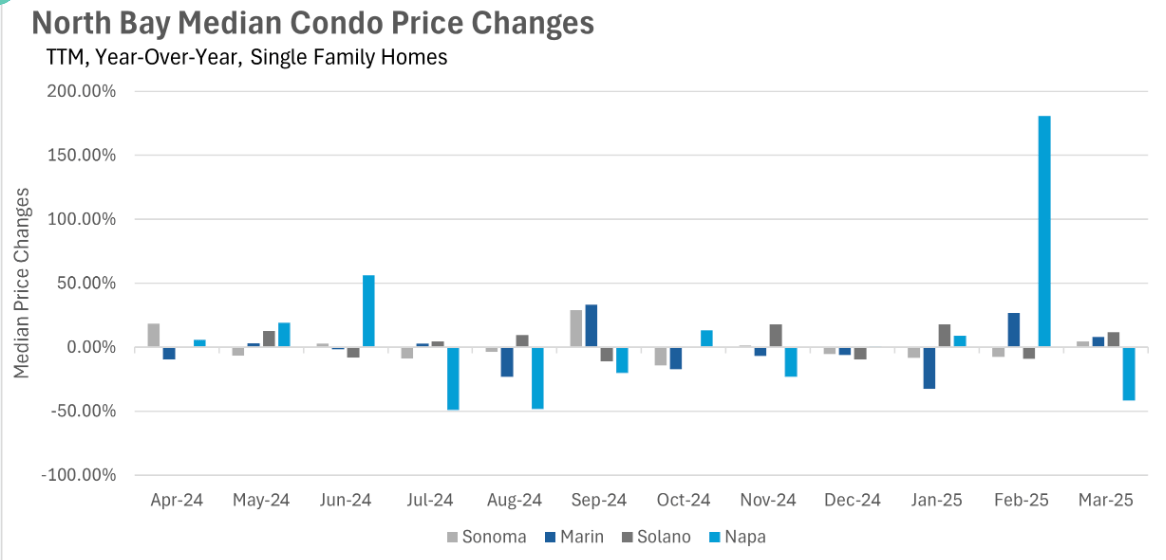
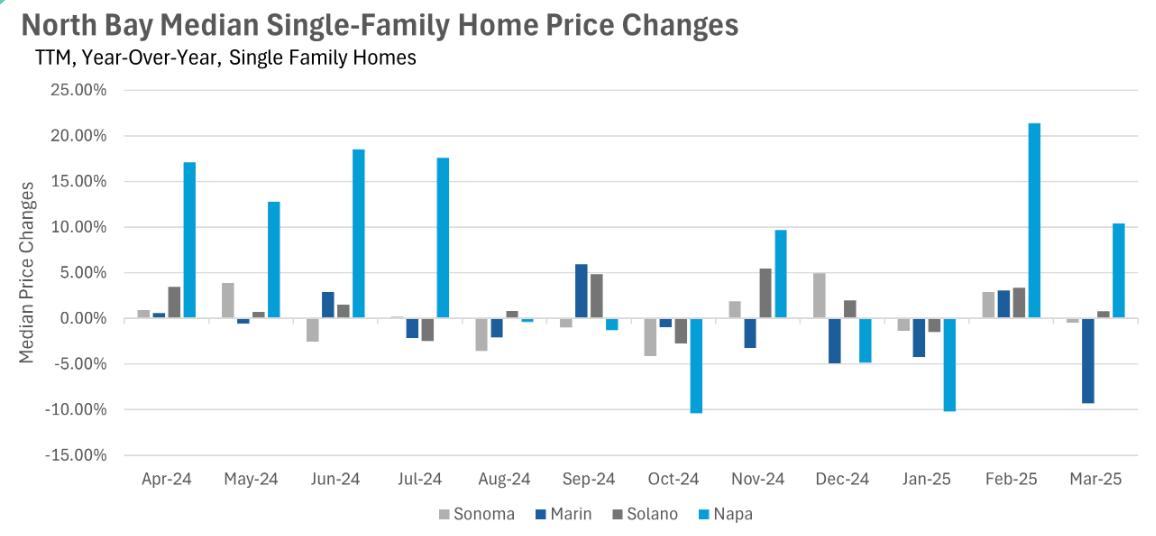
Although there was quite a bit of uncertainty coming into 2025, so far things have been going pretty well in the North Bay. Median sale prices have remained fairly static so far this year, which is great news for sellers! In the month of March, median sale prices in Sonoma and Solano counties were roughly flat, whereas Marin County saw a 9.32% year-over-year decrease, and Napa County saw a 10.40% increase! However, we might see prices begin to increase throughout the North Bay, as inventory might become an issue over the course of the next few months!
 

Inventory looks like it will continue to be an issue

As many of us know, in the real estate market, inventories tend to build throughout the first quarter, when there are fewer buyers in the market looking for a new home. This, of course, means that the month of March is typically a month where we see inventory build. However, this month we saw a month-over-month decrease of 14.28%! Additionally, we saw the number of new listings hitting the market drop by a considerable margin, as there were 20.78% fewer new listings in March 2025 than there were in March 2024. If we don’t see some new listings start to hit the market soon, we could start to see more bidding wars, as buyers fight for a limited supply of homes, resulting in an increase in the median sale price!
 

Despite falling inventories, homes aren’t selling any faster

If you were to hear that inventories are falling, while demand remains steady, you might assume that homes are selling faster. However, this isn’t the case in the North Bay. Despite lower inventory levels and fewer new listings, we saw the median home in Sonoma and Solano counties spend roughly 15% more time on the market than this time last year, and the median listing in Marin County spend the exact same amount of time on the market. However, in Napa County, homes are moving around 14% faster than they were around this time last year!
 

Sellers in Sonoma Marin, and Solano Counties gain bargaining power, while buyers retain the bargaining power in Napa County

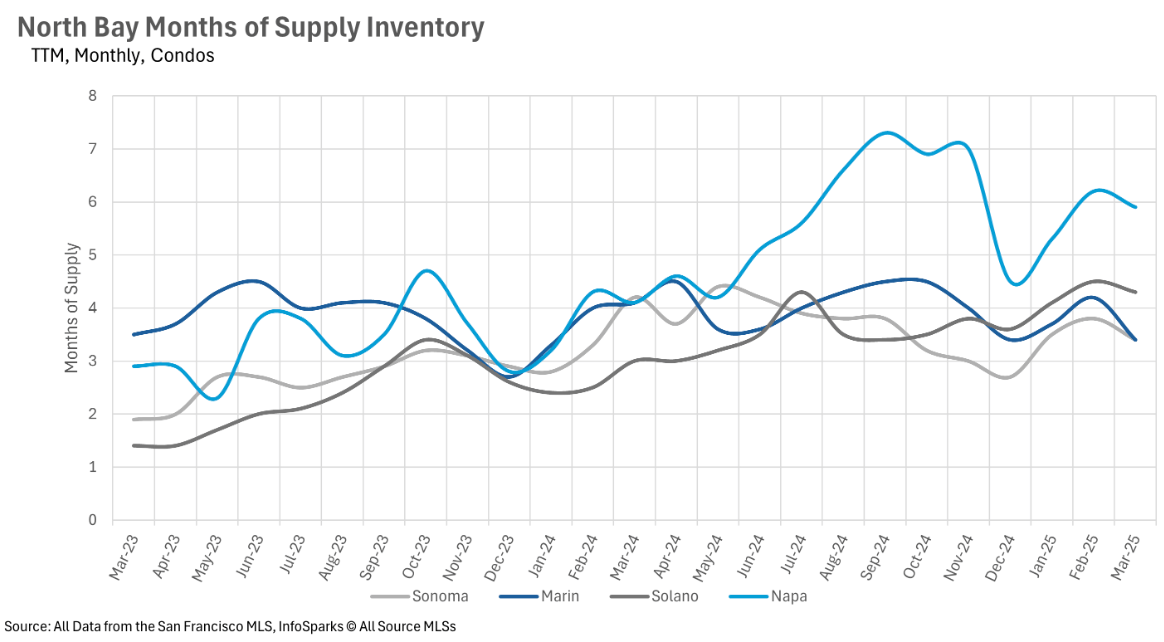
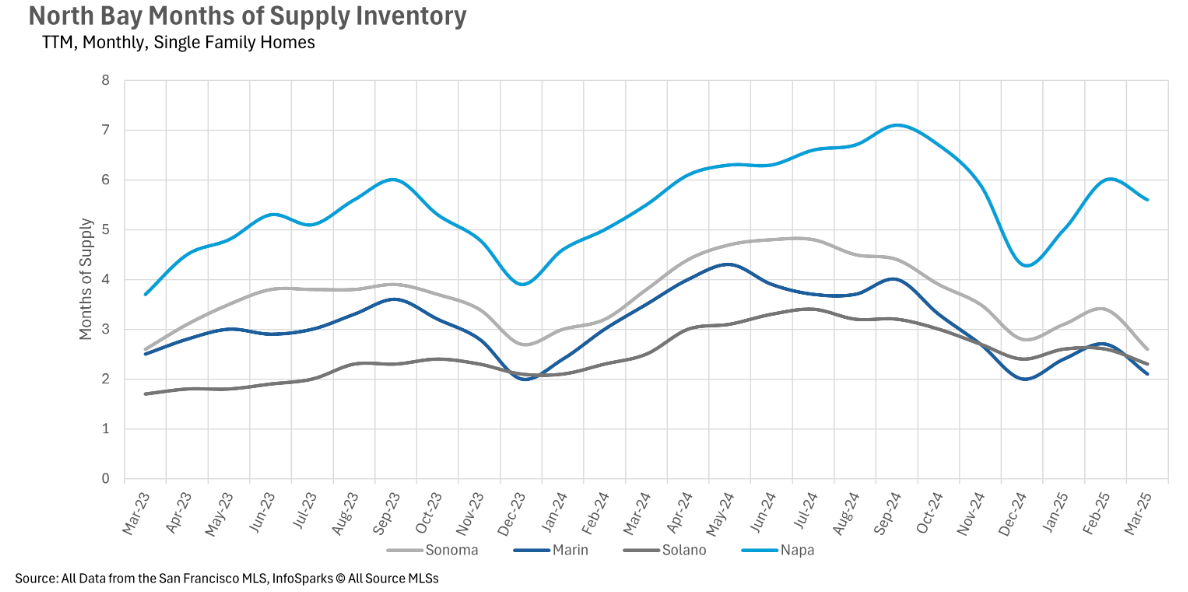
The real estate market in California has historically averaged around three months' worth of inventory on the market at a given time. This means that whenever inventory levels drop below three months' worth of supply, an area is in a seller’s market. On the flip side, if inventory levels are above three months' worth of supply, an area is in a buyers’ market.
 
As inventories shrink throughout the North Bay, it’s no surprise that sellers are gaining back some of the bargaining power that they lost over the course of the past couple of months. At this point in time, there’s around 2.6 months’ worth of supply on the market in Sonoma County, 2.1 months in Marin County, and 2.3 months in Solano County. However, Napa County remains a buyers’ market, with roughly 5.6 months worth of inventory listed on the market right now!
 

Local Lowdown Data

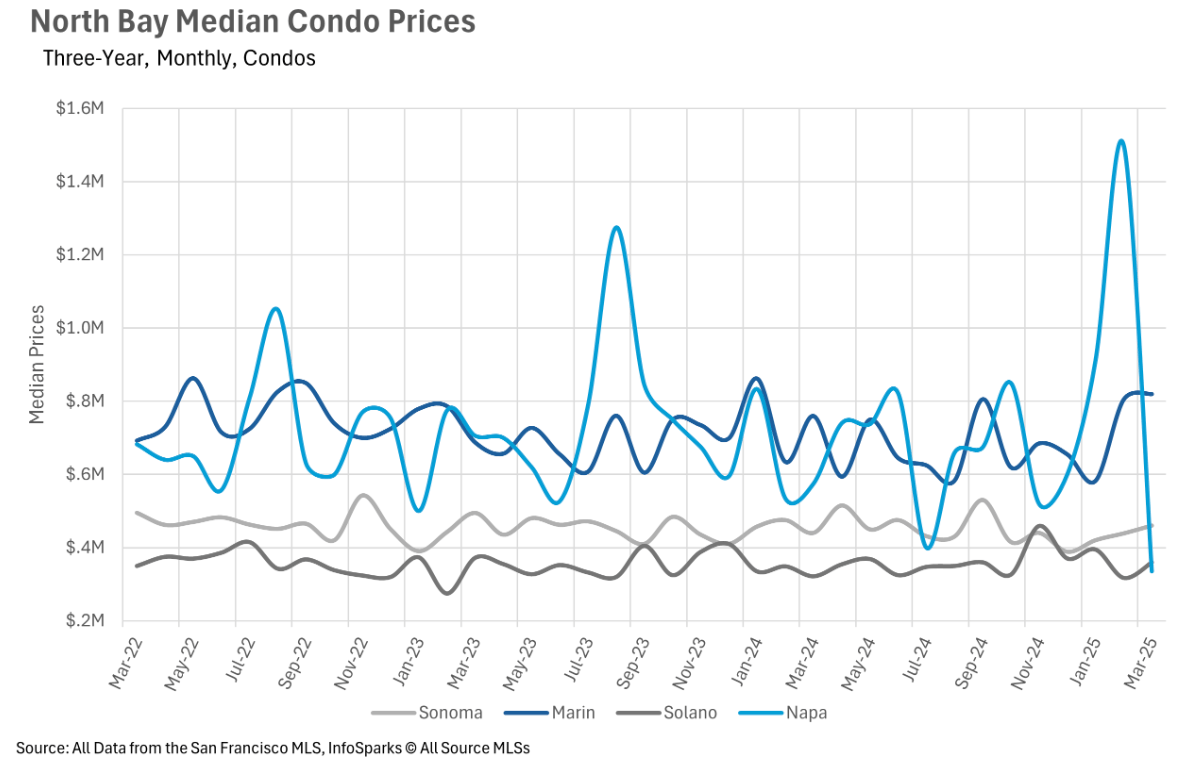
Line chart comparing monthly condo days on market across Sonoma, Marin, Solano, and Napa, March 2023 to March 2025.Line chart comparing monthly days on market for single-family homes in Sonoma, Marin, Solano, and Napa, March 2023–March 2025.North Bay condo listings chart comparing monthly new, sold, and for-sale listings from March 2023 to March 2025.Chart of North Bay single-family listings, sales, and homes for sale from March 2023 to March 2025.Bar chart comparing year-over-year median price changes across four North Bay counties, April 2024 to March 2025.Line chart of monthly North Bay median condo prices, March 2022–March 2025, for Sonoma, Marin, Solano, and Napa.Bar chart of year-over-year North Bay single-family home price changes by county, April 2024 to March 2025.North Bay monthly median single-family home prices by county, May 2022–March 2025; Marin is highest.Line chart comparing monthly condo supply in Sonoma, Marin, Solano, and Napa counties, March 2023–March 2025.Line chart of North Bay single-family home supply by county, March 2023–March 2025; Napa remains highest.

We Would Love to Meet You!

You’ve got questions and we can’t wait to answer them.