The Local Lowdown: April 2025
Michelle Kim | May 1, 2025
Michelle Kim | May 1, 2025
Stay up to date on the latest real estate trends.

Michelle Kim | May 1, 2026
A closer look at San Francisco housing market trends in 2026 and what buyers and sellers should expect moving forward.

Michelle Kim | May 1, 2026
Quick Take: Median home sale prices ticked up slightly on both a month-over-month and year-over-year basis in February, continuing the holding pattern we've seen in re… Read more

Michelle Kim | May 1, 2026
Quick Take: Median sale prices rebounded in Sonoma County with a 1.16% year-over-year gain, while Napa County continued to struggle with a 10.61% decline. Inventory re… Read more
Michelle Kim | May 1, 2026
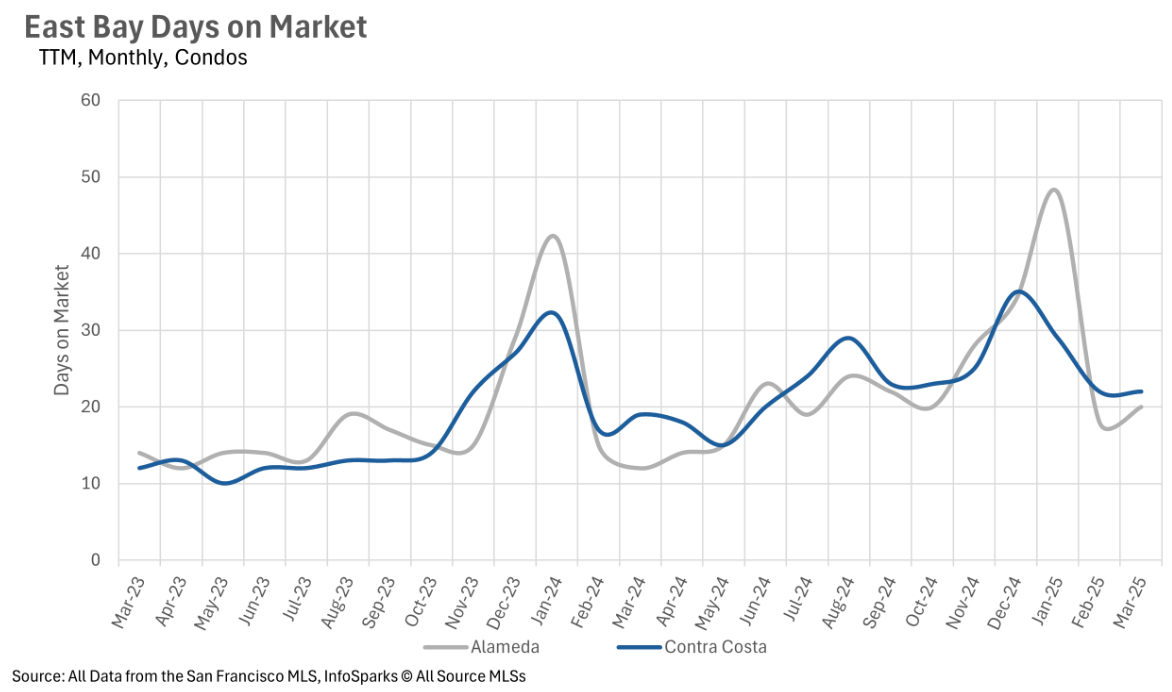
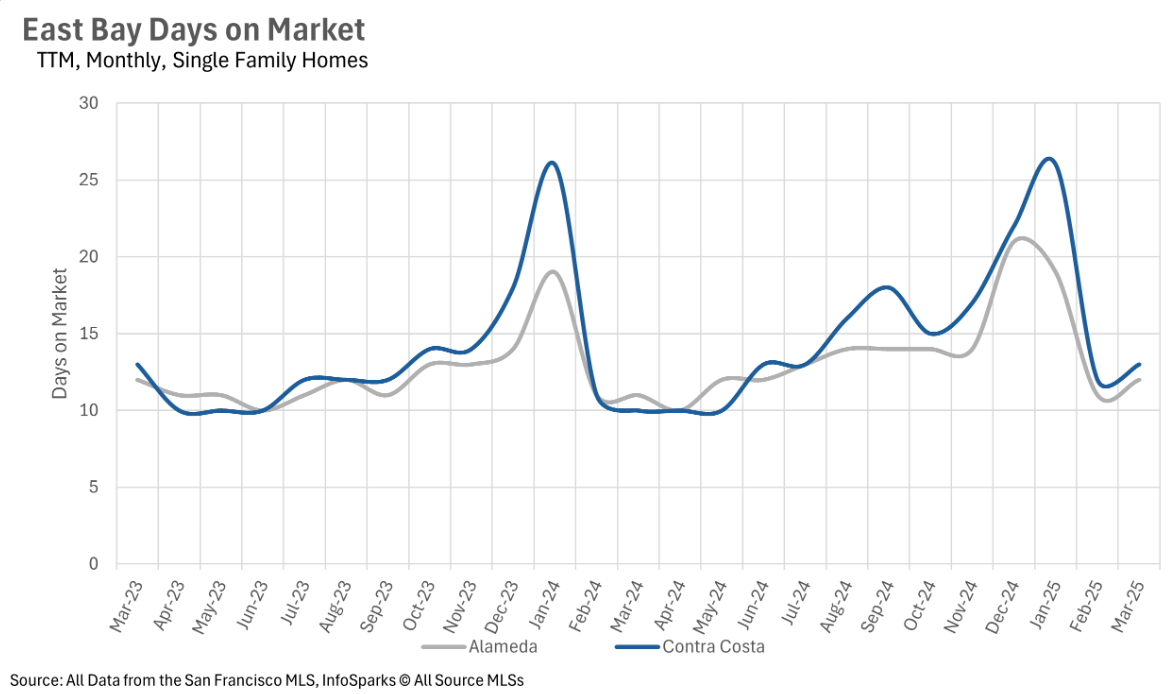
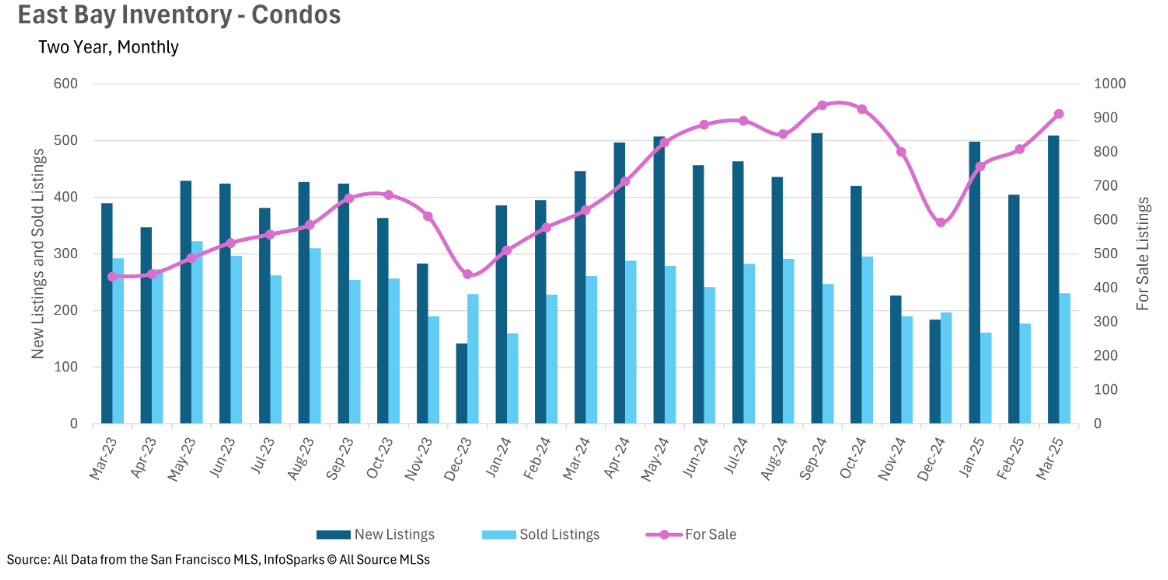
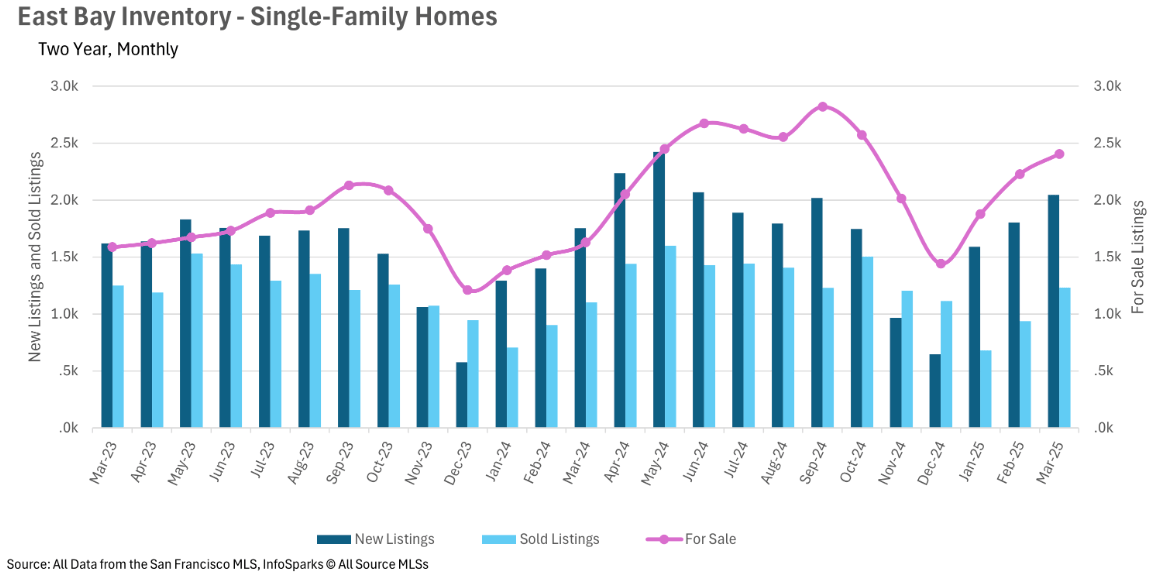
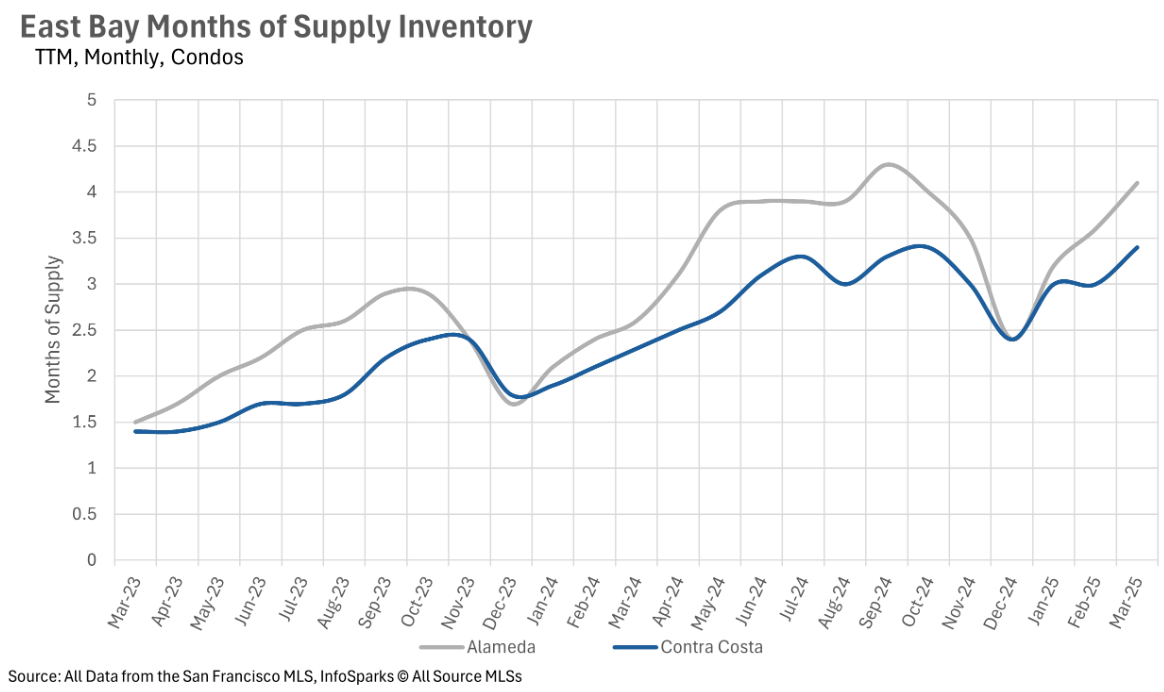
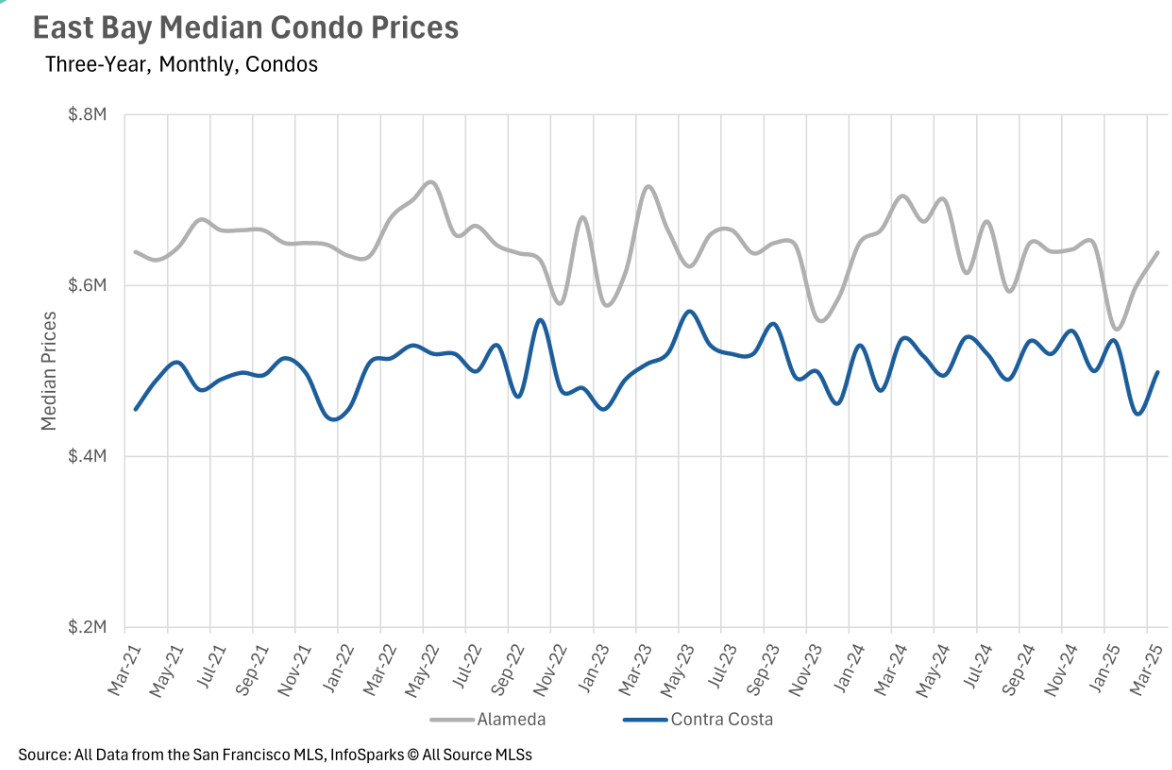
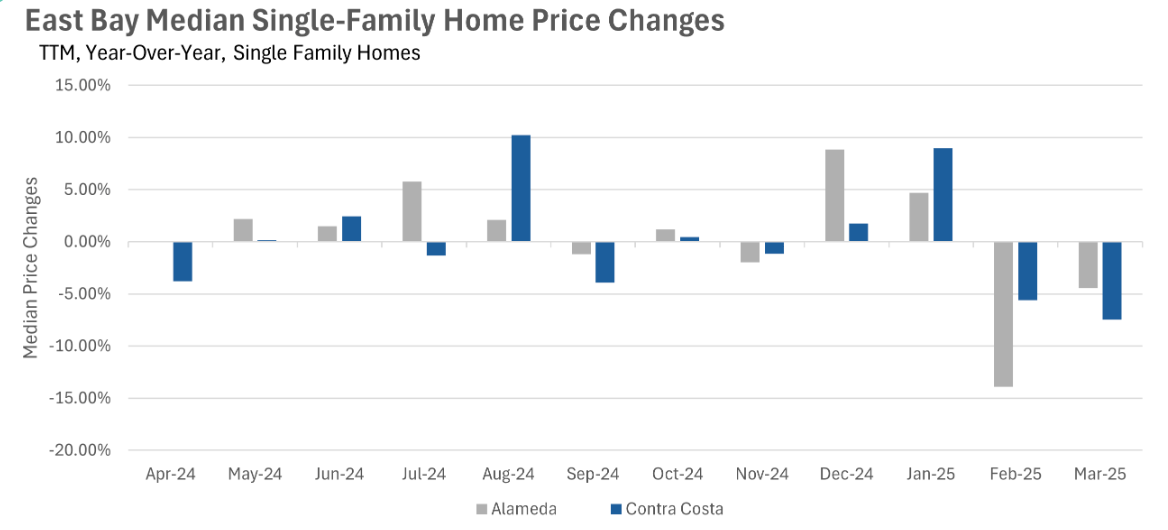
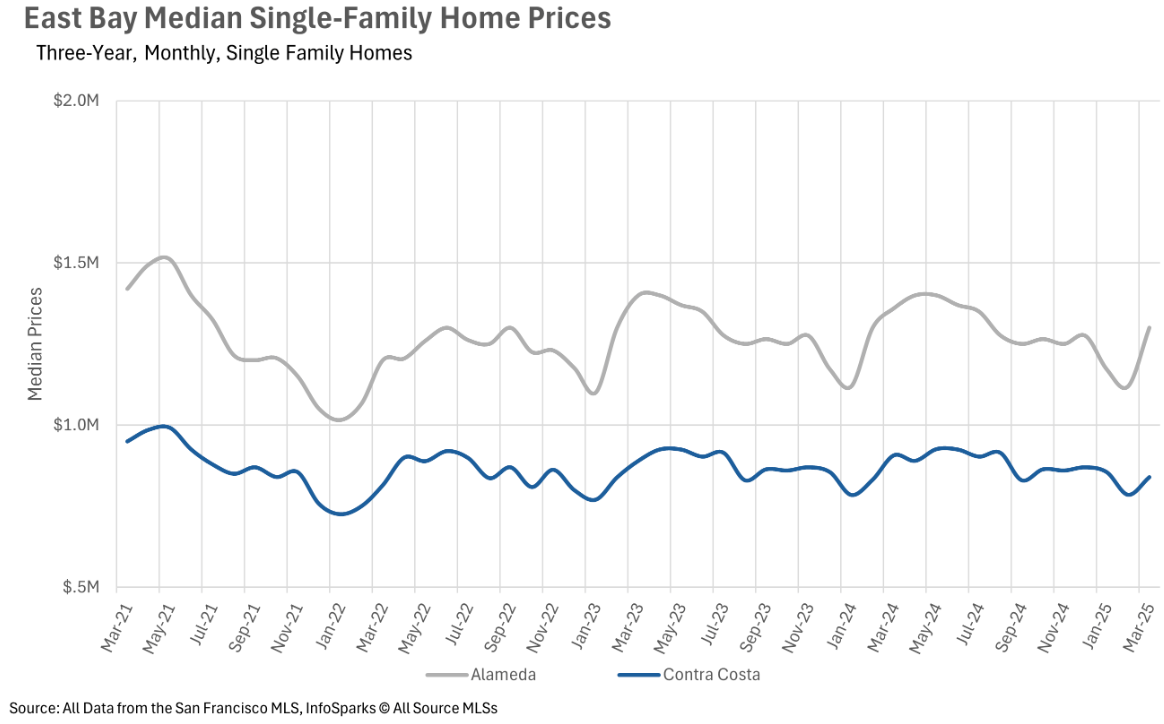
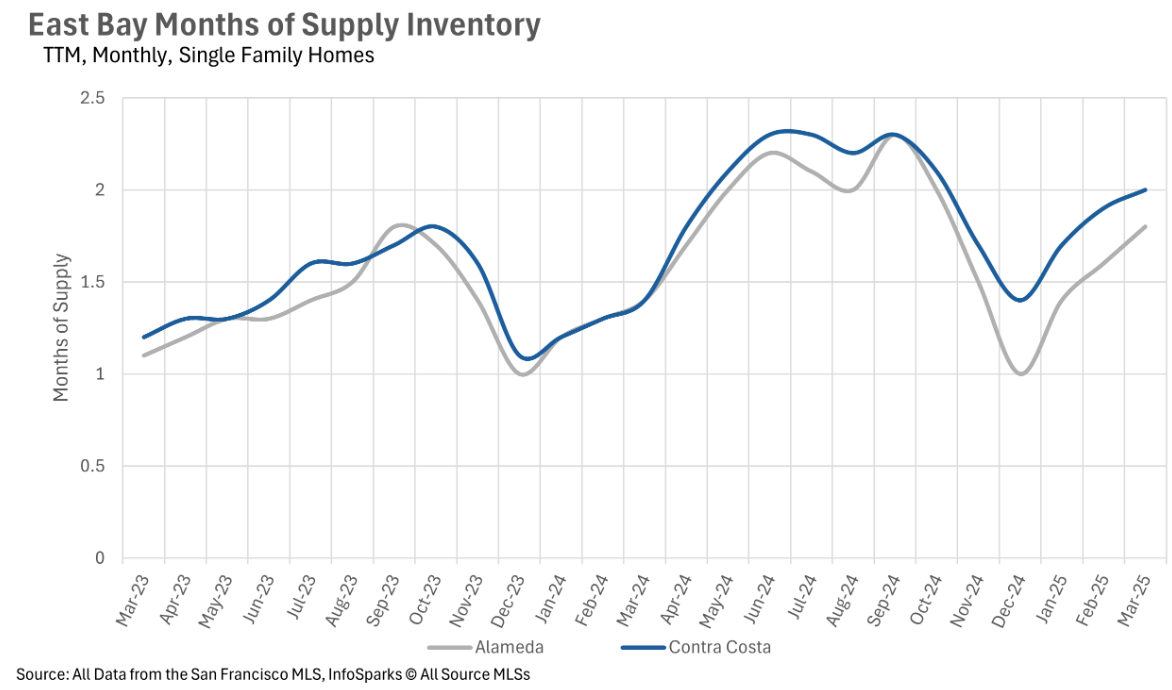
Quick Take: Single-family home prices remain stable in Alameda County while the condo market continues to face headwinds with double-digit year-over-year declines. Inv… Read more

Michelle Kim | May 1, 2026
Quick Take: Single-family median sale prices showed a mixed picture in March, with San Mateo County posting solid gains while Santa Clara and Santa Cruz Counties saw y… Read more

Michelle Kim | May 1, 2026
Quick Take: Median sale prices are soaring in San Francisco, with condos up more than 27% and single-family homes up more than 18% year-over-year. Inventory levels rem… Read more
You’ve got questions and we can’t wait to answer them.