The Local Lowdown: June 2025

Michelle Kim  |  July 1, 2025

The Local Lowdown: June 2025

The Local Lowdown

Quick Take:
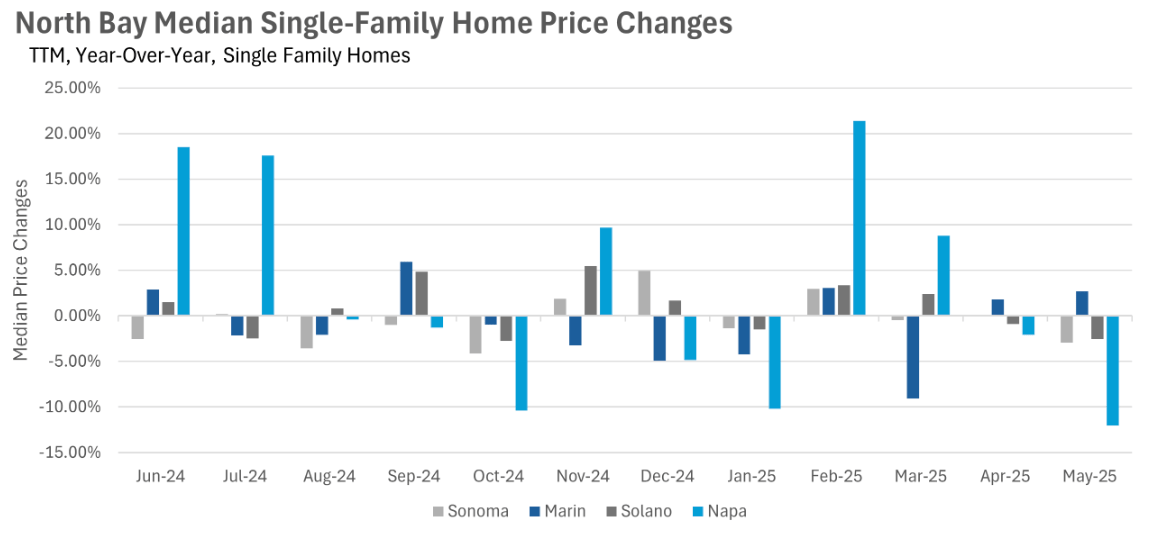
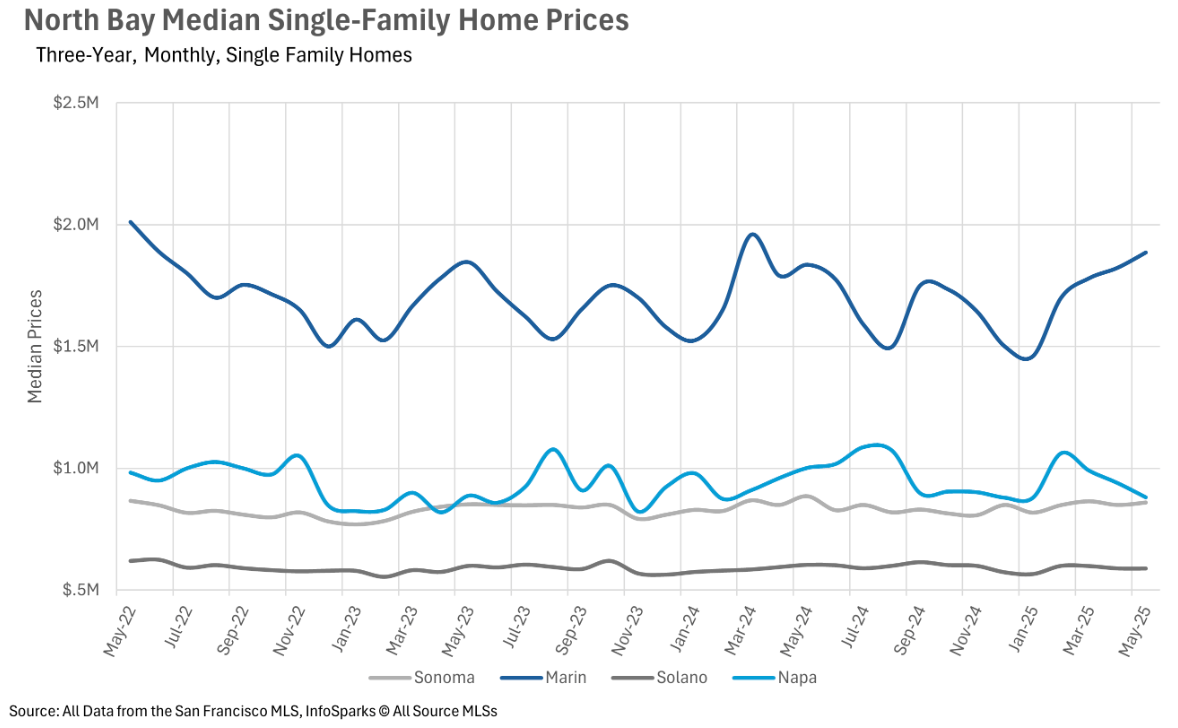
  • Median sale prices continue to decline throughout most of the North Bay, with the exception of Marin County.
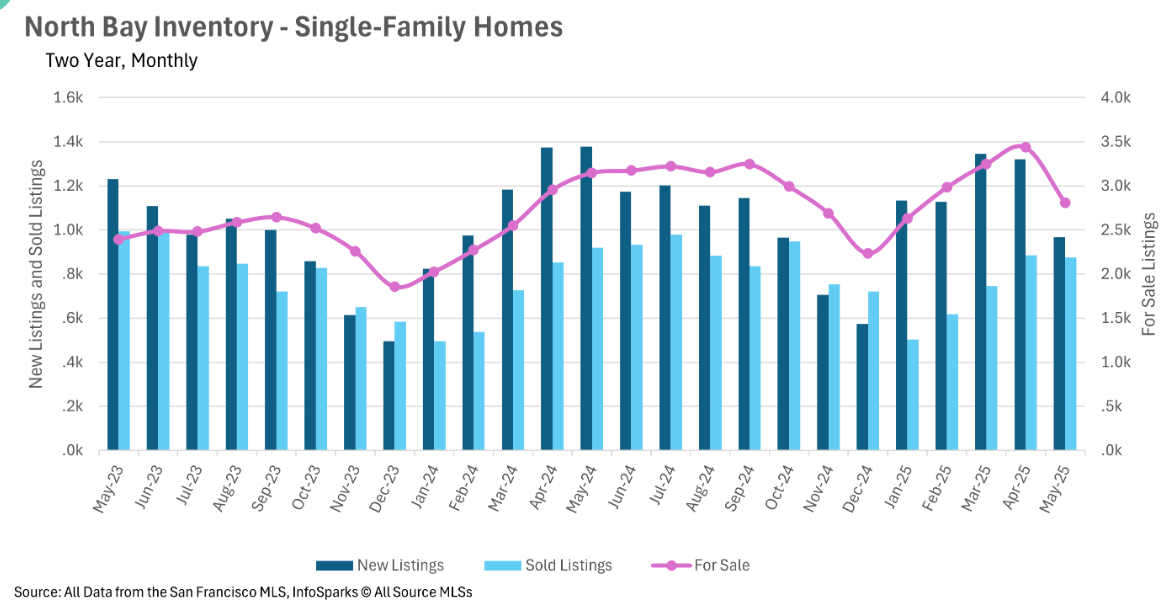
  • We saw a steep decline in the amount of inventory on the market, with total for-sale single-family home listings dropping by 10.74%, compared to May 2024.
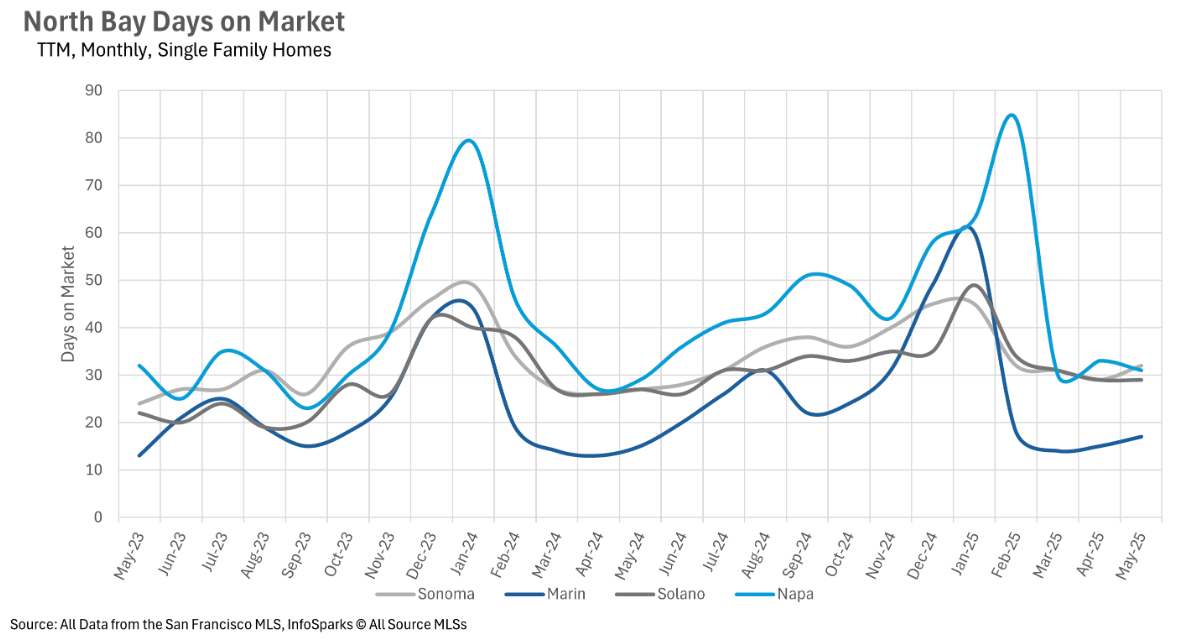
  • Despite this drop in inventory, listings are still staying on the market for slightly longer than they were last year.


Median sale prices decline throughout most of the North Bay

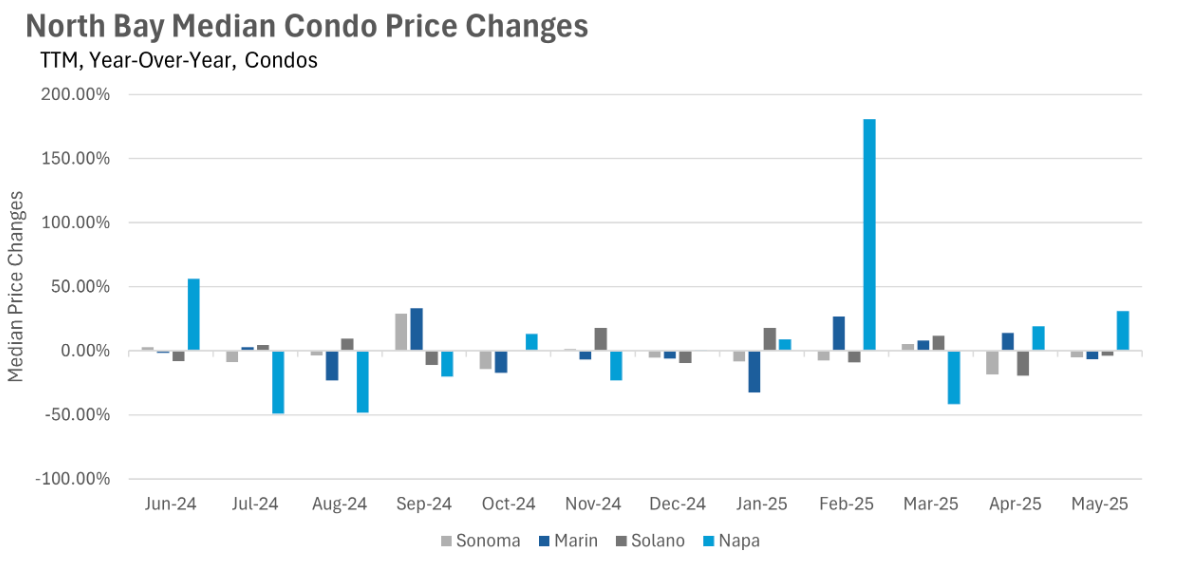
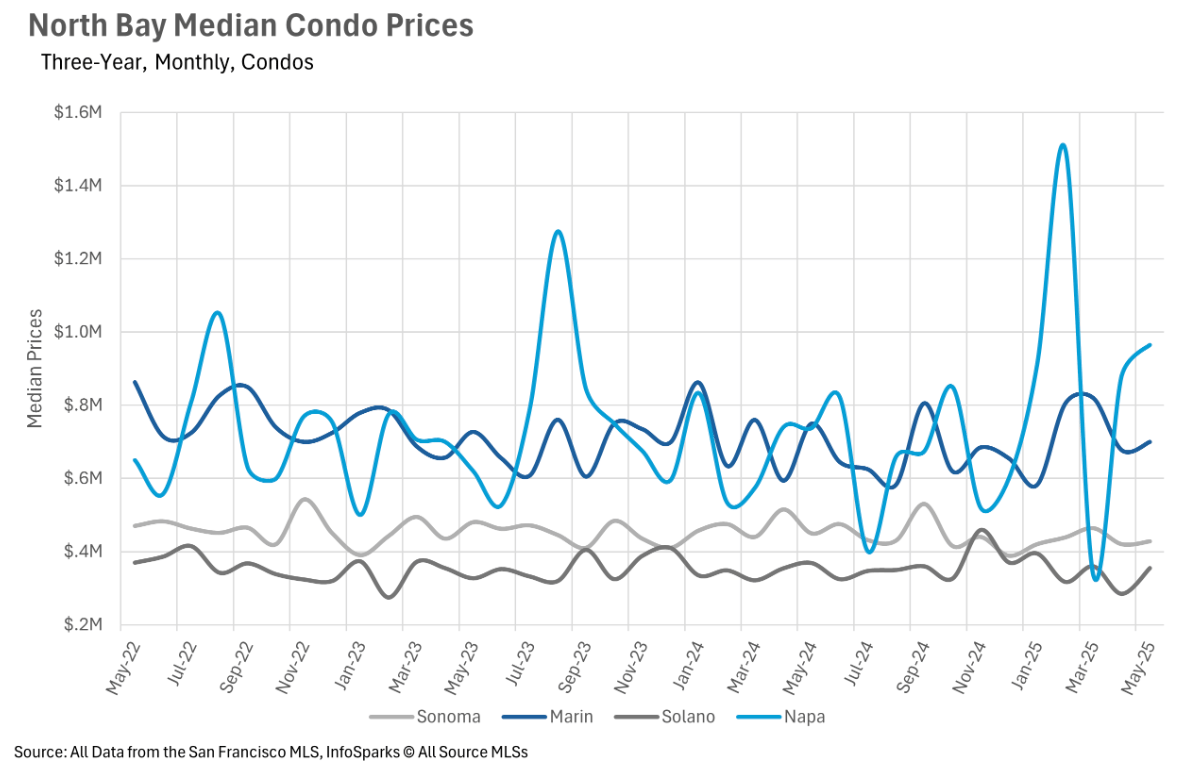
Last month, we saw the median sale price of single-family homes drop throughout most of the North Bay. While Marin County was the only area that saw an increase (2.72%), Napa County sale prices took a huge hit, declining by 12.03% when compared to this time last year. Solano and Sonoma counties saw more modest declines in median sale prices, with values dropping by 2.93% and 2.52%, respectively. Median sale prices in the condo market also fell during the month of May, with Sonoma, Marin, and Solano counties seeing 2.84%, 6.67%, and 3.79% declines on a year-over-year basis.
 

North Bay inventories see a sharp decline

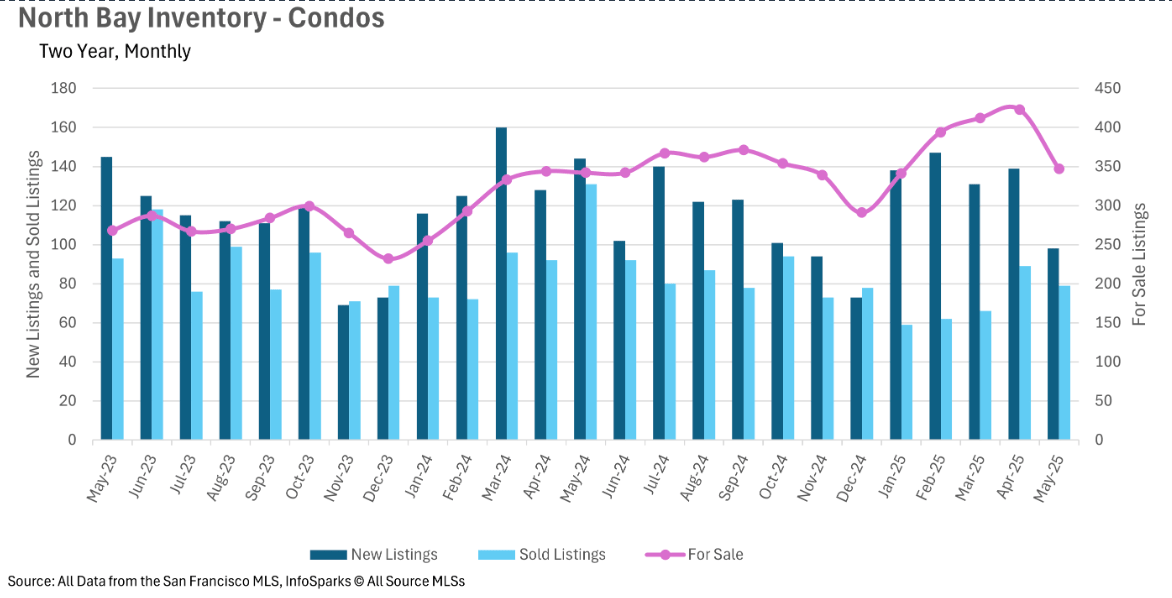
Last month, we saw a marked decrease in the amount of available inventory on the market. The number of active single-family home listings decreased by 10.74% on a year-over-year basis. However, the number of condo listings increased slightly, by just 1.46%. Although we saw an increase in the number of condos, there's less total inventory on the market right now than around this time last year. This can largely be attributed to the fact that there are fewer listings hitting the market, with new condo and single-family home listings decreasing by roughly 30% on a year-over-year basis. We also saw 4.89% fewer single-family homes sold in the month of May when compared to last year.
 

Listings are spending more and more time on the market

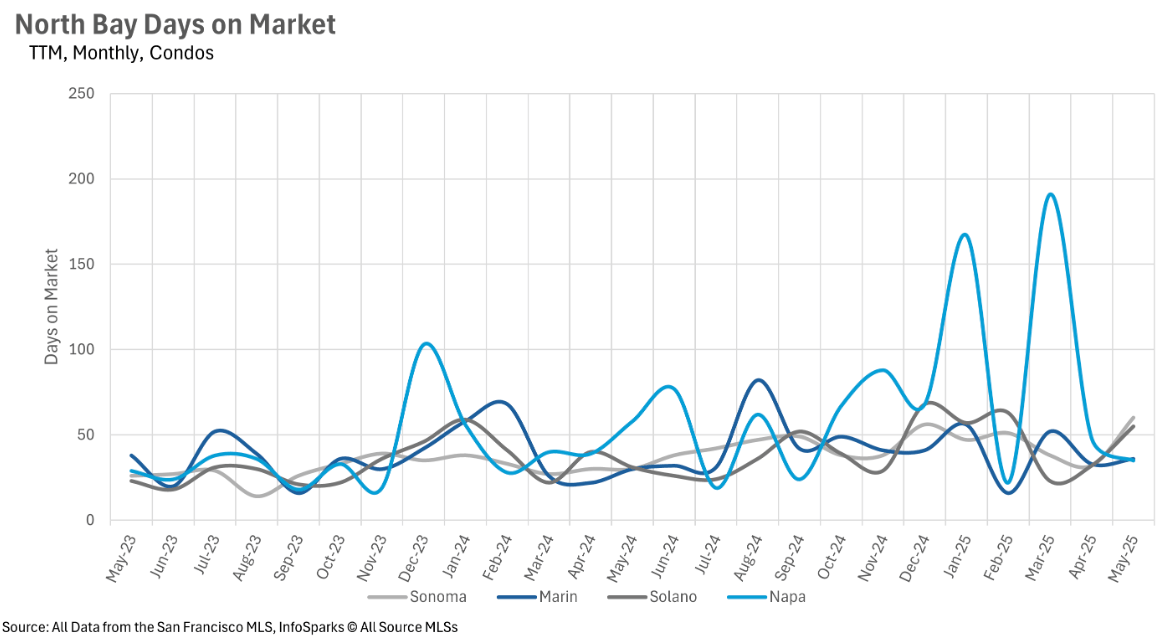
Yet again, we saw the average amount of time a listing is spending on the market tick up. On a year-over-year basis, single-family homes are spending 5 more days on the market in Sonoma County, and 2 more days on the market in Marin, Solano, and Napa Counties. Although we saw a sharp decrease in the amount of available inventory, listings still seem to be sitting on the market, which is an interesting phenomenon. However, if the inventory issues that we’re seeing now happen to persist, don’t be surprised if we start to see listings getting bought up a bit faster!
 

Solano County is the only seller’s market left standing

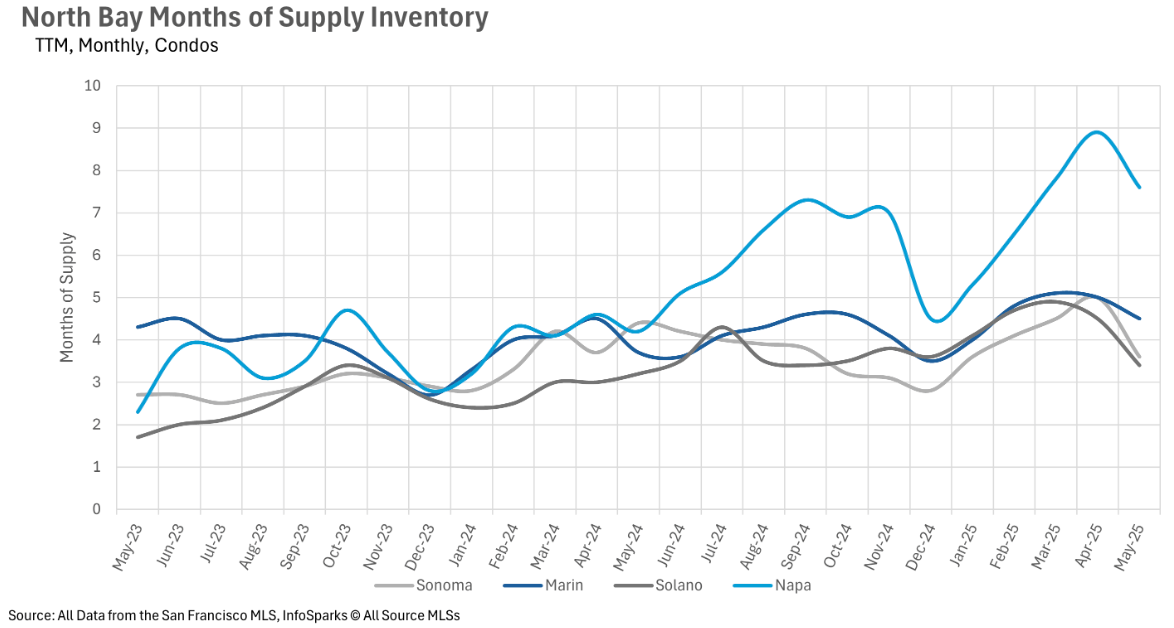
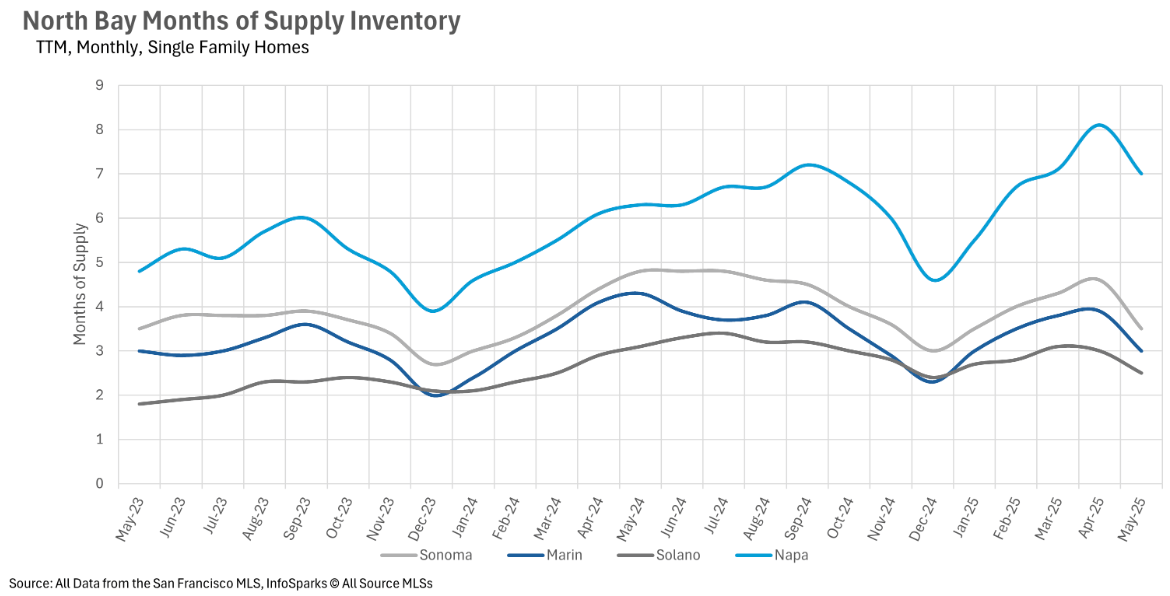
When determining whether a market is a buyers’ market or a sellers’ market, we look to the Months of Supply Inventory (MSI) metric. The state of California has historically averaged around three months of MSI, so any area with at or around three months of MSI is considered a balanced market. Any market that has lower than three months of MSI is considered a sellers’ market, whereas markets with more than three months of MSI are considered buyers’ markets.
 
With 2.5 months’ worth of inventory on the market, Solano County is the only area that’s still a sellers’ market within the North Bay. Marin is quite balanced, with exactly 3 months of inventory on the market. On the other hand, Sonoma and Napa Counties are buyers markets, with 3.5 and 7 months of supply on the market, respectively. Napa County in particular may present some particularly interesting buying opportunities for those who are in the market for a new home in that area!
 

Local Lowdown Data

Line chart of North Bay condo days on market by county, May 2023–May 2025; Napa has sharp peaks in early 2025.Line chart comparing monthly days on market for single-family homes in Sonoma, Marin, Solano, and Napa, May 2023–May 2025.North Bay condo inventory chart comparing monthly new listings, sold listings, and for-sale listings, May 2023–May 2025.Chart of North Bay single-family home listings and inventory, monthly from May 2023 to May 2025.Bar chart of year-over-year median condo price changes across North Bay counties, June 2024–May 2025.Line chart of monthly median condo prices in four North Bay counties from May 2022 to May 2025.Chart of monthly year-over-year North Bay single-family home price changes by county, June 2024 to May 2025.Line chart of North Bay single-family home prices by county, May 2022–May 2025; Marin is highest, Solano lowest.Line chart of North Bay condo inventory from May 2023 to May 2025; Napa peaks near nine months in April 2025.Chart of North Bay months of supply, comparing Sonoma, Marin, Solano, and Napa from May 2023 to May 2025.

We Would Love to Meet You!

You’ve got questions and we can’t wait to answer them.