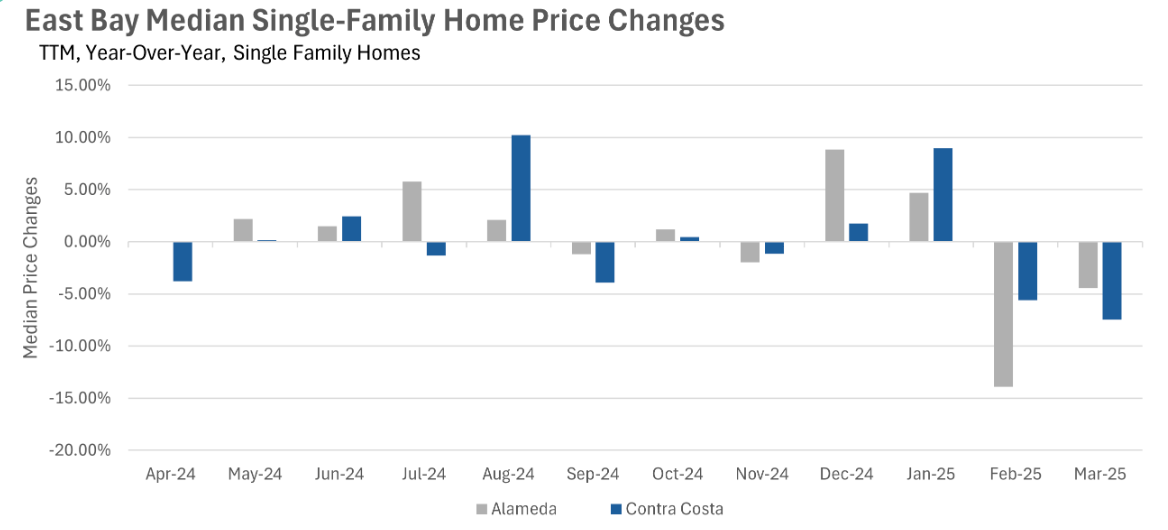
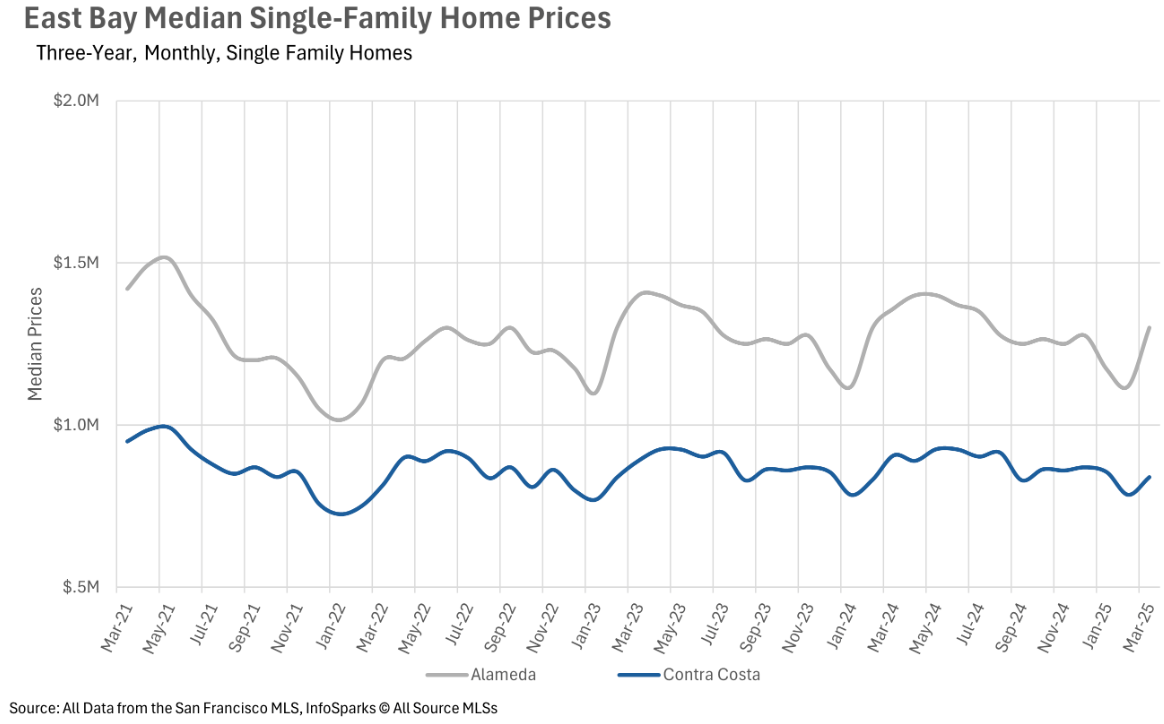
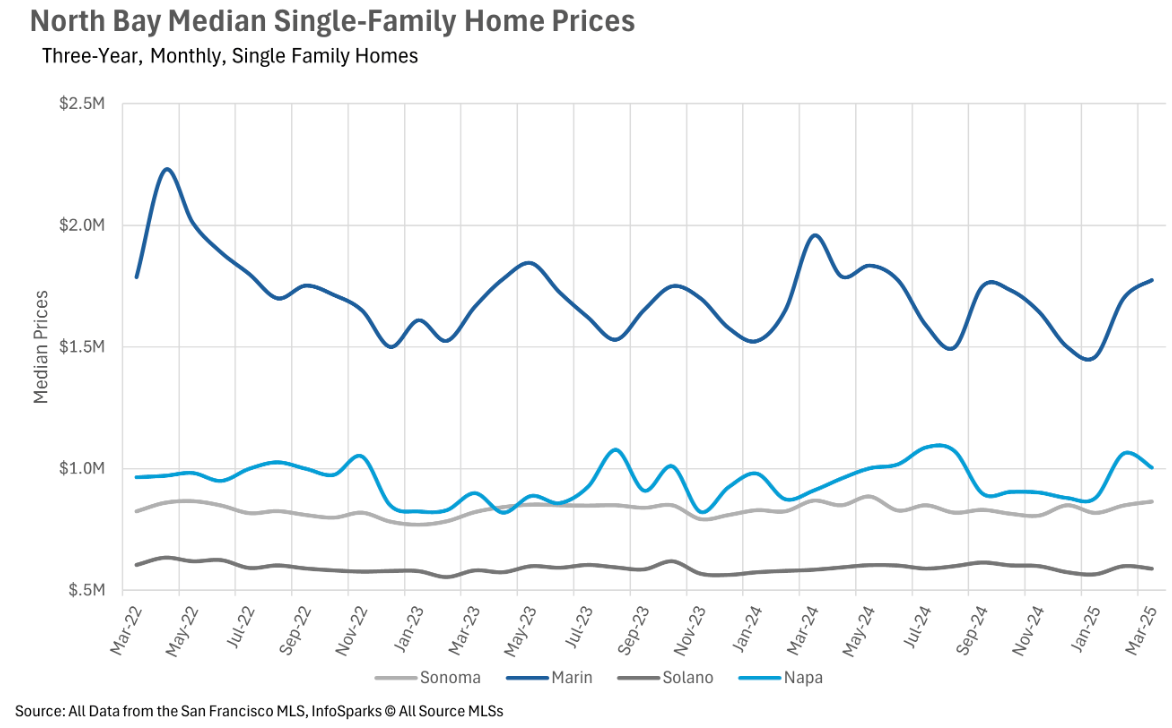
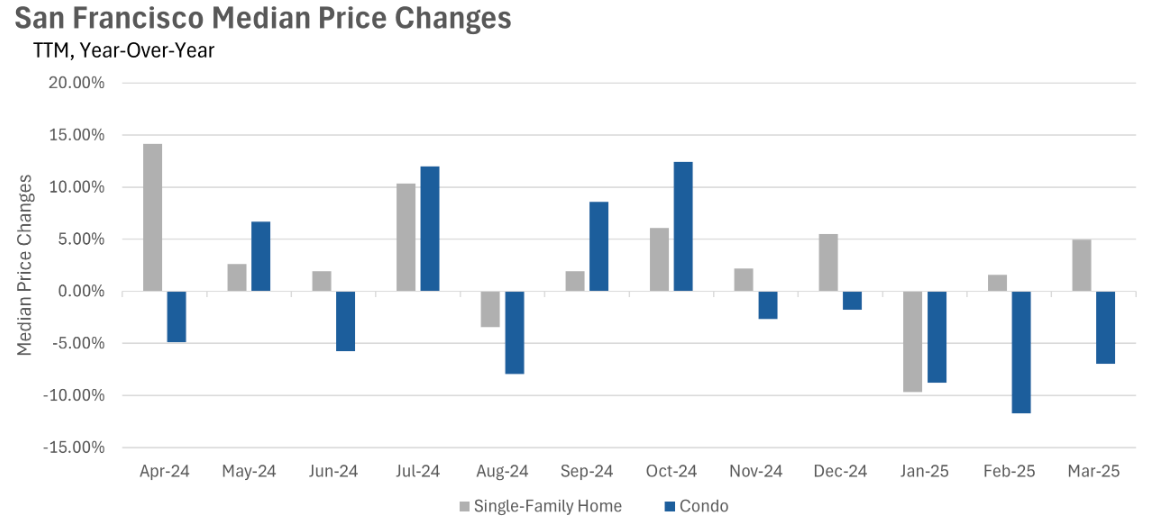
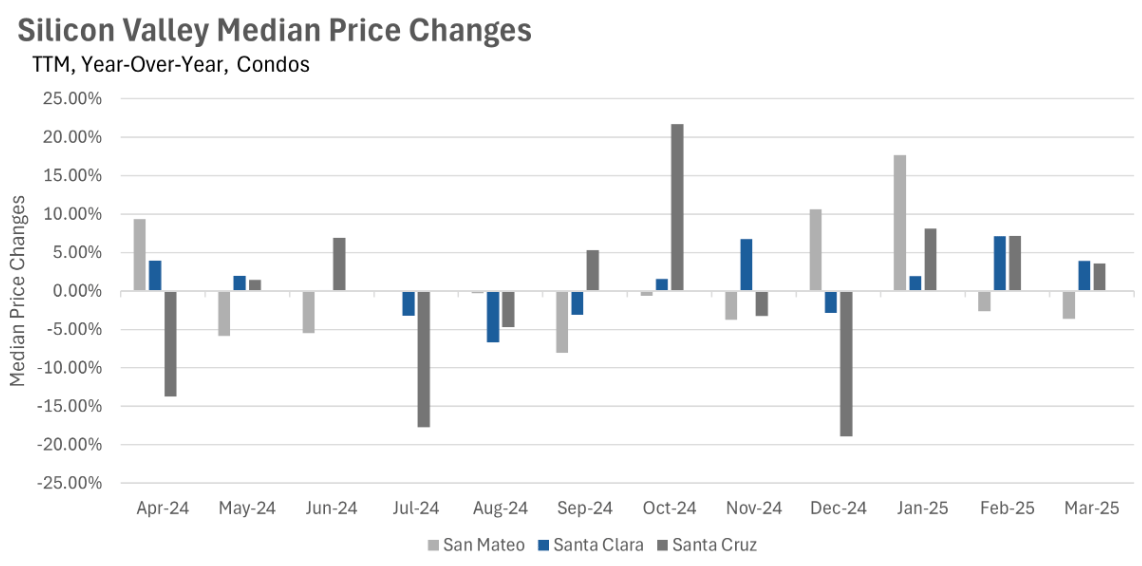
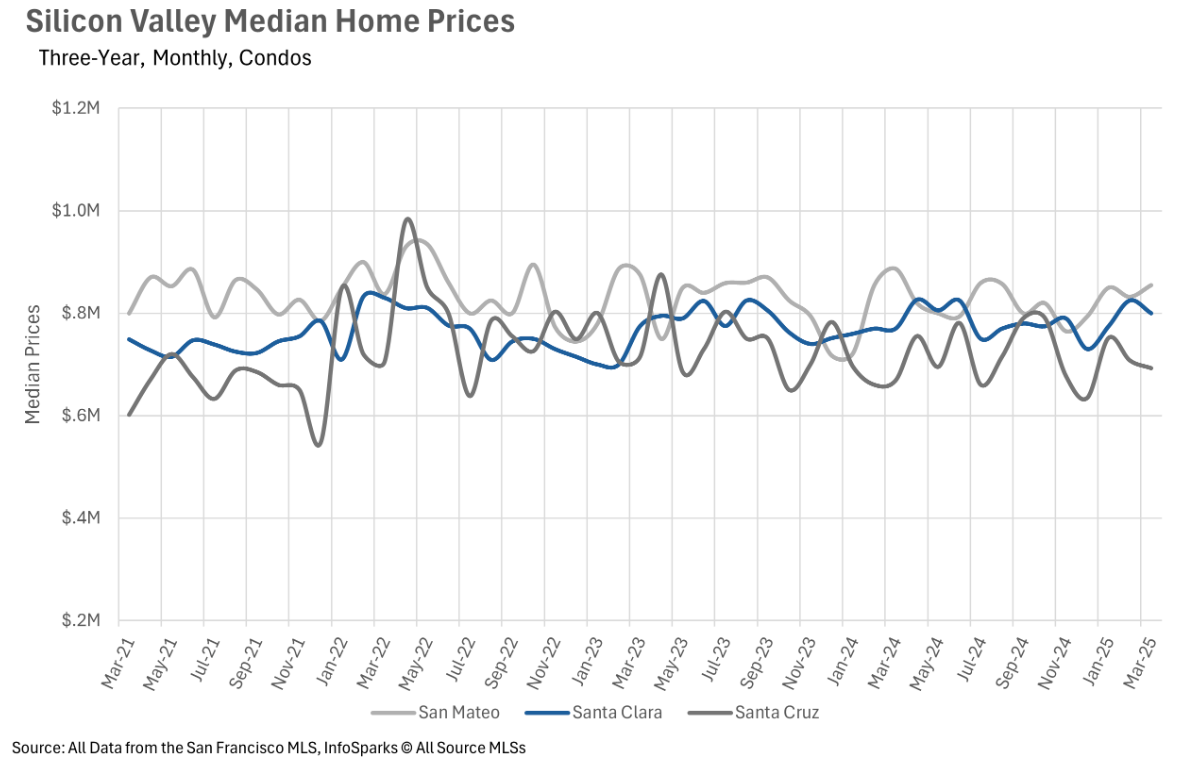
Bay Area home values show divergent trends across regions
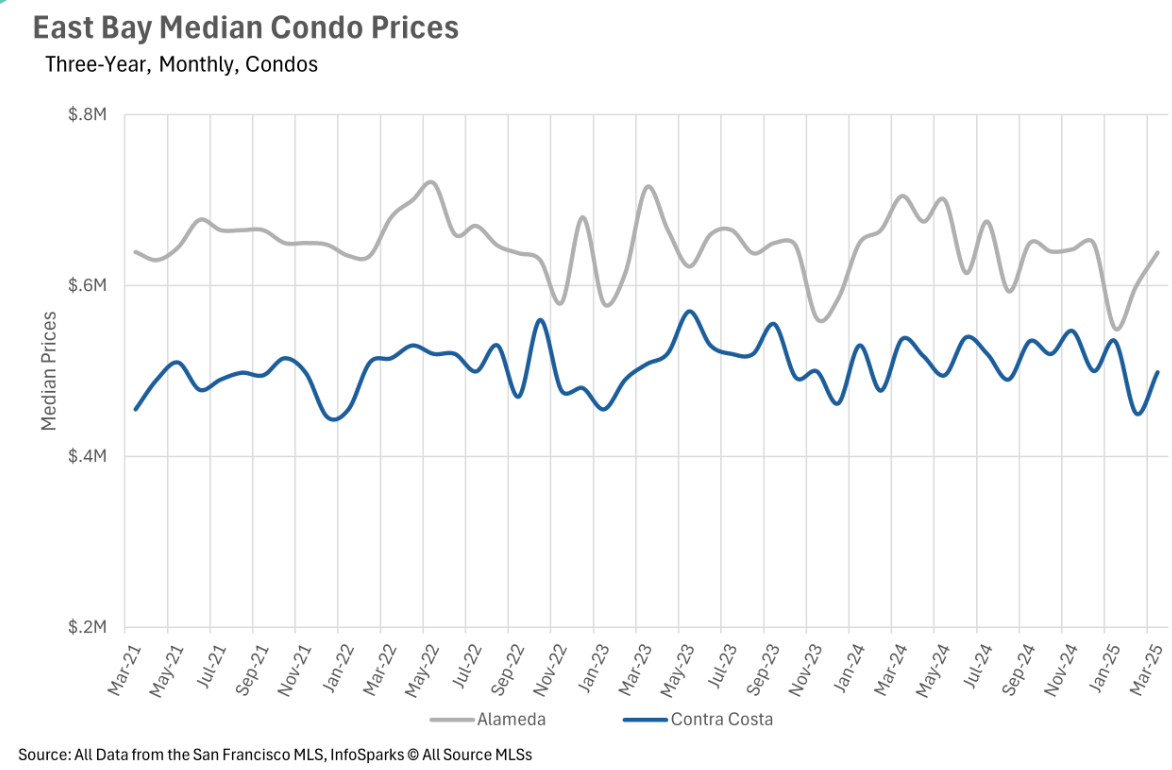
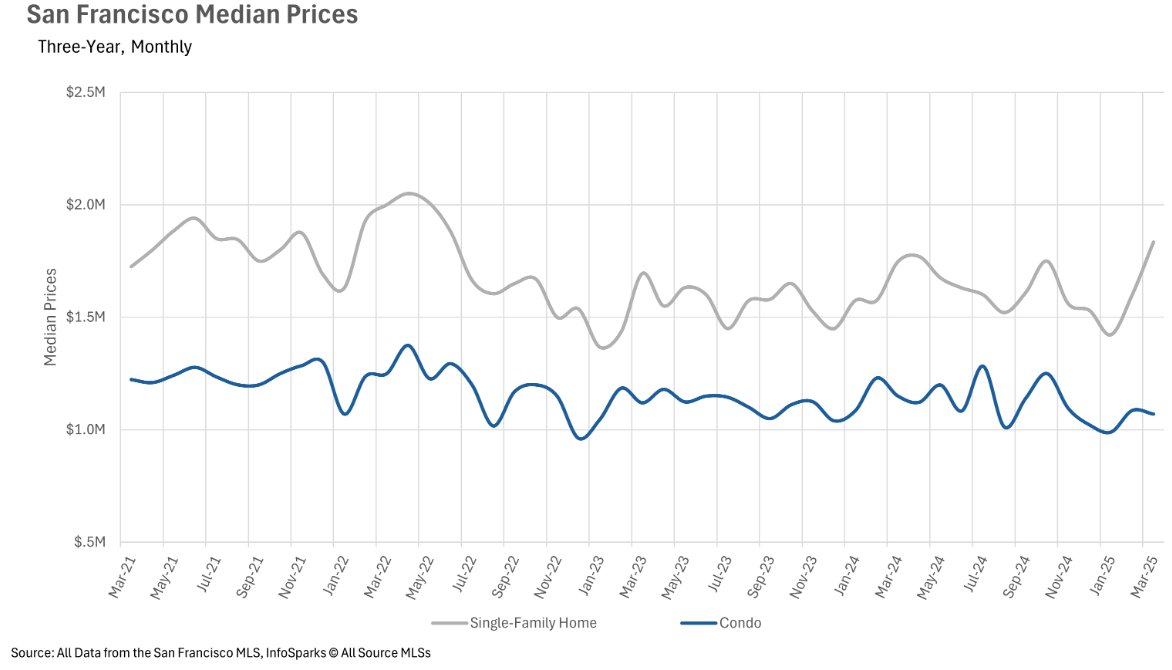
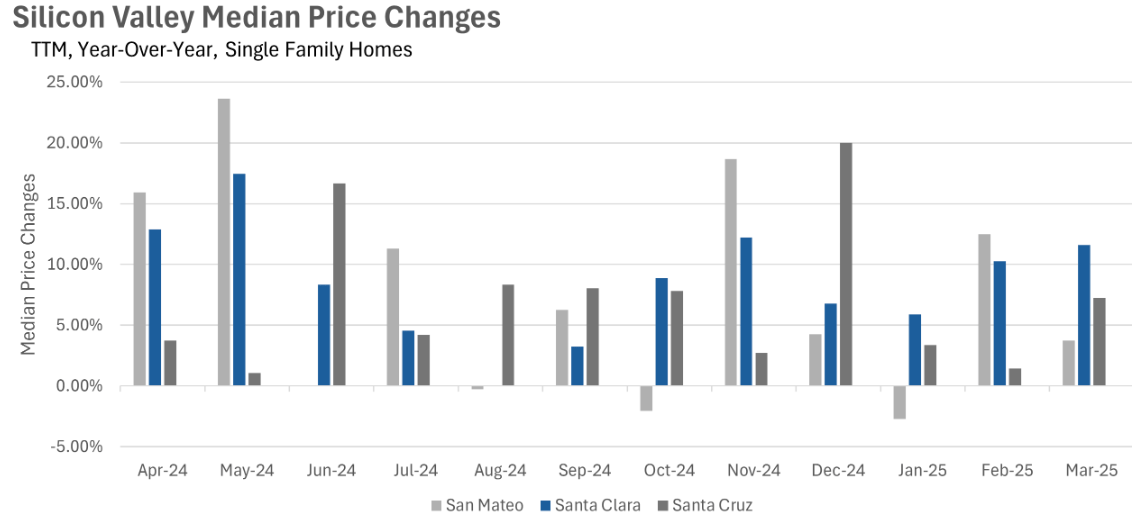
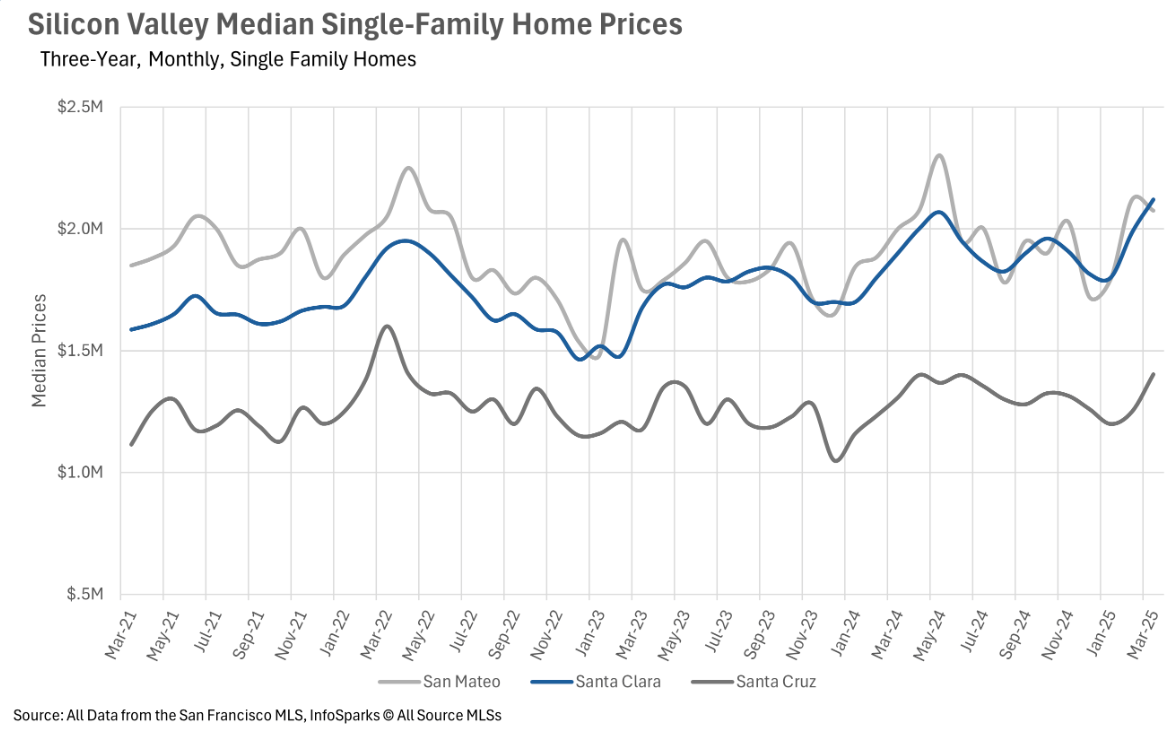
The Bay Area real estate market is showing varied performance across its different regions. Silicon Valley continues to be a hotspot for growth, with Santa Clara County experiencing an impressive 11.58% year-over-year increase in median sale price in March. San Mateo and Santa Cruz counties also saw healthy increases of 3.75% and 7.27%, respectively. In contrast, the East Bay market has cooled somewhat, with year-over-year median sale prices dropping by 4.41% in Alameda County and 7.44% in Contra Costa County, though month-over-month trends remain positive. San Francisco presents a tale of two markets, with single-family homes maintaining their value (increasing 6.63% over four years) while condo values have declined by 12.52% over the same period, highlighting buyer preference for detached homes over shared buildings.
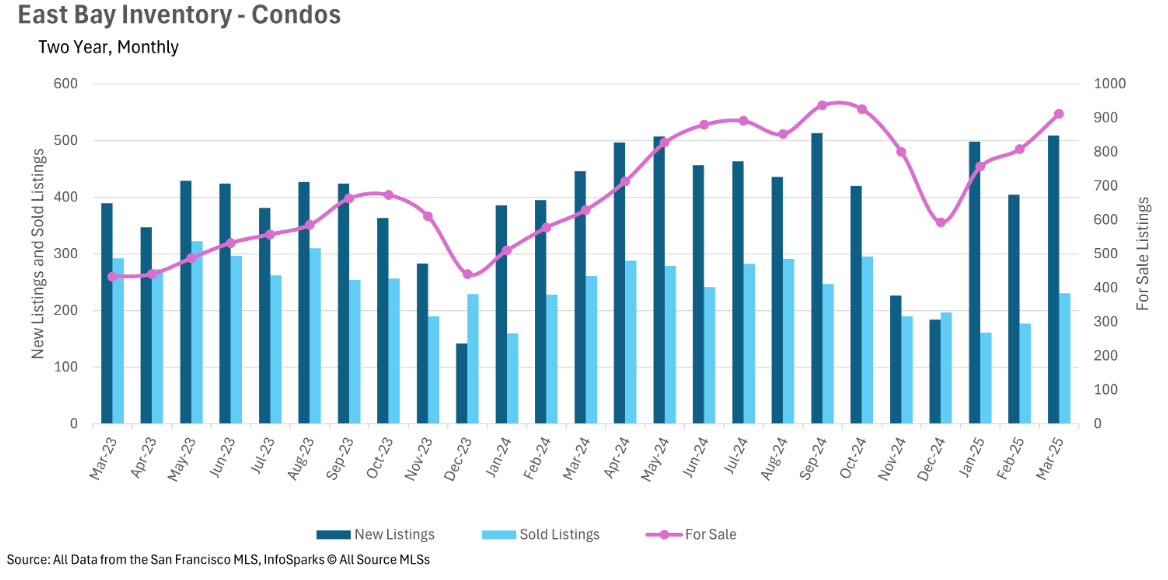
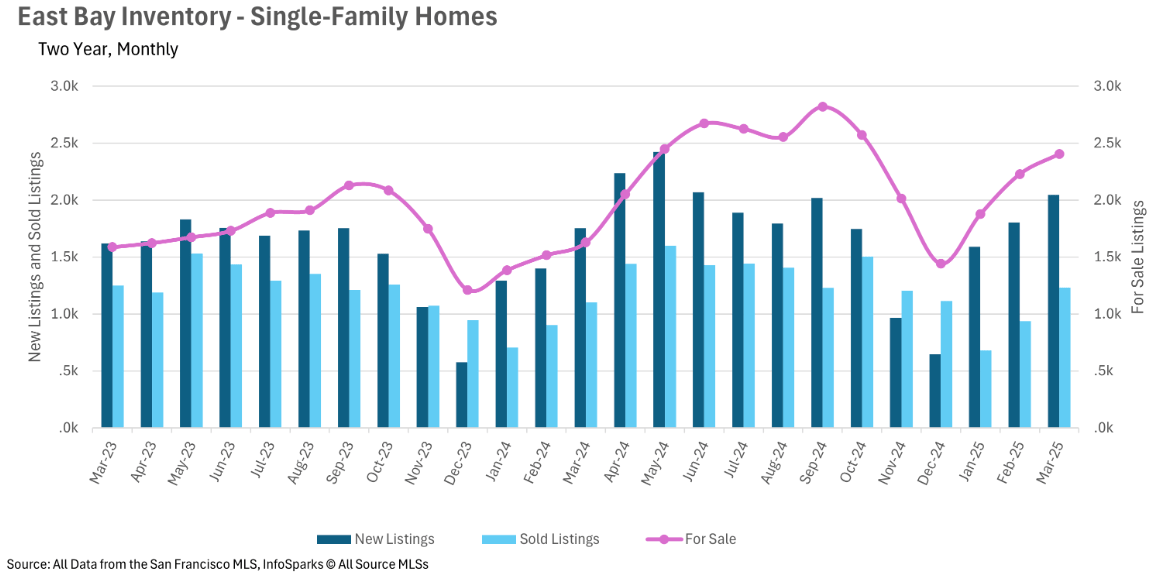
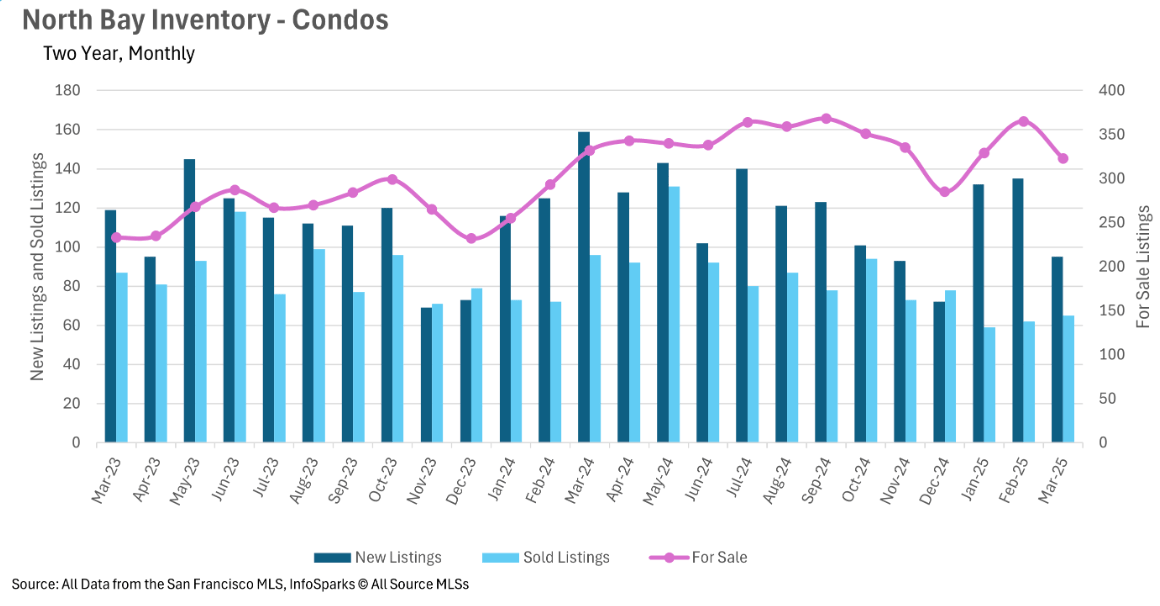
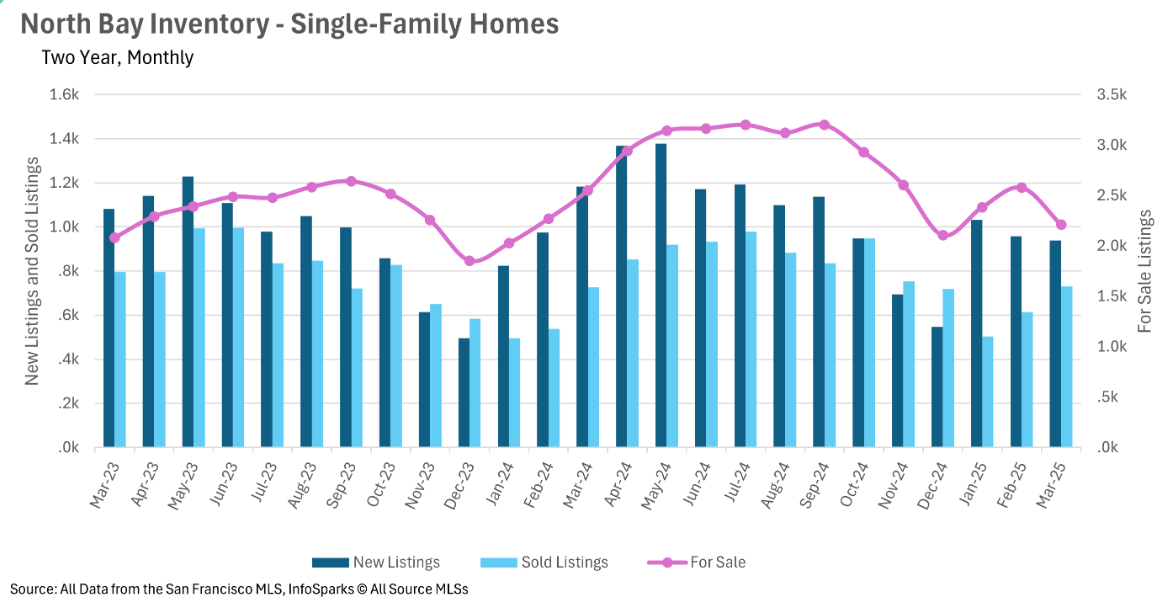
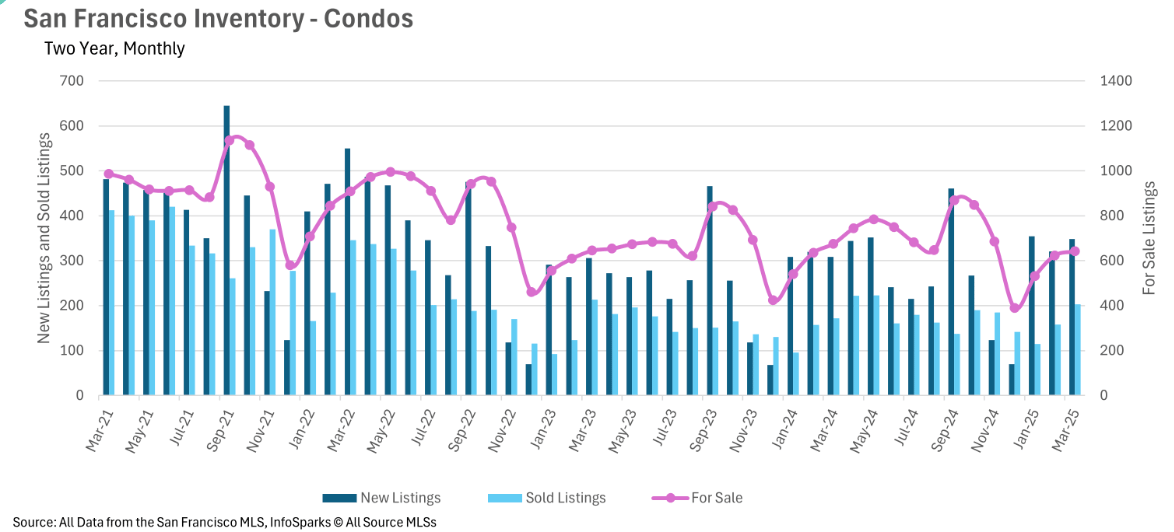
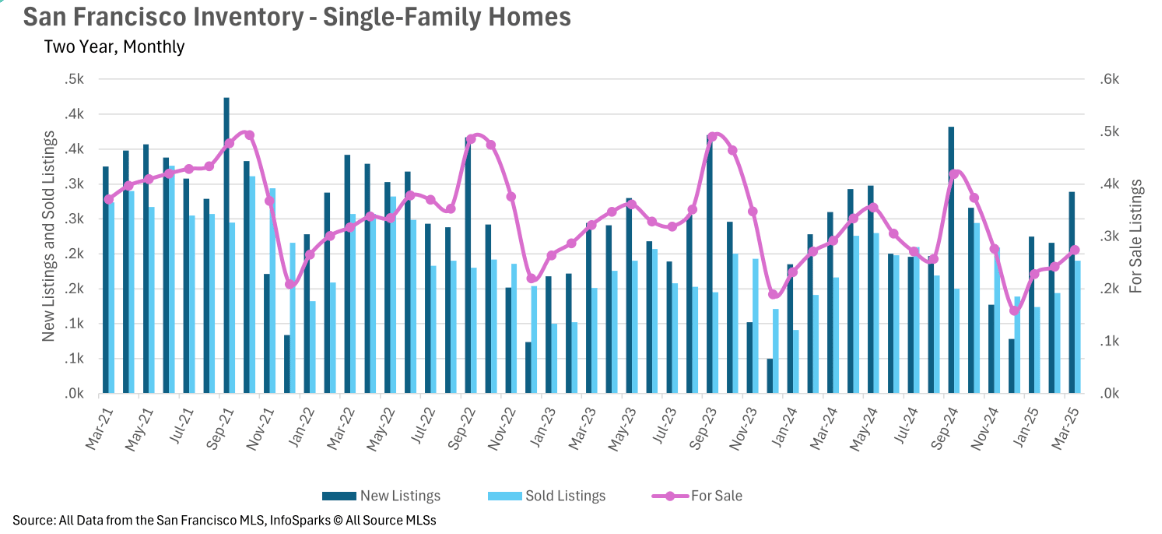
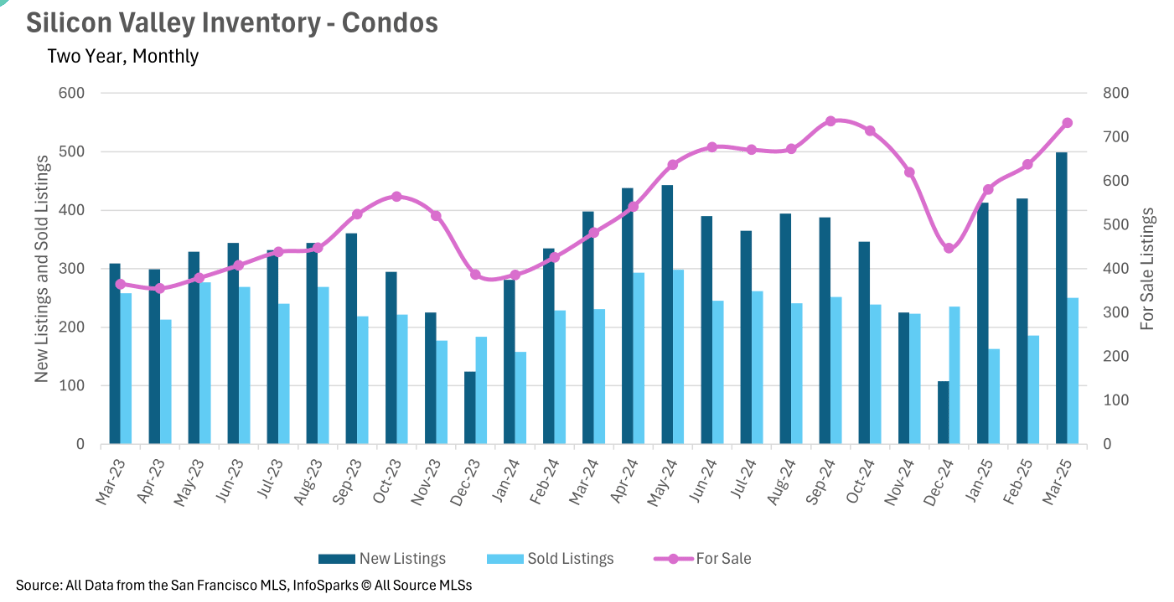
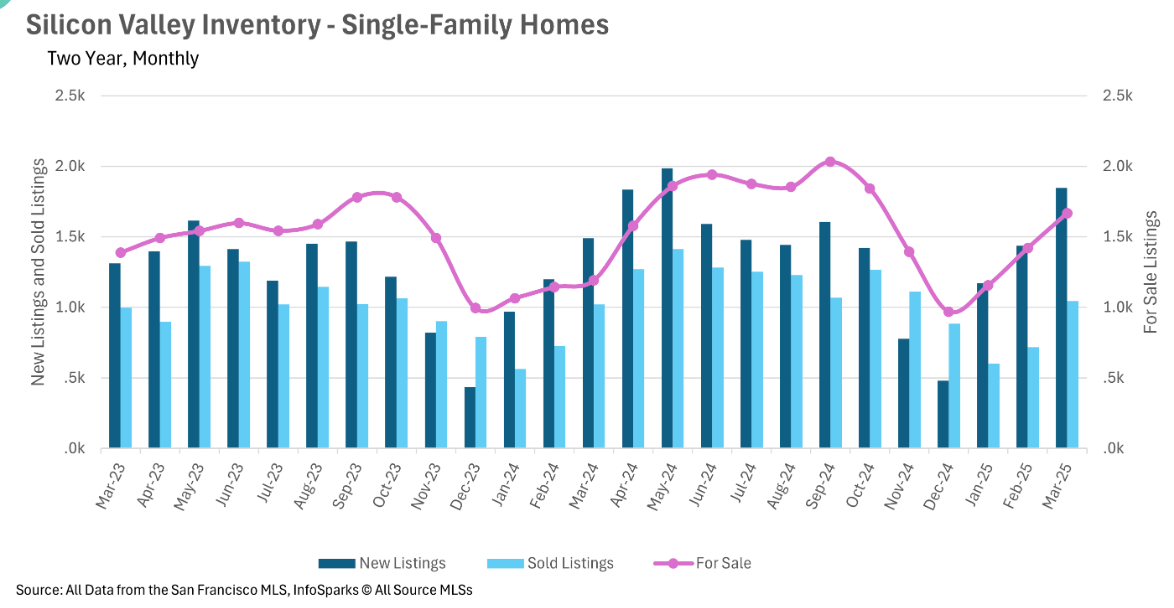
Inventory levels and new listings show regional variations
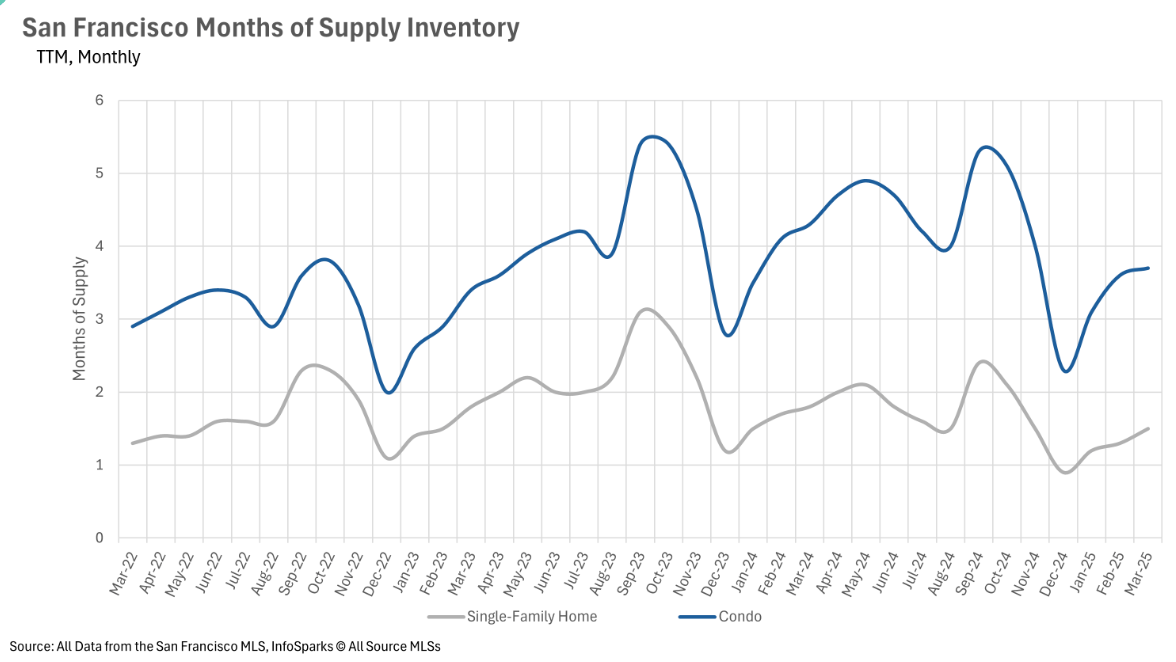
Inventory trends across the Bay Area show significant regional differences. Silicon Valley is experiencing substantial inventory growth, with single-family home inventories increasing by 40.05% in March, boosted by a 23.83% jump in new listings compared to last year. Similarly, the East Bay saw active listings increase by 47.79% year-over-year, with new listings in March up 16.78%. In stark contrast, San Francisco continues to struggle with inventory shortages, particularly for single-family homes, with just 1.5 months of supply available. The North Bay region is also facing inventory challenges, with a 14.28% month-over-month decrease in March and 20.78% fewer new listings compared to March 2024. These divergent inventory trends are creating different market dynamics across the Bay Area regions.
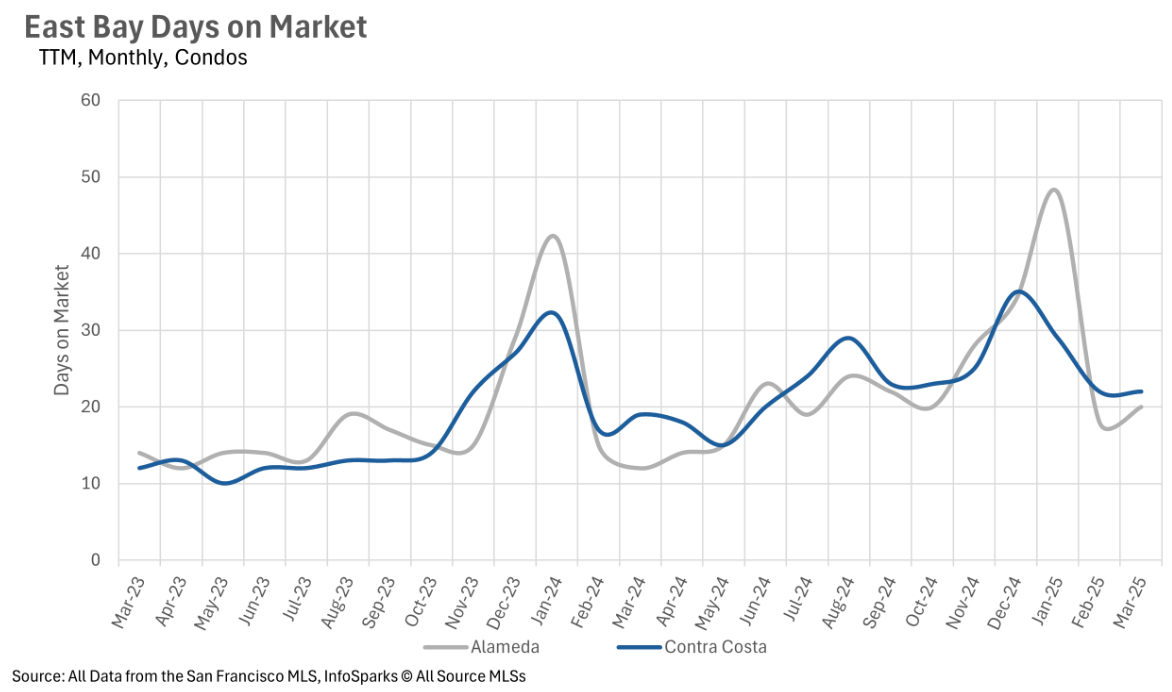
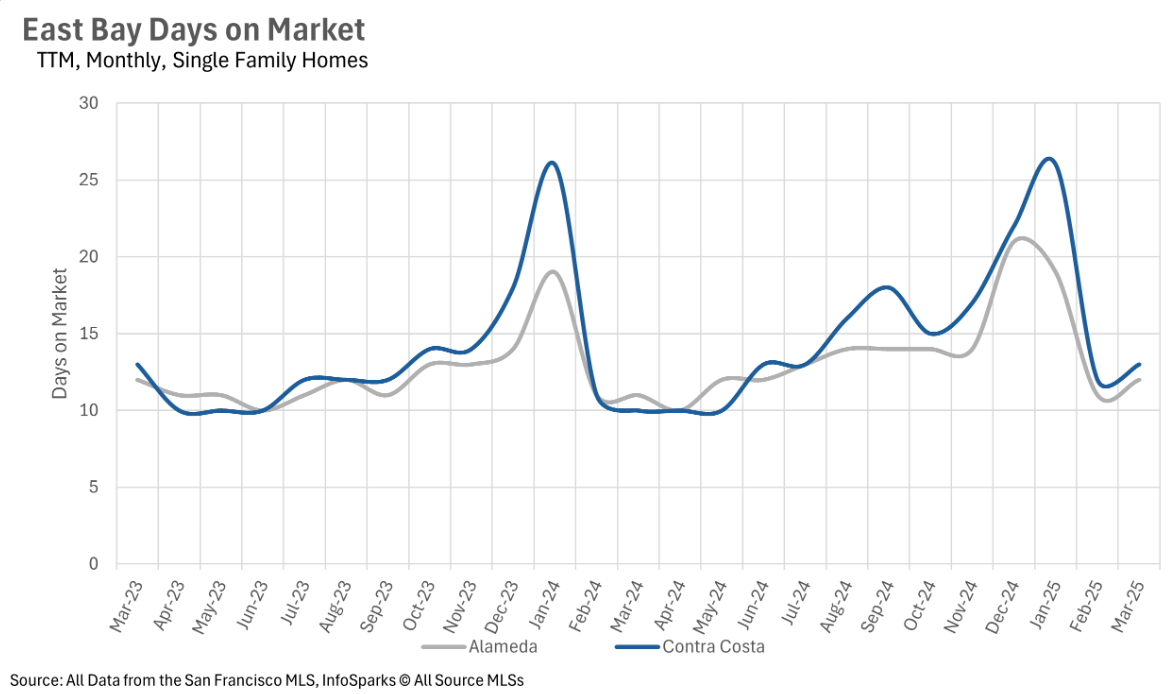
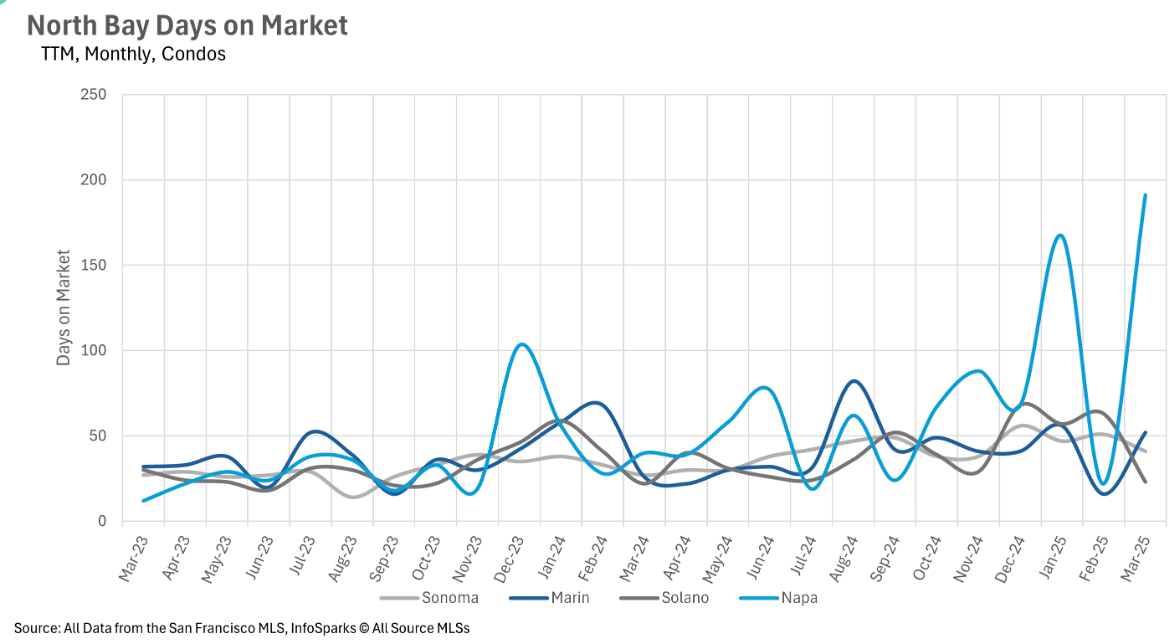
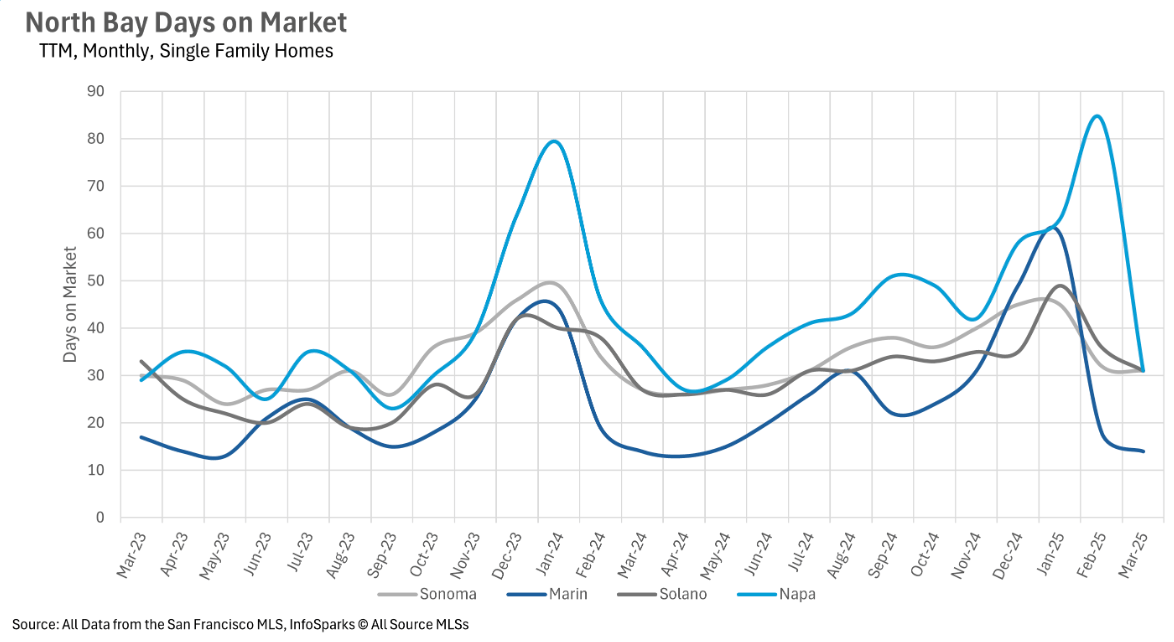
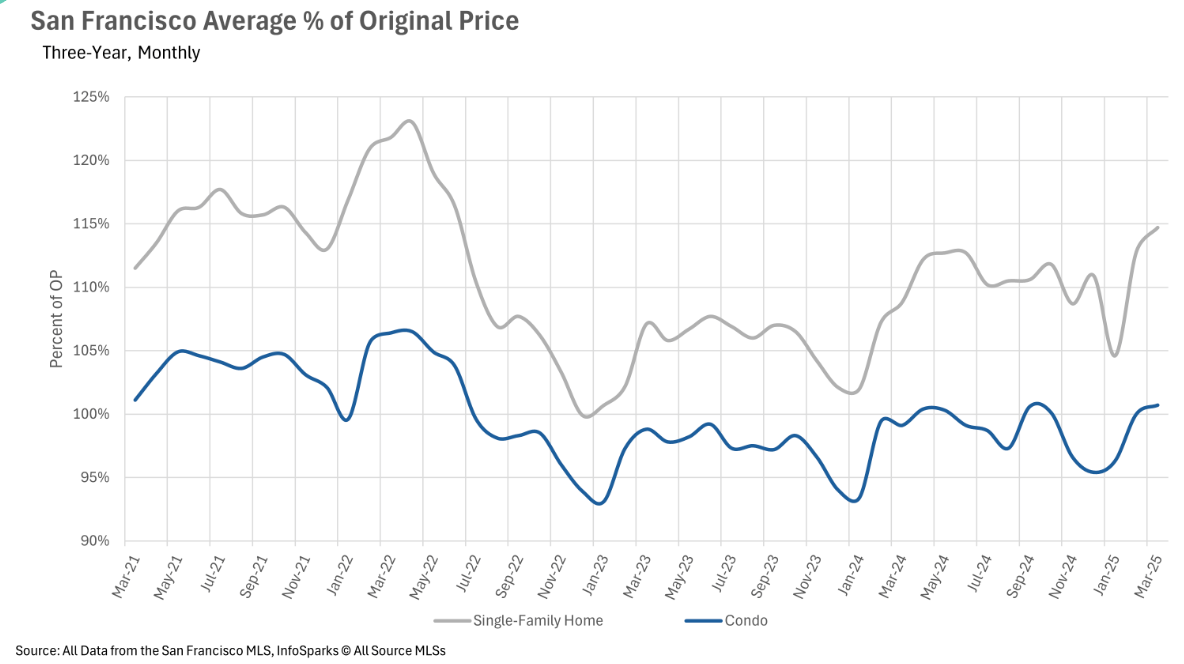
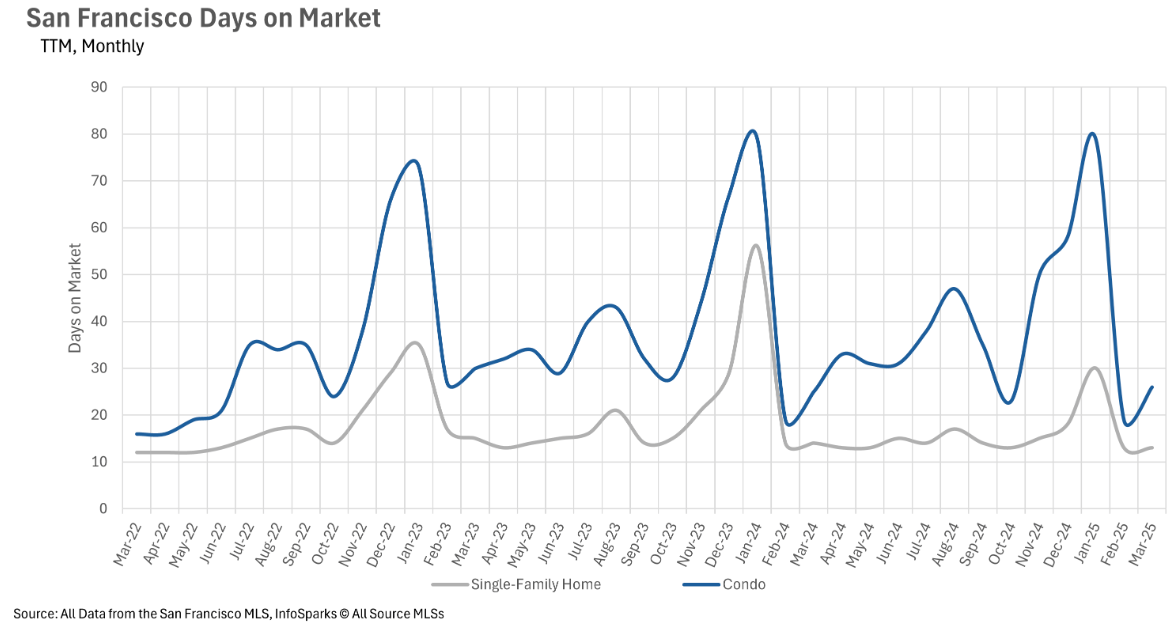
Days on market vary dramatically by region
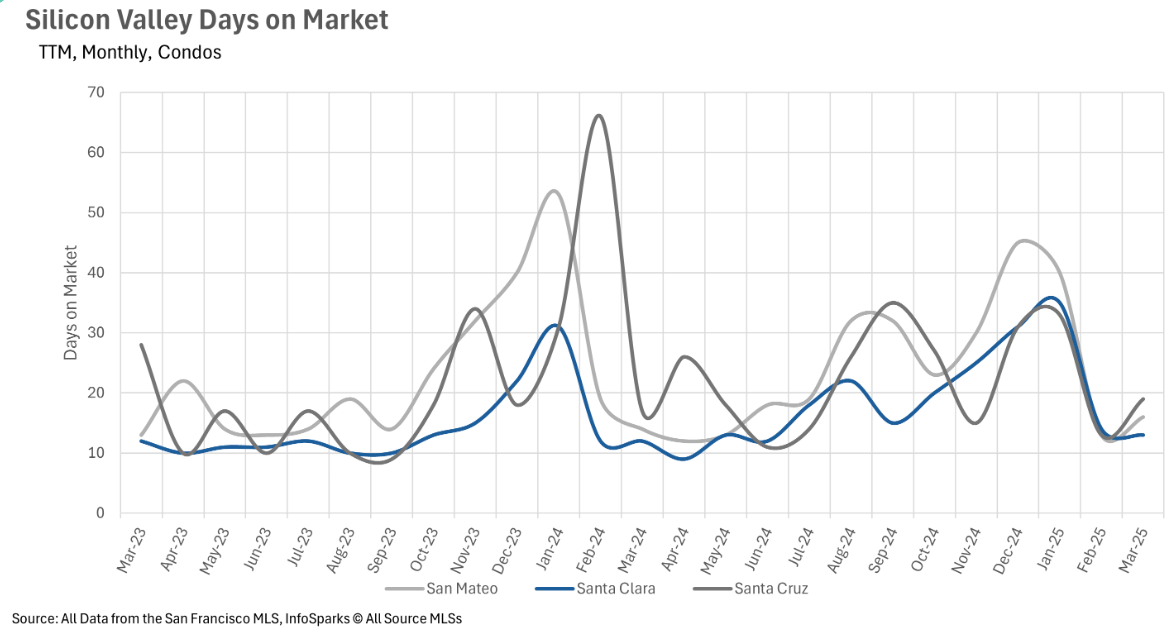
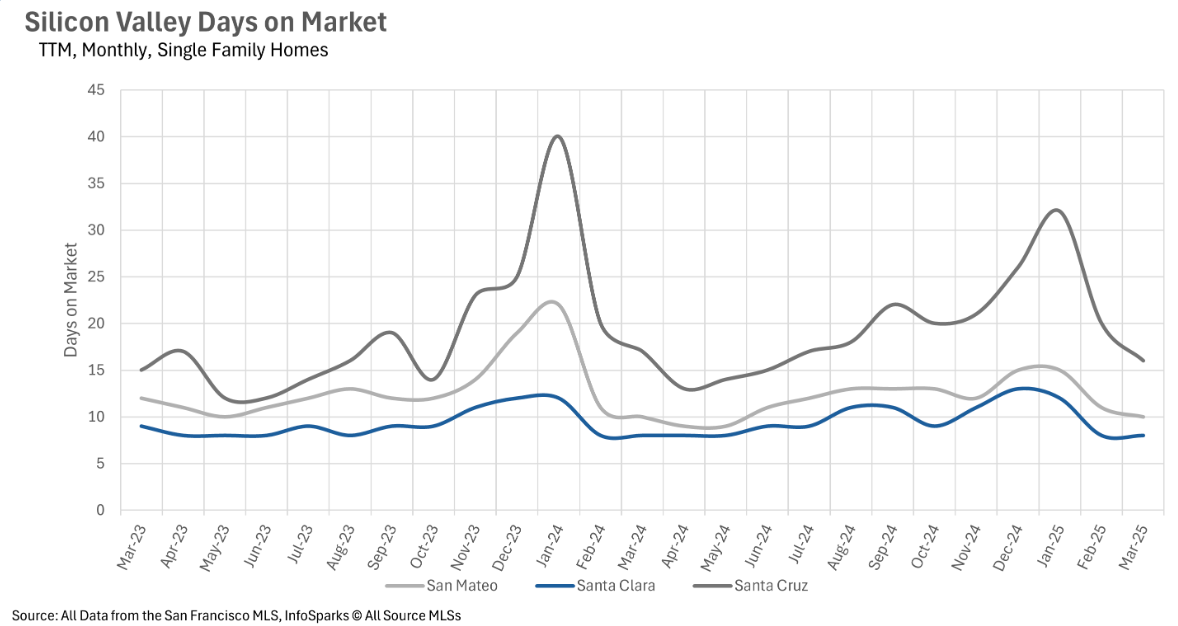
One of the most striking variations across Bay Area markets is the time homes spend on the market before selling. Silicon Valley homes are being snapped up quickly, with the average listing lasting just 8 days in Santa Clara, 10 days in San Mateo, and 16 days in Santa Cruz. The East Bay also shows relatively quick movement with homes typically selling in 12 days in Alameda County and 13 days in Contra Costa County, despite the significant year-over-year inventory increases. In San Francisco, single-family homes are seeing competitive bidding, selling for 114.7% of their original asking price - a level not seen since before the Fed began raising interest rates in June 2022. This contrasts sharply with markets like the North Bay, where homes in Sonoma and Solano counties are spending approximately 15% longer on the market compared to last year.
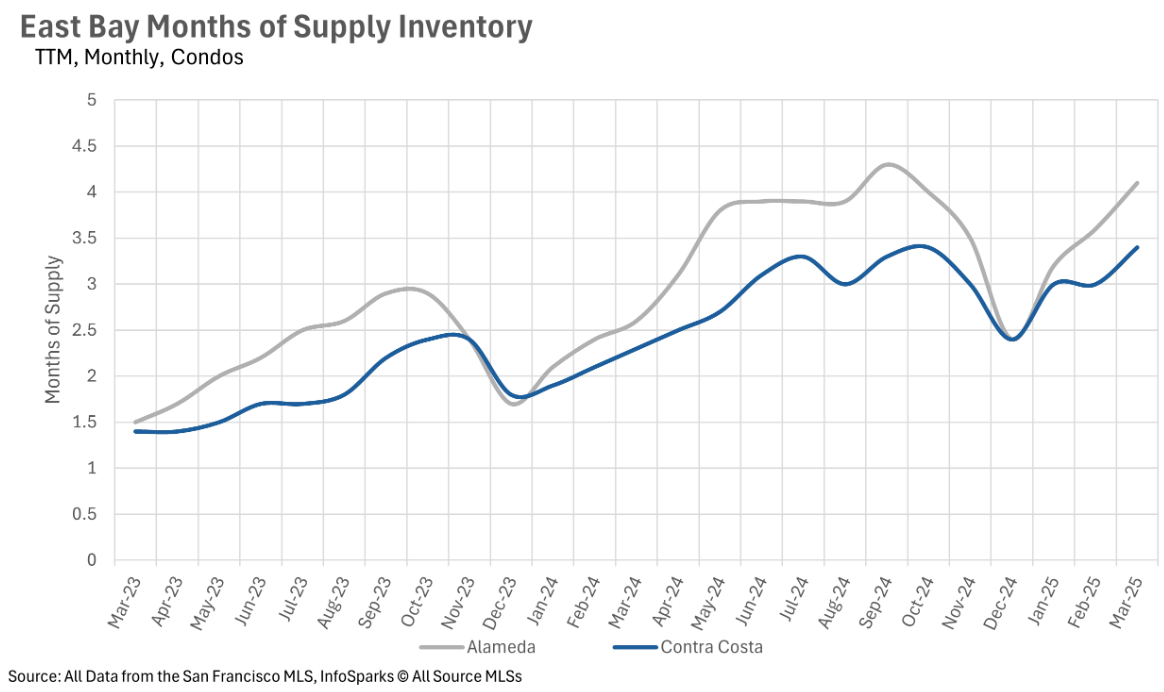
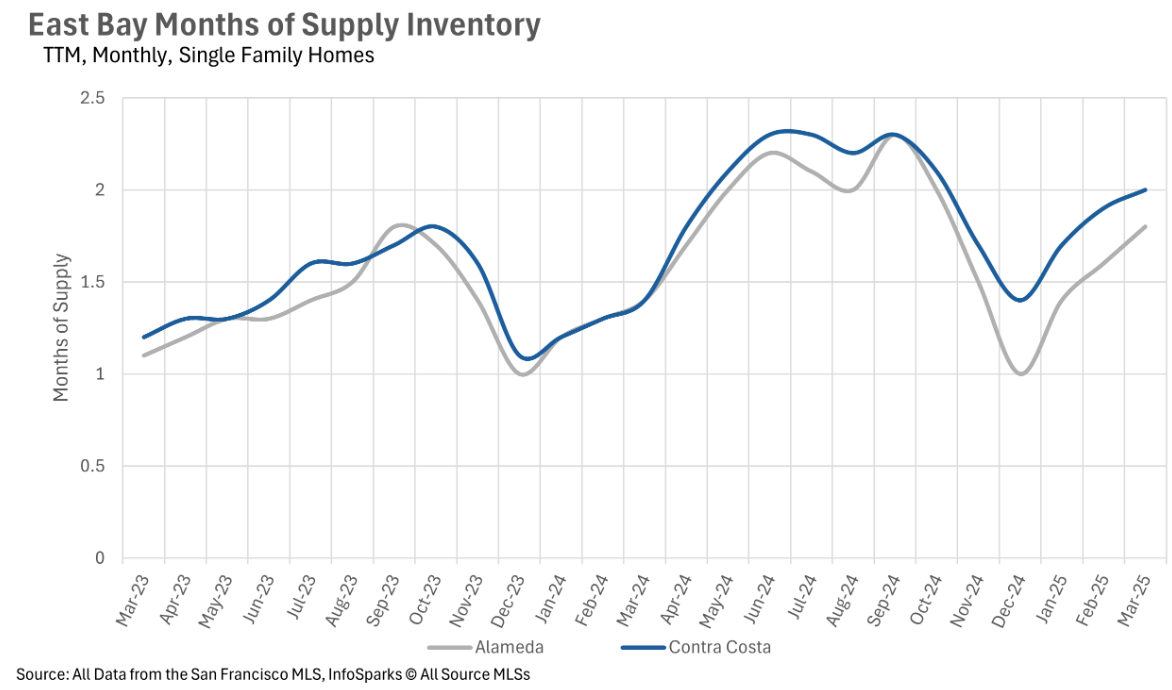
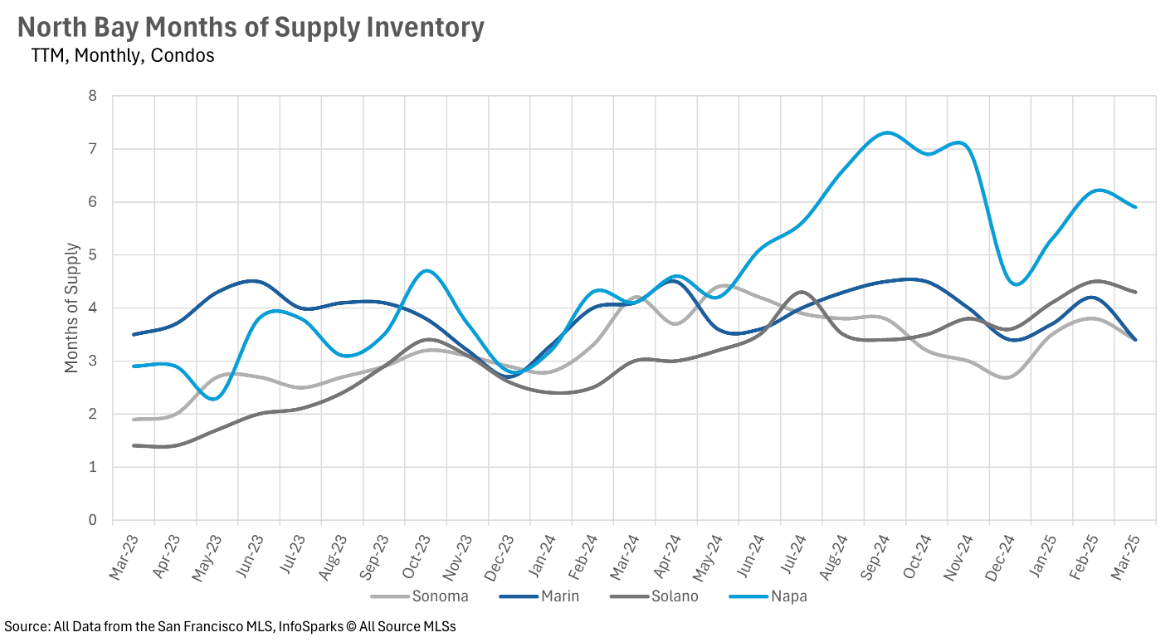
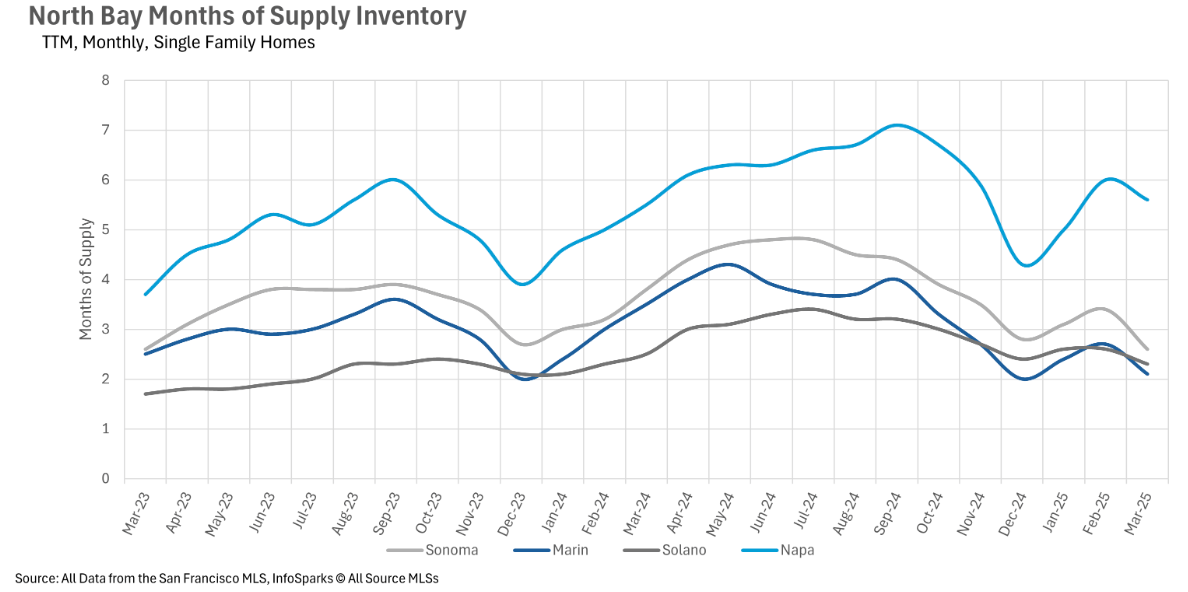
Market balance favors sellers for single-family homes, buyers for condos
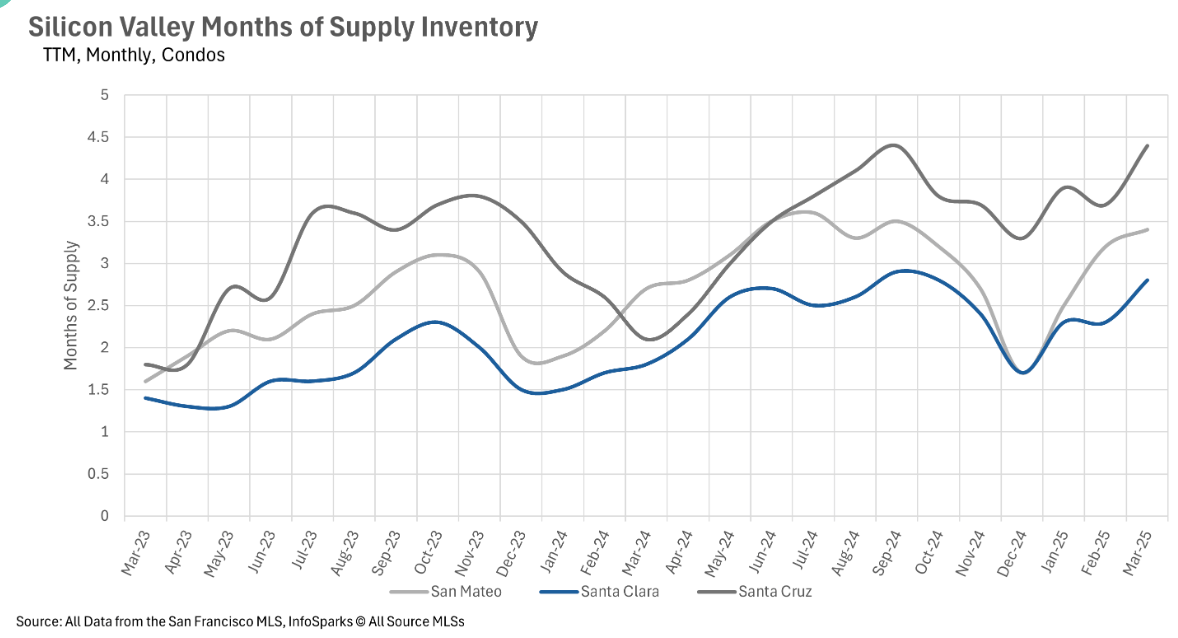
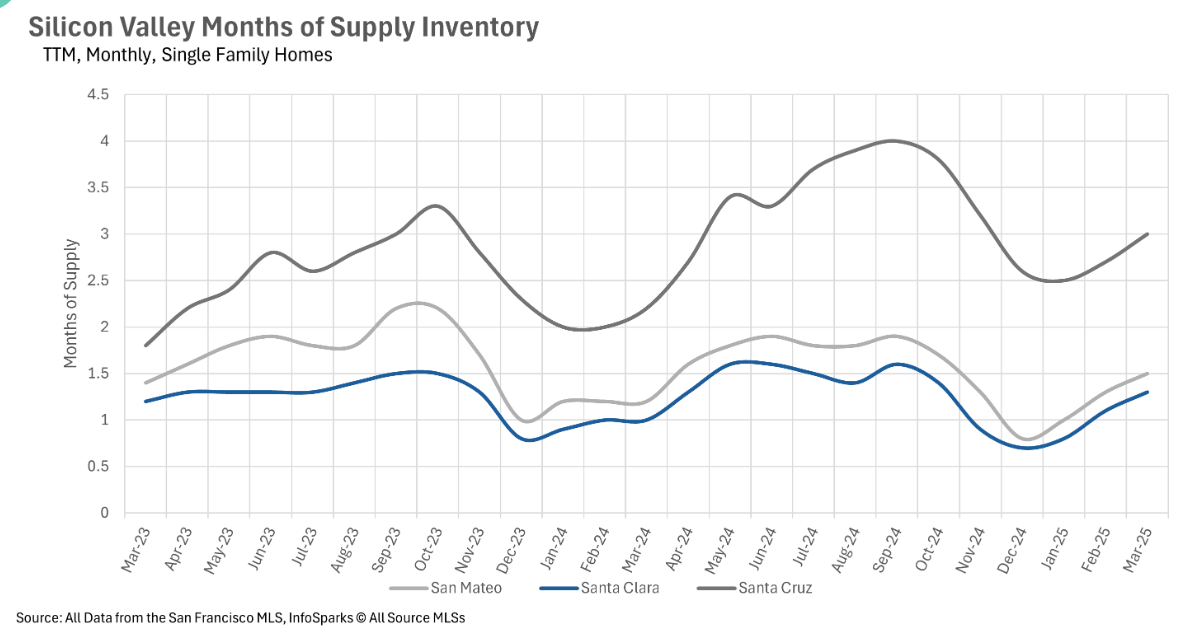
When assessing whether markets favor buyers or sellers, the months of supply inventory (MSI) metric provides clear insights. Historically, California averages around three months of MSI, with lower figures indicating a seller's market and higher figures a buyer's market. Across most of the Bay Area, single-family homes remain firmly in seller's market territory, with Silicon Valley showing just 1.3 months in Santa Clara and 1.5 months in San Mateo (though Santa Cruz is balanced at exactly 3 months). The East Bay reflects similar seller advantage with 1.8 months in Alameda County and 2 months in Contra Costa County. San Francisco has just 1.5 months of single-family home inventory, while most of the North Bay (except Napa County at 5.6 months) also favors sellers. However, the condo market tells a different story, generally favoring buyers with higher inventory levels - 2.8 months in Santa Clara, 3.4 months in San Mateo, 4.4 months in Santa Cruz, 4.1 months in Alameda, 3.4 months in Contra Costa, and 3.7 months in San Francisco. This distinct split between single-family home and condo markets is consistent throughout the Bay Area.