The Local Lowdown: April 2025

Michelle Kim  |  May 1, 2025

The Local Lowdown: April 2025

The Local Lowdown

Quick Take:
  • Single-family homes continue to hold their value, while condo values continue to trend downward over time.
  • Single-family homes are selling for the highest percentage of their original price that we’ve seen since the Fed started hiking interest rates.
  • Inventory continues to be a huge issue for the San Francisco area, as both single-family home and condo inventories downtrend over time.
Note: You can find the charts/graphs for the Local Lowdown at the end of this section.
 

The disconnect between condos and single-family homes

Throughout recent years, we’ve seen single-family homes maintain their values fairly well in San Francisco, with the median sale price of a single-family home in the area increasing by 6.63% over the course of the past four years. However, when we turn to the condo market, these homes have not been holding their value nearly as well, with the median sale price for a condo in San Francisco decreasing by 12.52% over the course of the past 4 years. This really highlights that buyers are much more interested in standalone homes, rather than shared buildings!
 

Single-family homes are selling for the highest percentage of their original price that we’ve seen in years!

As you might expect in an area like San Francisco, when there is a hot commodity, like detached single-family homes, buyers have to pay a premium, which is exactly what they’re doing right now! The average home in San Francisco is selling for 114.7% of its original asking price. This is a level that we haven’t seen since June of 2022, when the real estate market started its downtrend after the Fed began raising rates! When you couple this with the fact that inventory looks like it will continue to be an issue, we might have ourselves a recipe for a red-hot market this year!
 

Inventory remains one of the largest issues in the San Francisco residential real estate market

Unfortunately, the inventory issue that San Francisco is facing is nothing new. We’ve been observing the fact that inventories have been down-trending in the area for quite some time. This past month, we saw the growth in sold listings outstrip the growth in new listings once again, resulting in even lower inventory levels. This is a serious issue that’s likely a symptom of the much larger issue - housing affordability. As we all know, housing affordability has been a huge topic of discussion for years at this point. Oftentimes, those who own their homes and have a low interest rate locked in are very hesitant to move, as that likely means taking on a larger loan at a higher interest rate, making their cost of housing considerably more expensive!
 

Sellers dominate the single-family home market, while buyers have leverage in the condo market

When determining whether a market is a buyers’ market or a sellers’ market, we look to the Months of Supply Inventory (MSI) metric. The state of California has historically averaged around three months of MSI, so any area with at or around three months of MSI is considered a balanced market. Any market that has lower than three months of MSI is considered a sellers’ market, whereas markets with more than three months of MSI are considered buyers’ markets.
 
Right now, there’s just 1.5 months' worth of single-family home inventory on the market, making it a seller-dominant market. However, on the flip side, the condo market has 3.7 months worth of inventory on the market, meaning that there are some deals to be had out there for buyers that are looking for a condo!
 

Local Lowdown Data

San Francisco chart comparing monthly average sale price as a percentage of original price for single-family homes and condos, 2021–2025.Chart comparing San Francisco condo and single-family-home days on market, March 2022–March 2025.San Francisco condo inventory chart with monthly new listings, sold listings, and for-sale listings from March 2021 to March 2025.Chart of San Francisco single-family home listings and for-sale inventory from May 2021 through March 2025.Bar chart comparing year-over-year San Francisco median price changes for single-family homes and condos, April 2024–March 2025.Chart comparing monthly San Francisco median prices for single-family homes and condos, March 2021–March 2025.San Francisco months-of-supply chart, March 2022–March 2025, comparing condos and single-family homes.


Recent Blog Posts

Stay up to date on the latest real estate trends.
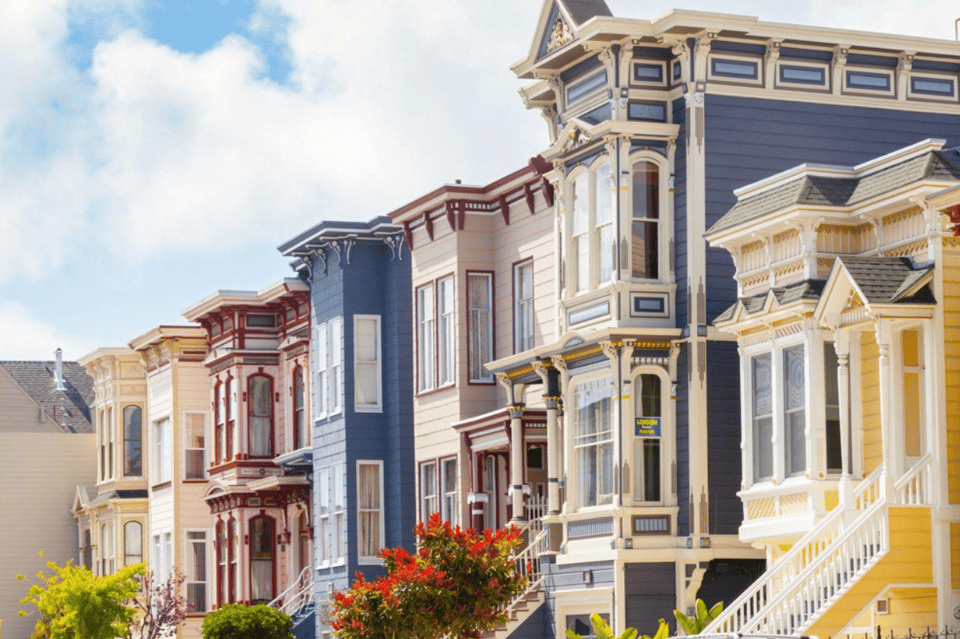
Living in NoPa, San Francisco: A Guide to the Neighborhood Lifestyle

Michelle Kim  |  October 19, 2026

Explore life in NoPa, San Francisco, from classic Victorian homes and local dining on Divisadero Street to nearby parks, walkability, and neighborhood charm.
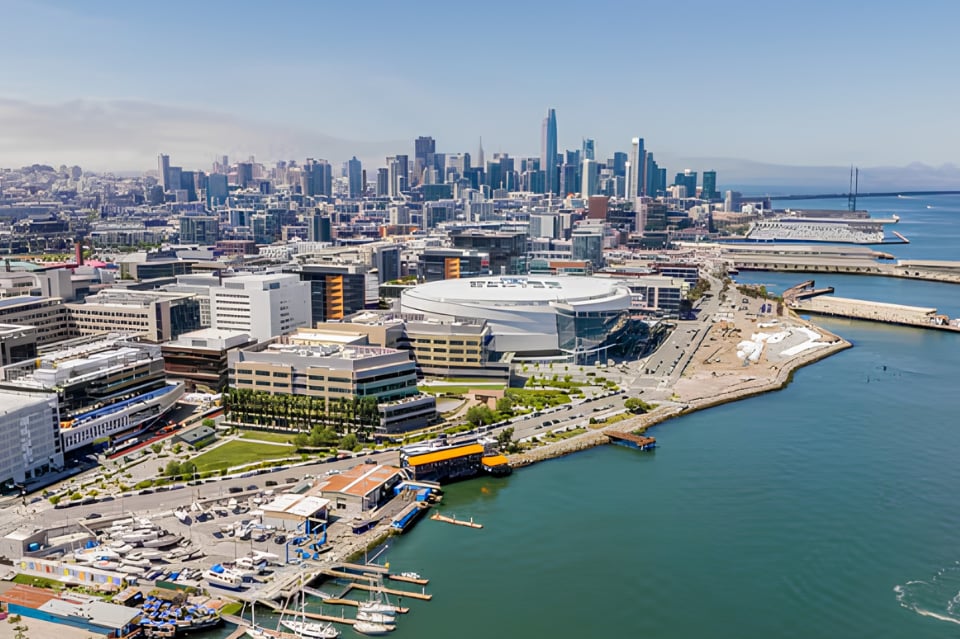
Aerial panorama of San Francisco's downtown skyline and waterfront along the bay.
Living in Mission Bay: A Guide to the Neighborhood Lifestyle

Michelle Kim  |  October 2, 2026

Explore life in Mission Bay, from waterfront parks and modern residences to dining, entertainment, outdoor recreation, and convenient city connections.
The Big Story Market Update
The Local Lowdown: September 2026

Michelle Kim  |  September 30, 2026

Quick Take: Median home sale prices slipped for the second straight month in August, falling to $429,100 from June's peak of $442,800, though they remain slightly abov… Read more

North Bay Market Update
The Local Lowdown: September 2026

Michelle Kim  |  September 30, 2026

Quick Take: Marin County dominated August, with the median single-family home selling for $1,778,000, a 15.83% jump over last August, while Sonoma, Solano, and Napa Co… Read more

East Bay Market Update
The Local Lowdown: September 2026

Michelle Kim  |  September 30, 2026

Quick Take: Single-family prices are holding firm year over year, with Alameda County up slightly and Contra Costa County up nearly 3%, while the condo picture has spl… Read more

South Bay Market Update
The Local Lowdown: September 2026

Michelle Kim  |  September 30, 2026

Quick Take: Single-family median prices diverged again in August, with San Mateo County up nearly 8% year over year while Santa Clara and Santa Cruz Counties slipped m… Read more

We Would Love to Meet You!

You’ve got questions and we can’t wait to answer them.