South Bay & Peninsula Real Estate Market Report: December 2021
robyn November 27, 2021

robyn November 27, 2021
The Big Story
Note: You can find the charts/graphs for the Big Story at the end of this section.
The Big Story
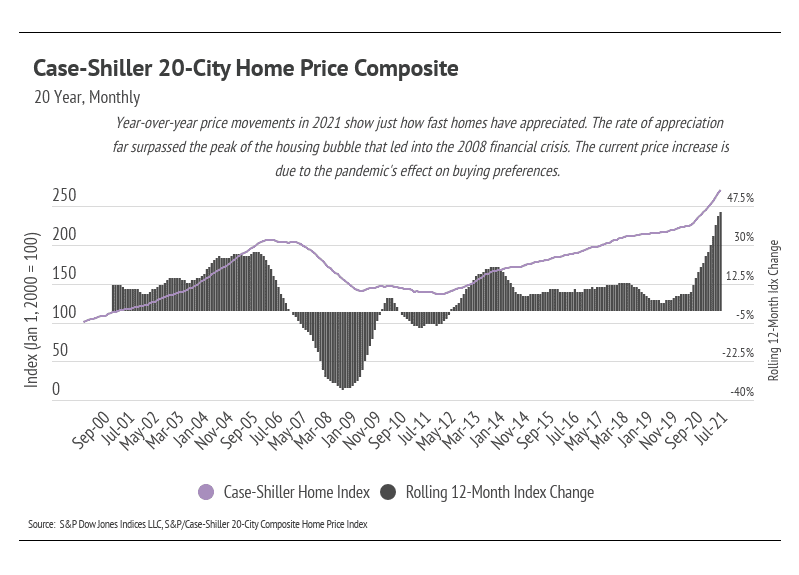
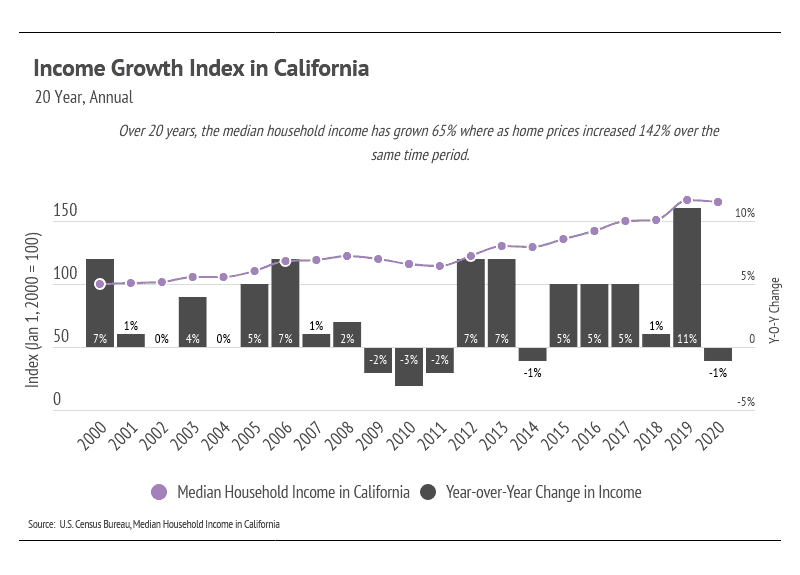
Income is one of the largest predictors of home price growth, second only to available supply. Consumers have more money to spend, which in turn drives up prices. But the increases in income haven’t kept up with the rise in home prices, especially in the last two years. In 2020, home prices increased 10% according to the Case-Schiller 20-City Composite Index, while median income decreased by 1%.
The disconnect between income and home prices is happening for two reasons. First, the ability to take on debt means that income doesn’t necessarily need to increase at a 1:1 ratio with home prices. Second, the pandemic changed buyer preferences, increasing the demand for homes and dropping inventory to previously unseen lows.
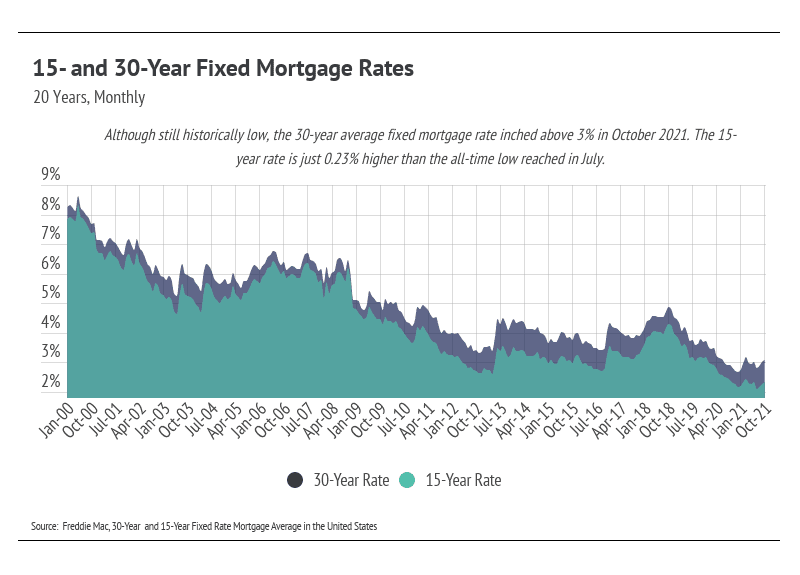
Because home price increases outpaced income growth, homebuyers needed to take on more debt to buy a home than they would have a few years ago. But due to the drop in interest rates, the monthly payment, even on a higher-priced home, becomes more affordable. For every 1% decrease in a 30-year mortgage rate, the price of the home can increase 13% without a change in monthly payment (and vice versa). For example, the monthly payment on a $1,000,000 mortgage at 4% is almost identical to the monthly payment for a $1,130,000 mortgage at 3%, a $130,000 difference.
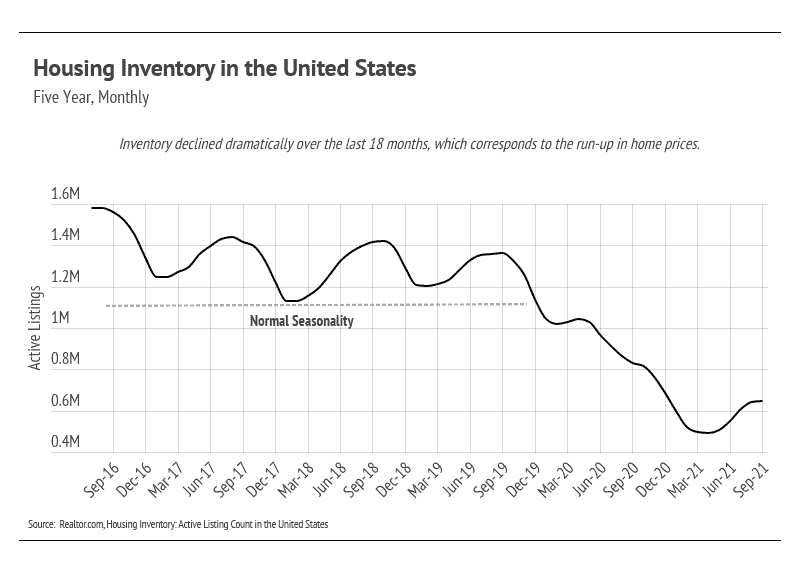
The pandemic also changed buyer preferences. Rather than spending roughly half of our time at home, which is the norm, we were faced with endless time in our living spaces. (You remember — you were there.) As of September 2021, the United States has 59% fewer homes on the market, and 53% of that happened in the last two years. We were happy to see more homes on the market in the second quarter of 2021 because the increased supply helped satiate the high buyer demand, but we are already seeing the seasonal shift to fewer homes coming to market. Inventory will likely remain super low in the coming fall and winter months.
The market remains competitive for buyers, but conditions are making it an exceptional time for homeowners to sell. Low inventory means sellers will receive multiple offers with fewer concessions. With so many moving parts in real estate transactions, working with an experienced real estate agent is essential in smoothly navigating the entire buying and selling process.
Big Story Data
The Local Lowdown
Quick Take:
Note: You can find the charts/graphs for the Local Lowdown at the end of this section.
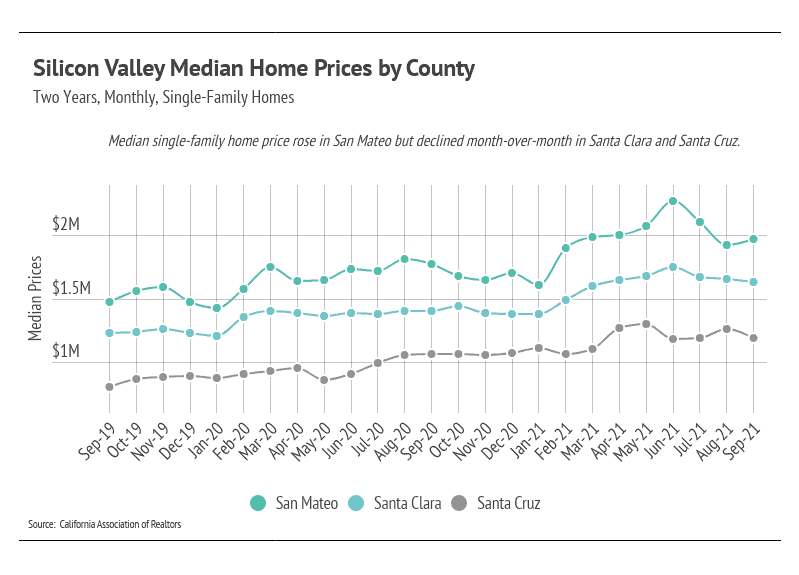
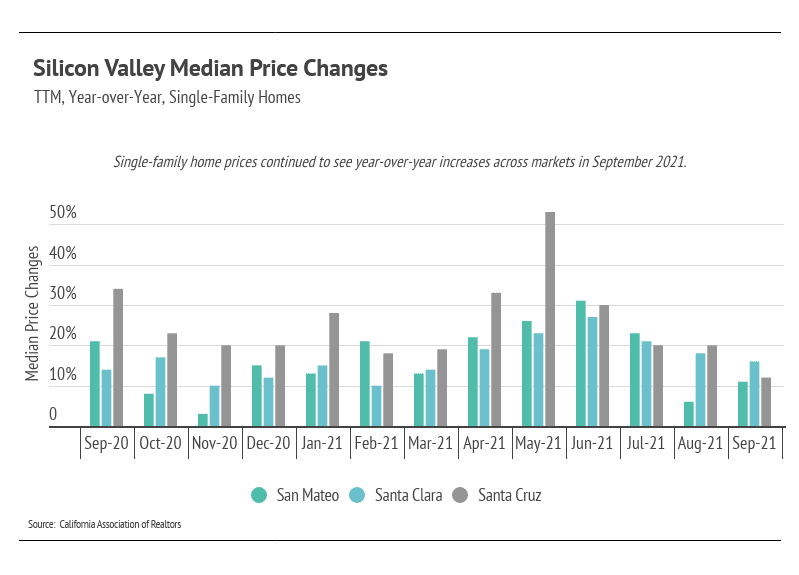
The growth rates in 2021 are highly unusual and unsustainable; for example, home prices would more than double every five years at a 15% growth rate. After huge single-family home price appreciation in the first half of the year, it made sense that prices declined in the third quarter. During the summer months (July–September), San Mateo County home prices declined 13%, up 16% for the year. During the same time period, Santa Clara home prices experienced a less substantial decline: a drop from 27% in June to 19% in September. Santa Cruz gained 1%, bringing the year-to-date price increase to 11%.
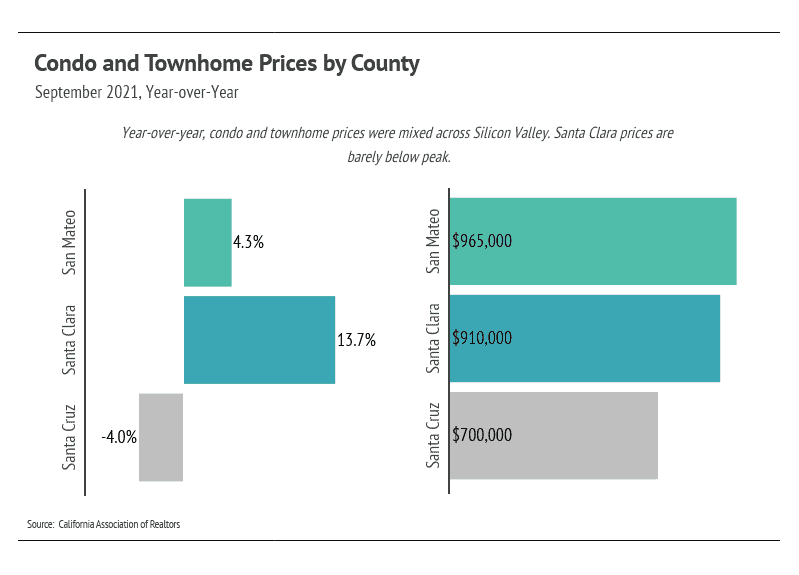
Condo prices are near all-time highs in Silicon Valley. Similar to single-family homes, prices contracted in the third quarter. Although the price appreciation wasn’t as pronounced for condos as it was for single-family homes, the growth rates for condos in 2021 are also unsustainable.
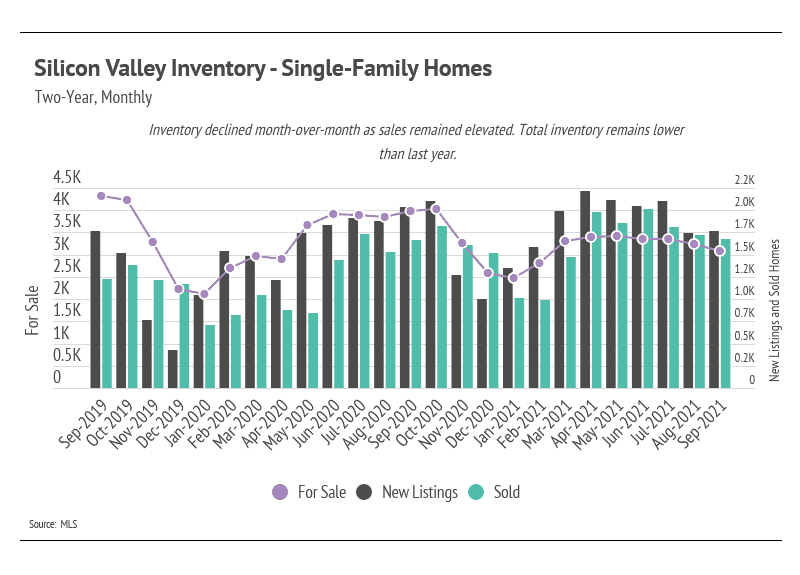
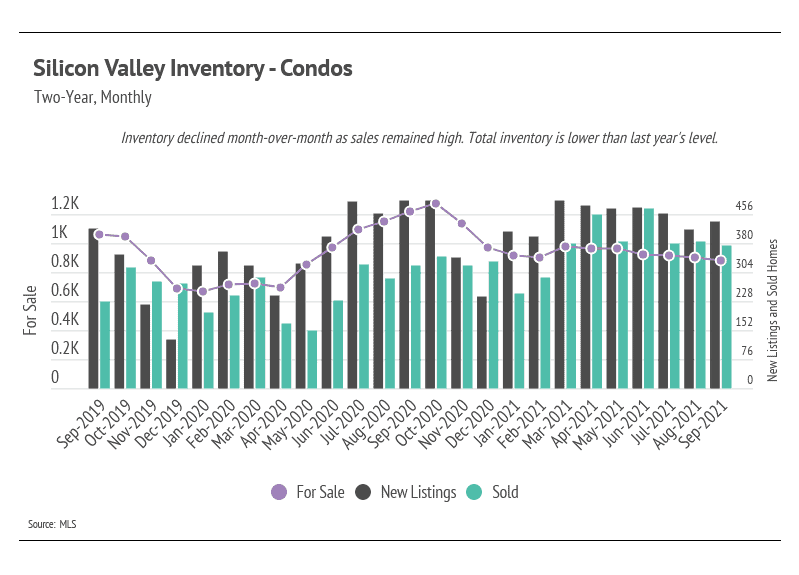
Despite the increase in single-family home inventory in 2021, we’re still at a historic low. August and September are typically the months with the highest inventory every year. In 2021, total inventory didn’t come close to last year’s level and was even further away from pre-pandemic levels. Even though we’re seeing some price correction after the first half of the year, the sustained low inventory will lift prices. Sales in Silicon Valley have been incredibly high, again highlighting demand in the area.
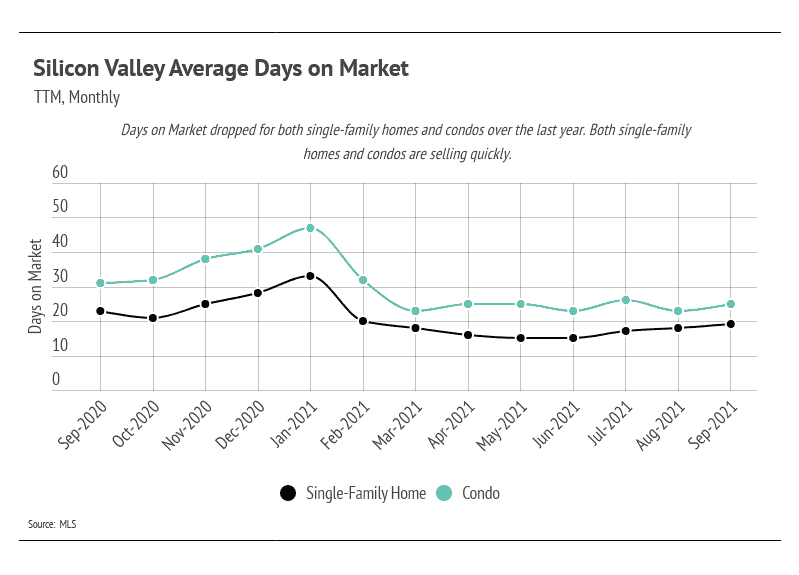
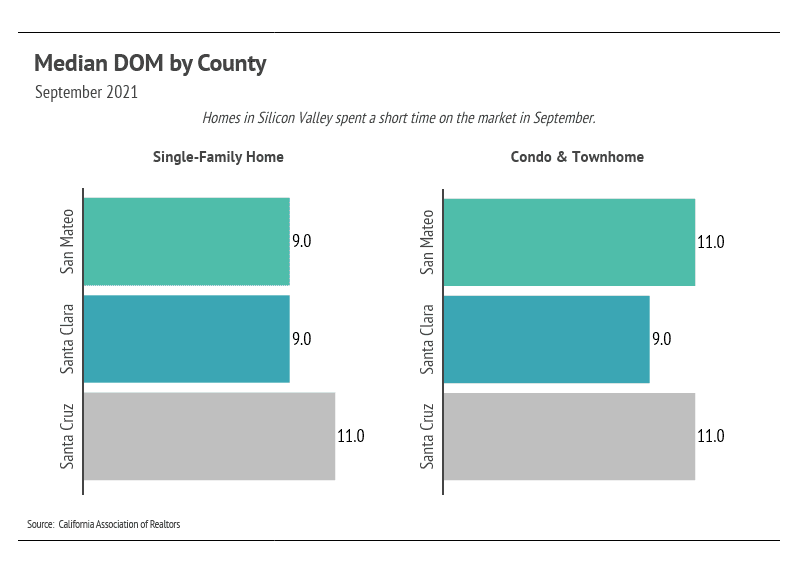
Homes are selling faster than at any point in the last 15 years. The Days on Market reflects the high demand for homes in Silicon Valley. Buyers must put in competitive offers, which, on average, are 1–5% above the list price of the home.
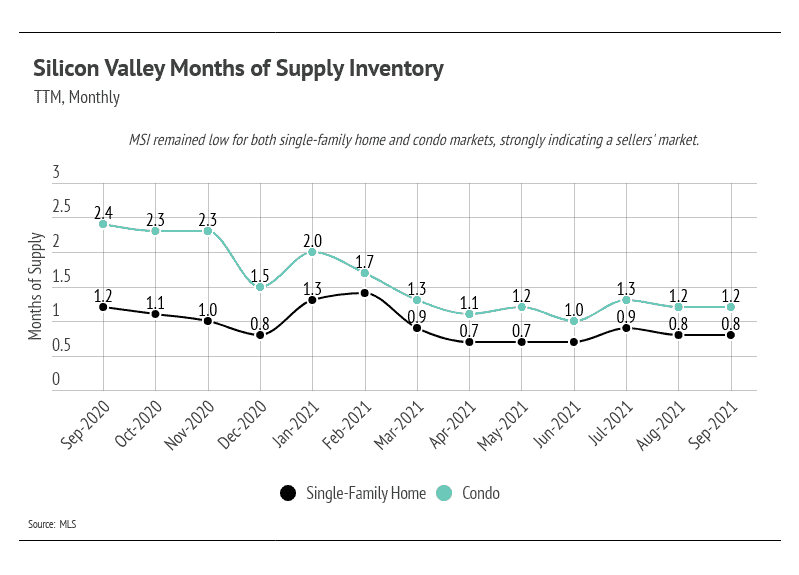
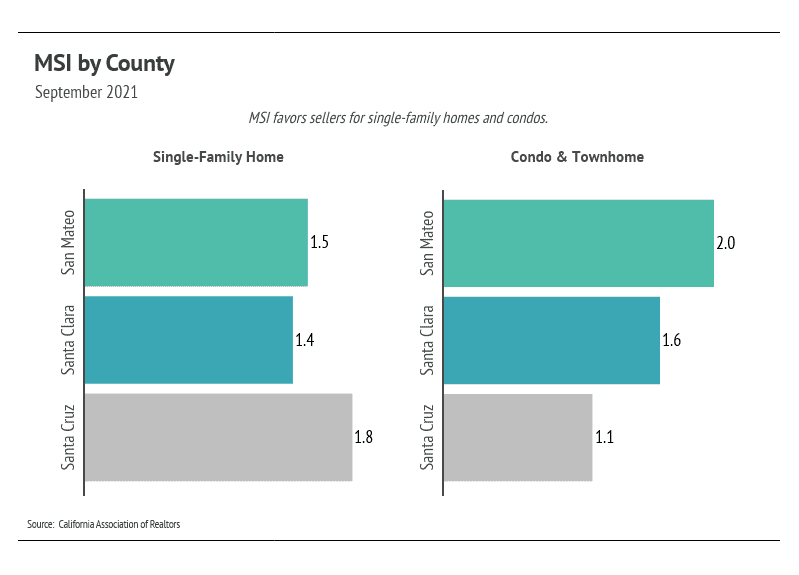
Months of Supply Inventory (MSI) quantifies the supply/demand relationship by measuring how many months it would take for all current homes for sale on the market to sell at the current rate of sales. The average MSI is three months in California, which indicates a balanced market. An MSI lower than three indicates that there are more buyers than sellers on the market (meaning it’s a sellers’ market), while a higher MSI indicates there are more sellers than buyers (meaning it’s a buyers’ market). MSIs in Silicon Valley are near all-time lows for single-family homes and condos, indicating a sellers’ market in all markets.
Local Lowdown Data
Stay up to date on the latest real estate trends.

Michelle Kim | May 22, 2026
A closer look at how buyers are comparing condos and single-family homes in the 2026 San Francisco housing market based on lifestyle, budget, and long-term goals.

Michelle Kim | May 15, 2026
A closer look at why San Francisco buyers continue to prioritize neighborhoods near Golden Gate Park for outdoor access, walkability, and long-term livability.

Michelle Kim | May 8, 2026
A look at how Mosaik Real Estate supports Bay Area buyers and sellers through multilingual communication and local market expertise.

Michelle Kim | May 1, 2026
A closer look at San Francisco housing market trends in 2026 and what buyers and sellers should expect moving forward.

Michelle Kim | May 1, 2026
Quick Take: Median home sale prices ticked up slightly on both a month-over-month and year-over-year basis in February, continuing the holding pattern we've seen in re… Read more

Michelle Kim | May 1, 2026
Quick Take: Median sale prices rebounded in Sonoma County with a 1.16% year-over-year gain, while Napa County continued to struggle with a 10.61% decline. Inventory re… Read more
You’ve got questions and we can’t wait to answer them.