The Local Lowdown
Quick Take:
- The San Francisco housing market is cooling after reaching all-time-high prices earlier this year.
- Sales and new listings are on the decline, continuing the two-year downward trend in active listings. Softening demand, however, is alleviating some of the pressure of tight supply.
- Months of Supply Inventory indicates that the market is trending toward more balance between buyers and sellers.
Note: You can find the charts/graphs for the Local Lowdown at the end of this section.
Price contraction after rapid growth is normal
When we consider the increases in mortgage rates and normal seasonal trends this time of year, when prices tend to stagnate or decline slightly, the price contractions that single-family homes experienced in the second half of this year aren’t alarming. Yes, we are moving into a new chapter in the housing market that doesn’t involve astronomical price increases and 20 offers the first day the home gets listed, but that’s actually a good thing. Single-family home prices in San Francisco grew considerably in 2021 and the first half of 2022, and a contraction is a normal response to that sort of growth. We are now entering a stage of slower growth — but still growth. Real estate has shown itself to be one of the best investments in recent history and is, on average, the largest store of wealth for an individual or family. Price appreciation will likely move to a more normal growth rate of around 5-6% in the coming years.
Fall sales slowdown
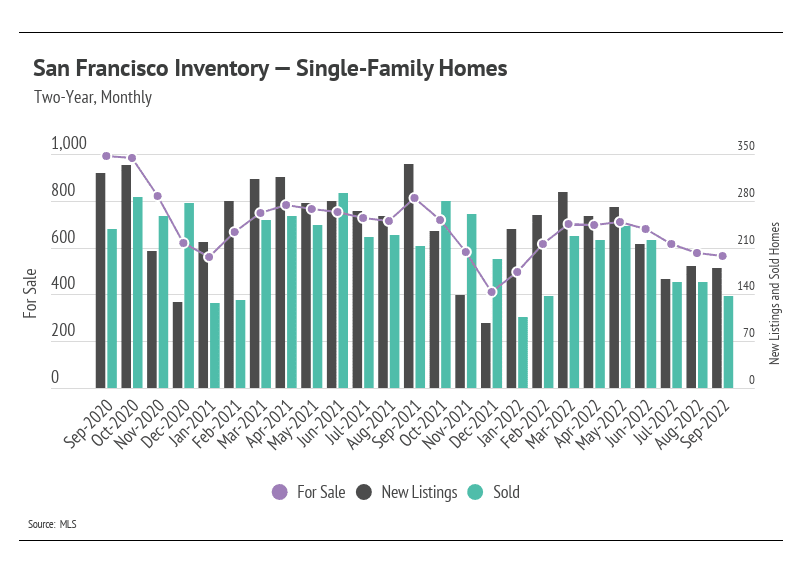
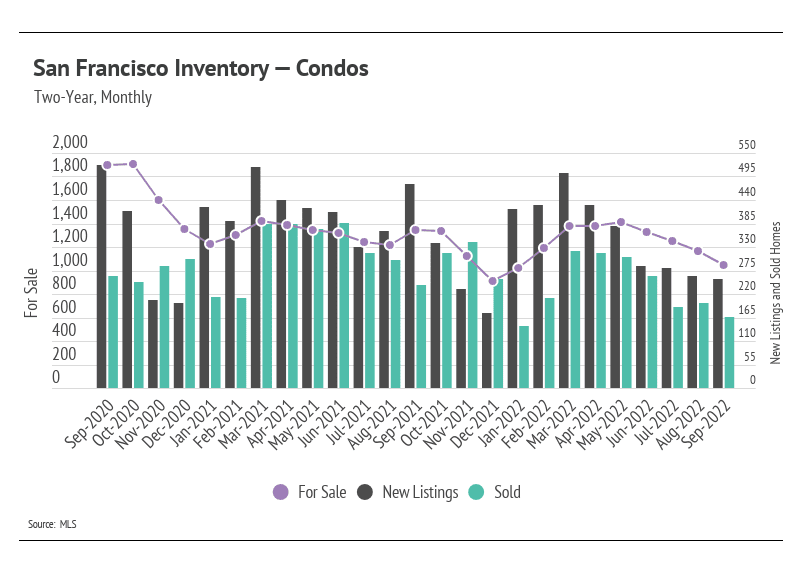
Single-family home and condo sales declined month-over-month, along with fewer new listings coming to market. This caused inventory to decline in San Francisco, a trend that will likely continue through the rest of the year. San Francisco, along with the rest of the country, has not returned to pre-pandemic inventory levels. Homes have generally sold faster over the past two years, making new listings more and more important to the market. Inventory generally grows when new listings increase or homes sit on the market. With rates rising at such a rapid pace, new listings are slowing considerably, having dropped 25% from the second quarter of 2022 to the third. Last year, they only dropped 5%. We can tie new listings not only to supply, but to demand as well, because sellers are often buying, too. Softening demand has brought the market closer to balance despite low inventory.
Months of Supply Inventory trends toward a balanced market for single-family homes
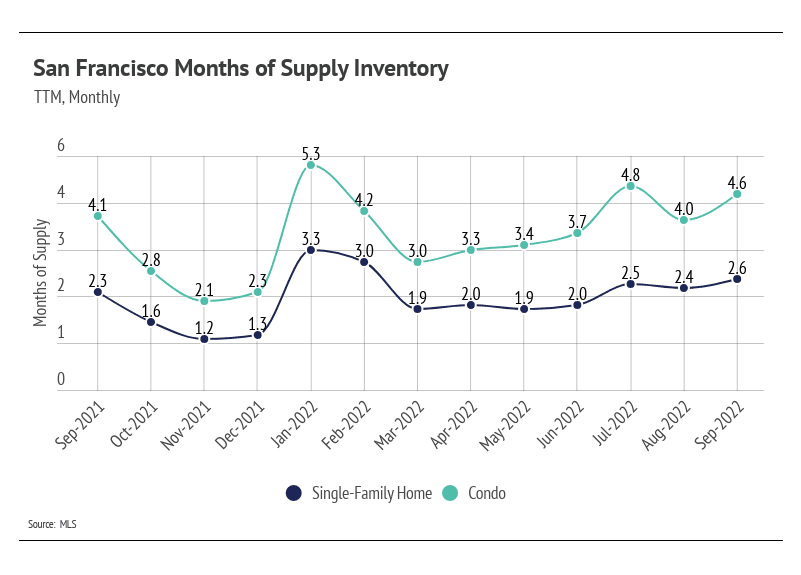
Months of Supply Inventory (MSI) quantifies the supply/demand relationship by measuring how many months it would take for all current homes listed on the market to sell at the current rate of sales. The long-term average MSI is around three months in California, which indicates a balanced market. An MSI lower than three indicates that there are more buyers than sellers on the market (meaning it’s a sellers’ market), while a higher MSI indicates there are more sellers than buyers (meaning it’s a buyers’ market). MSI has drifted higher (toward balance) over the past six months but remained below three months of supply for single-family homes, indicating we are still in a sellers’ market. Condo MSI, however, has remained above three for six months, implying the market favors buyers.
Local Lowdown Data