The Local Lowdown: January 2023

Michelle Kim  |  January 1, 2023

The Local Lowdown: January 2023

The Local Lowdown

Quick Take:

    • The Bay Area housing market has cooled considerably in the second half of 2022, a trend that will likely continue through the winter months.
    • The decline in demand has opened more opportunities for buyers in the market this winter.
    • Months of Supply Inventory indicates the market still favors sellers broadly, but we are seeing more variability across county and dwelling types.
     
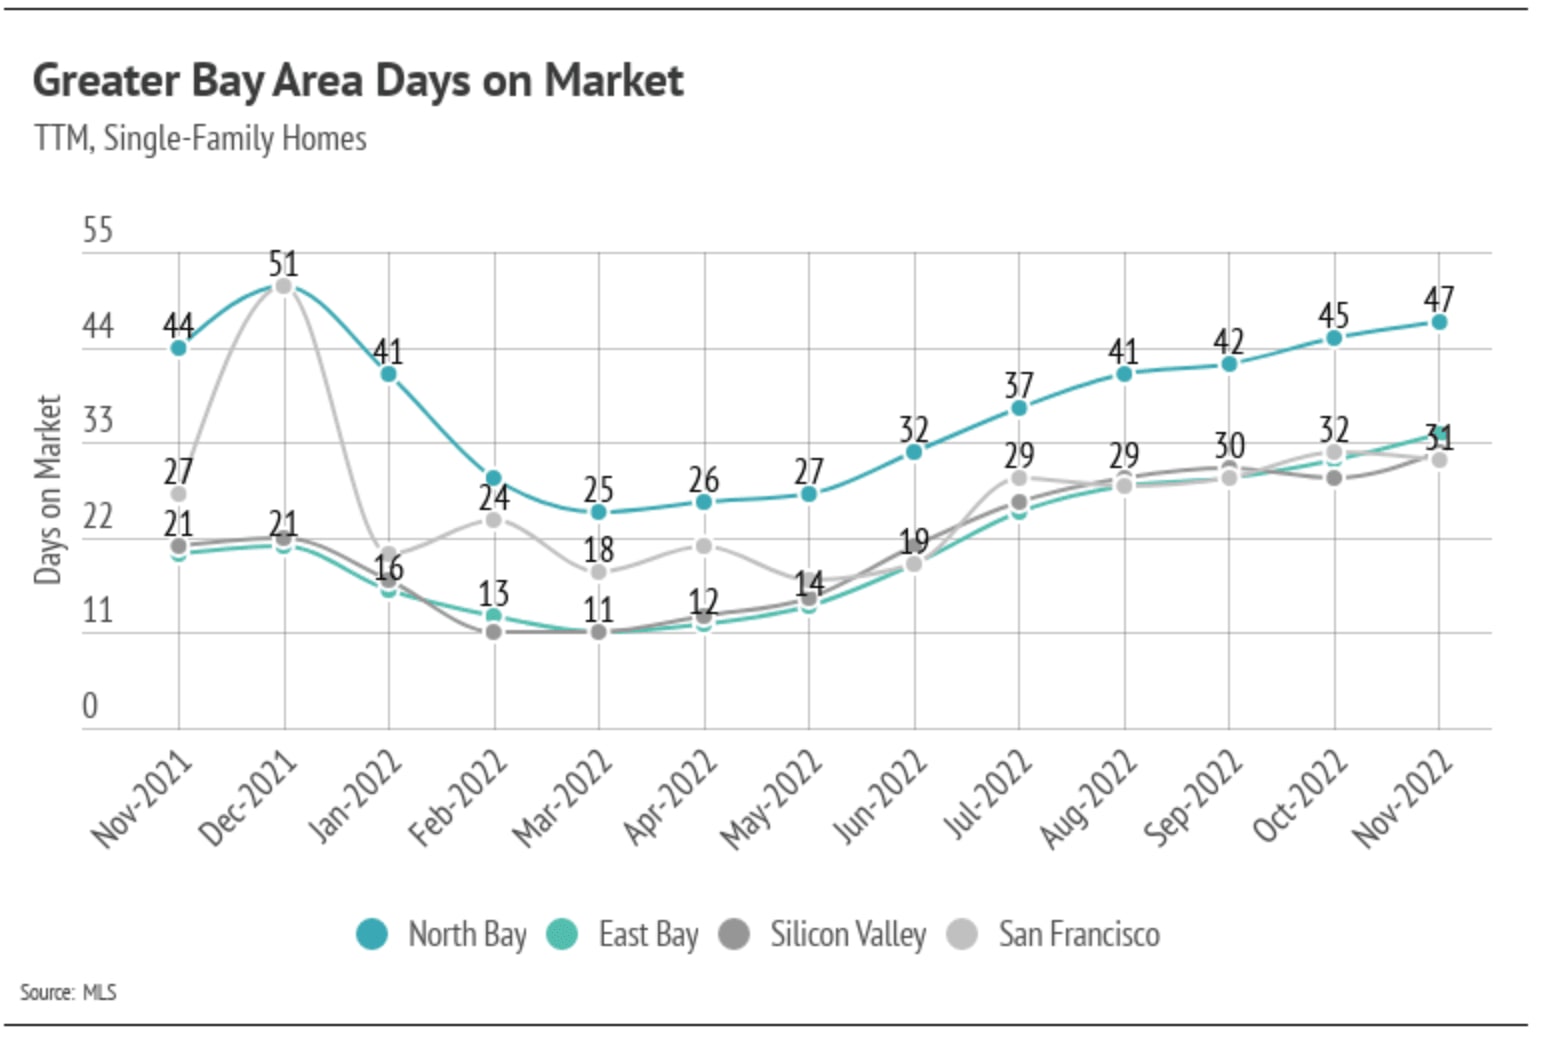
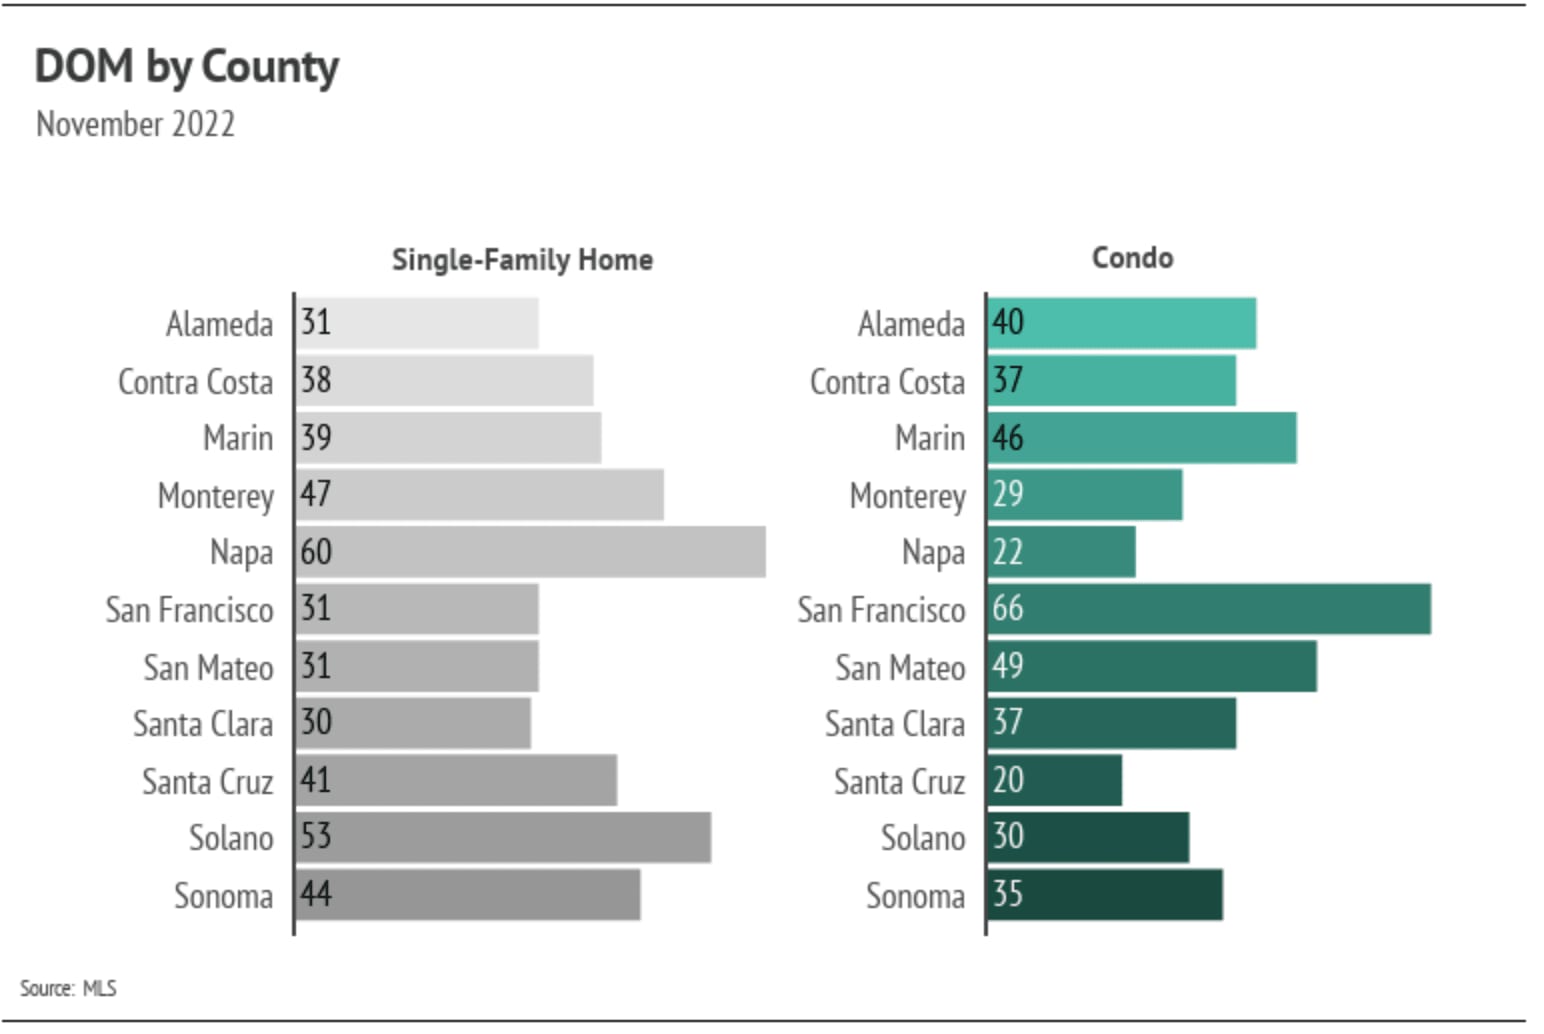
    Note: You can find the charts/graphs for the Local Lowdown at the end of this section.
     

Entering the holiday slowdown

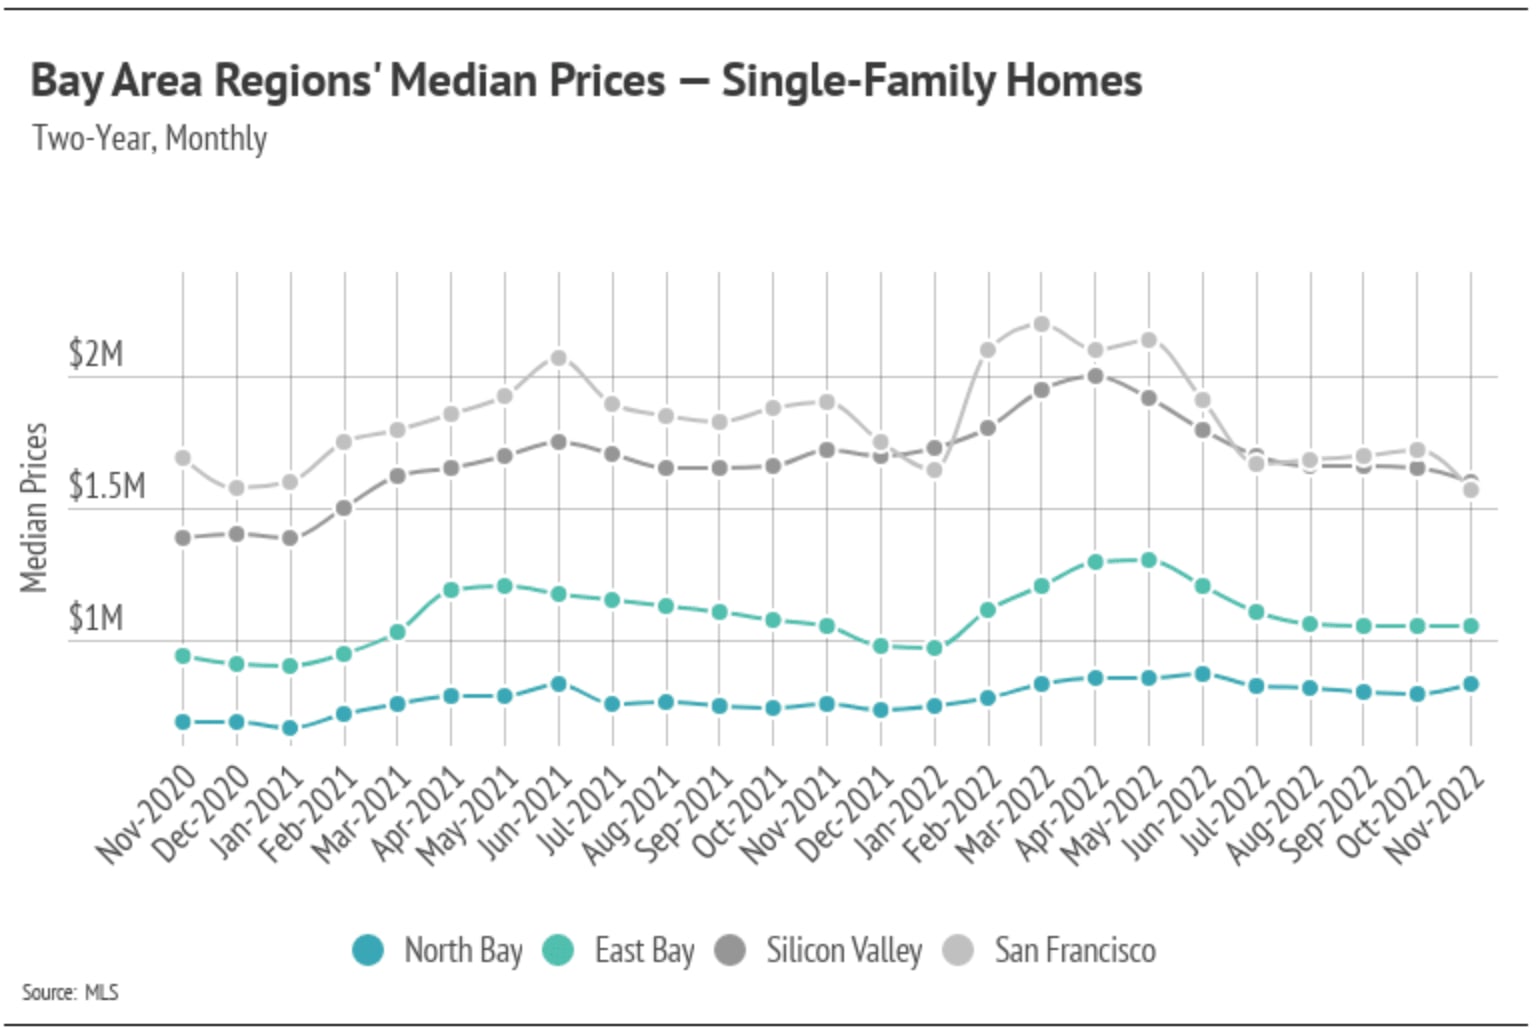
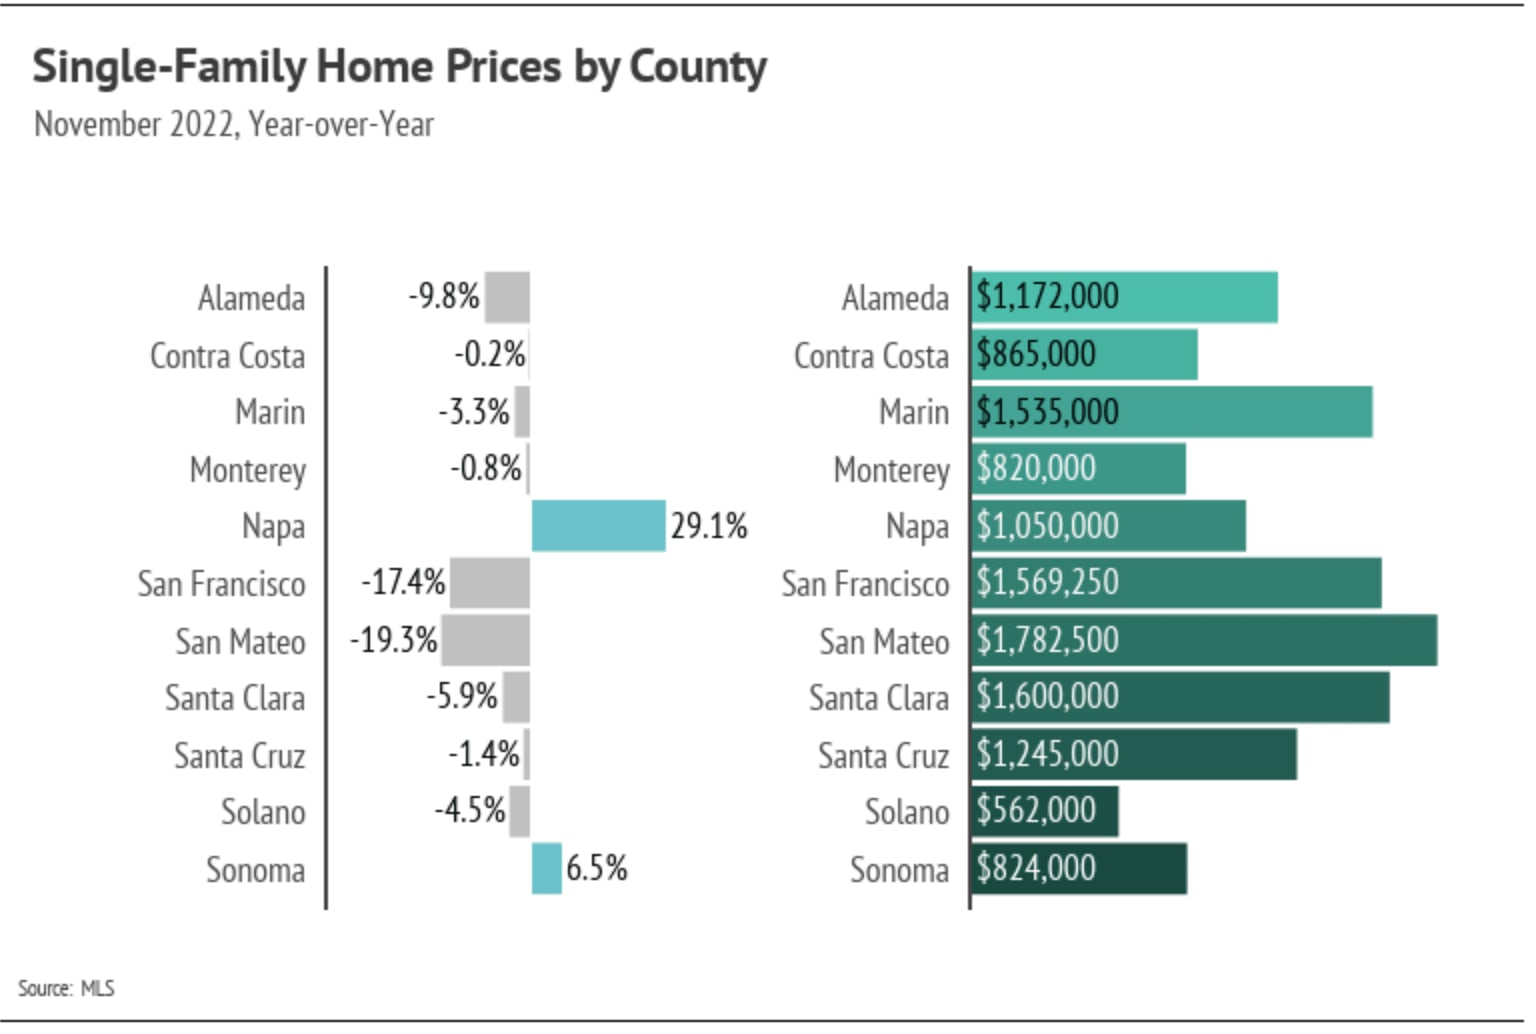
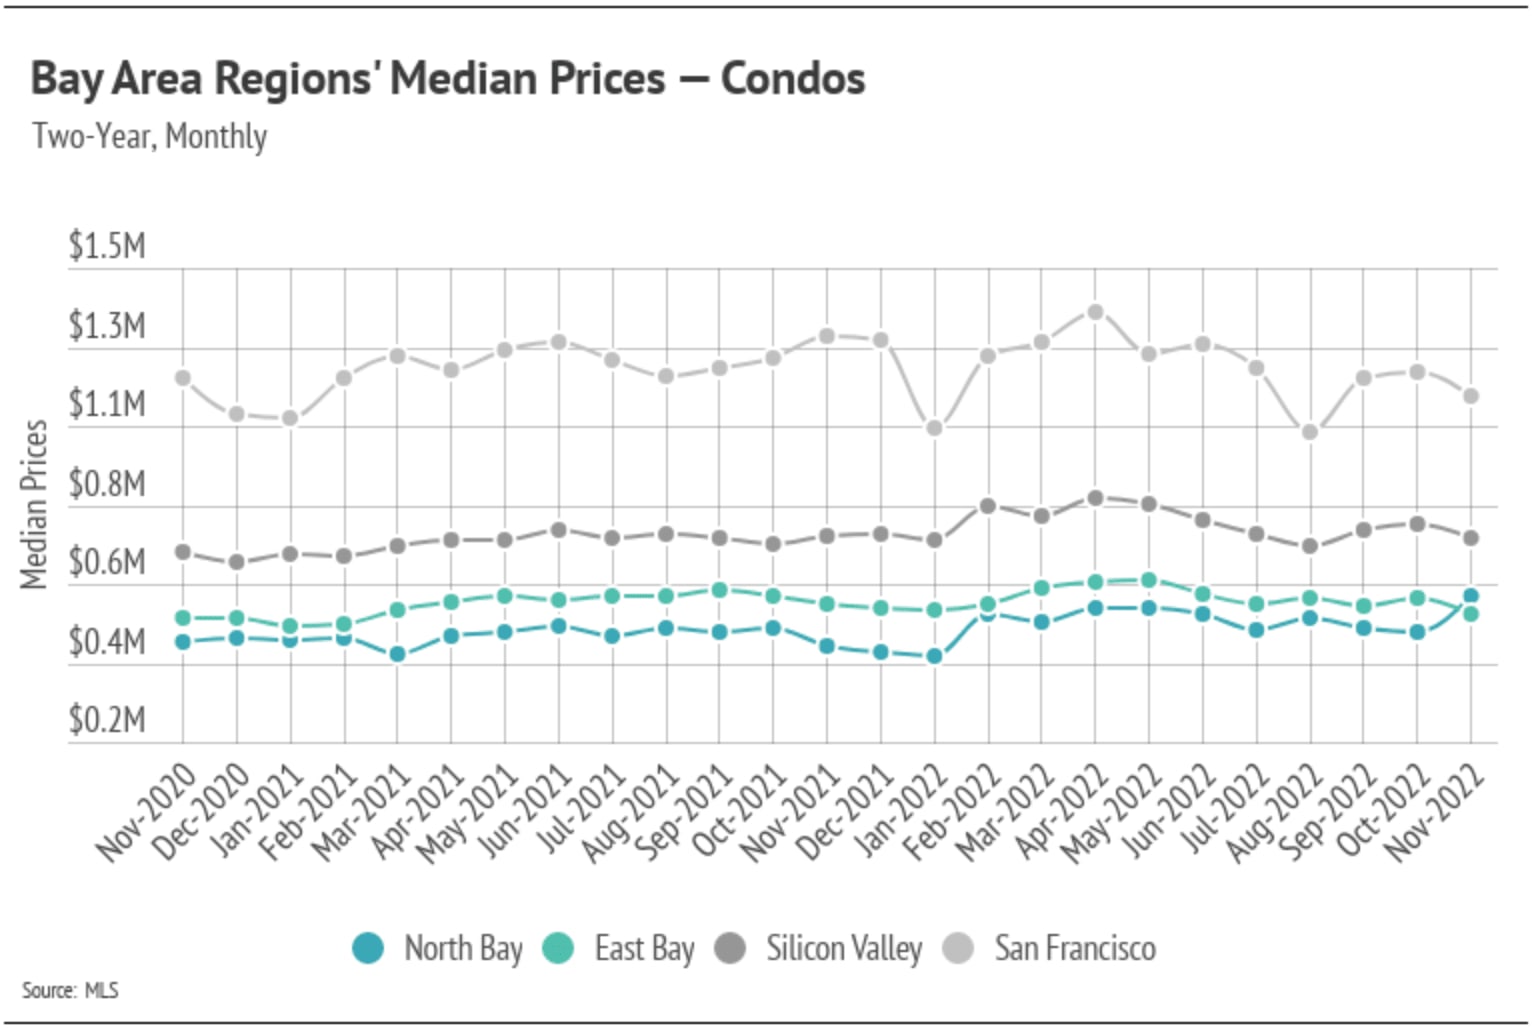
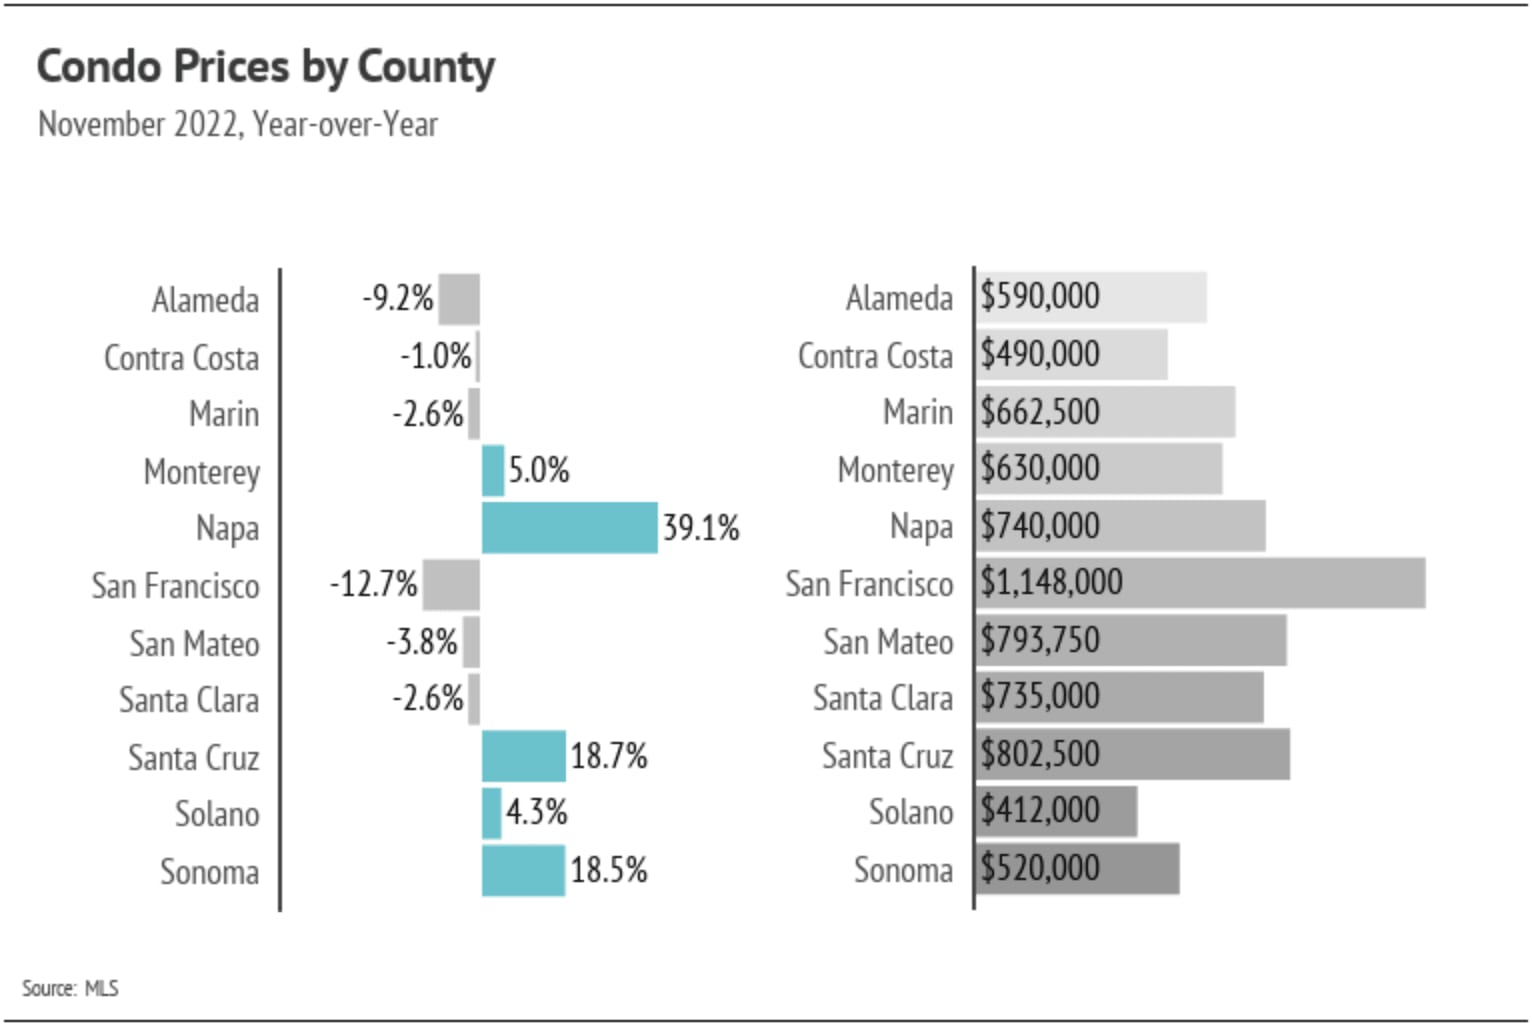
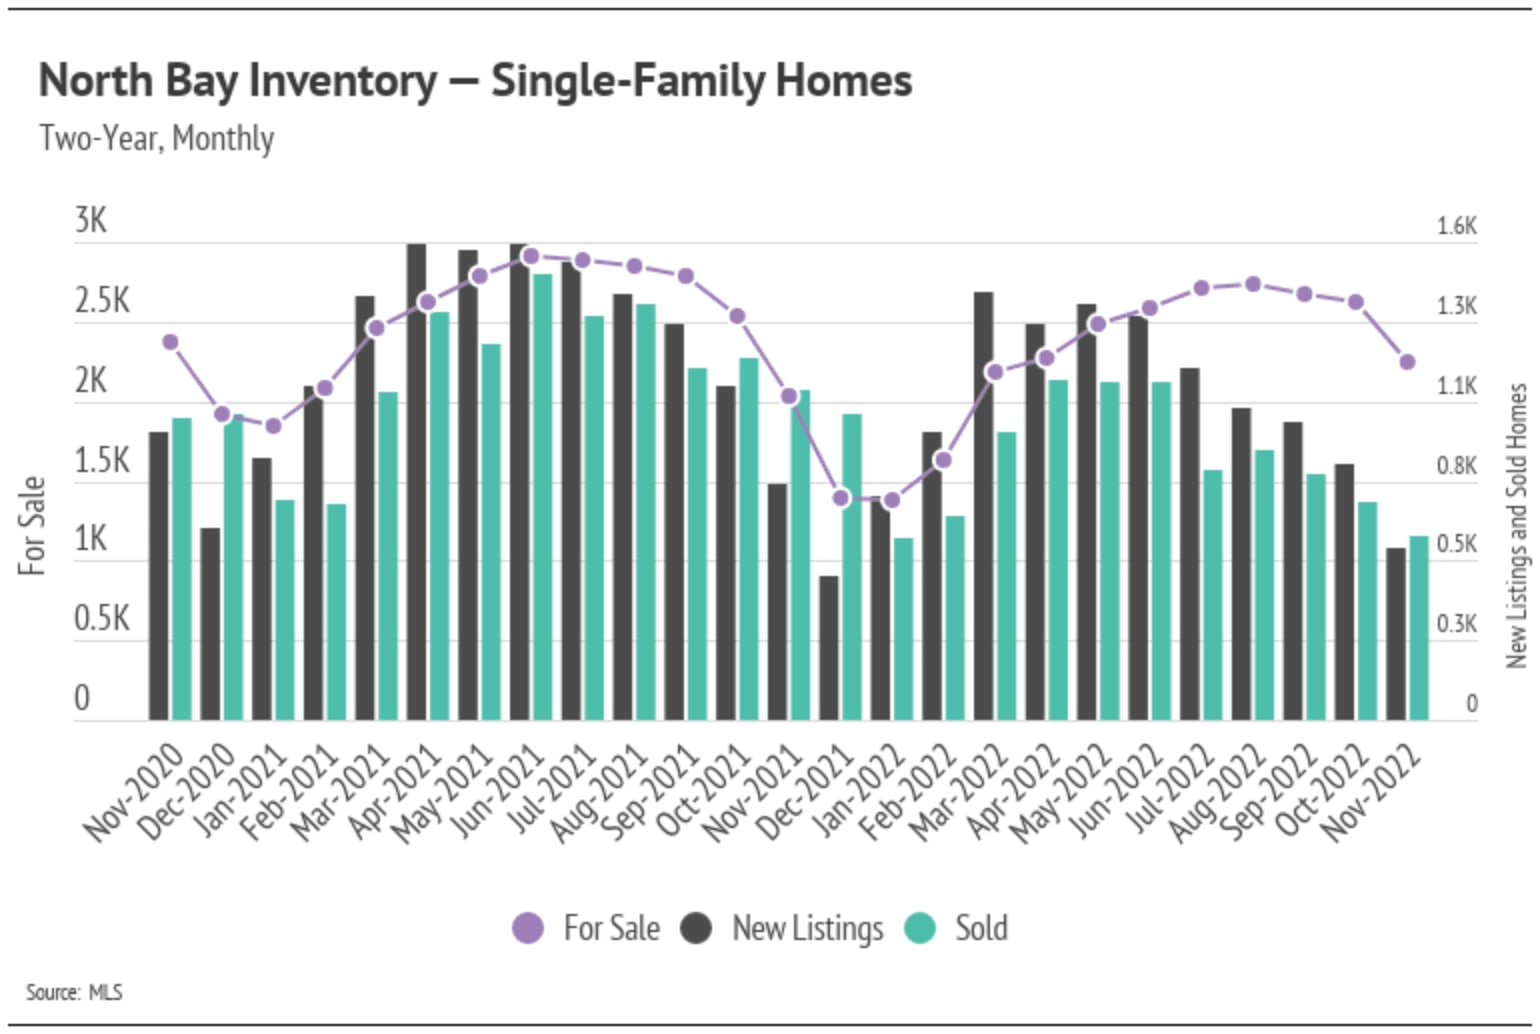
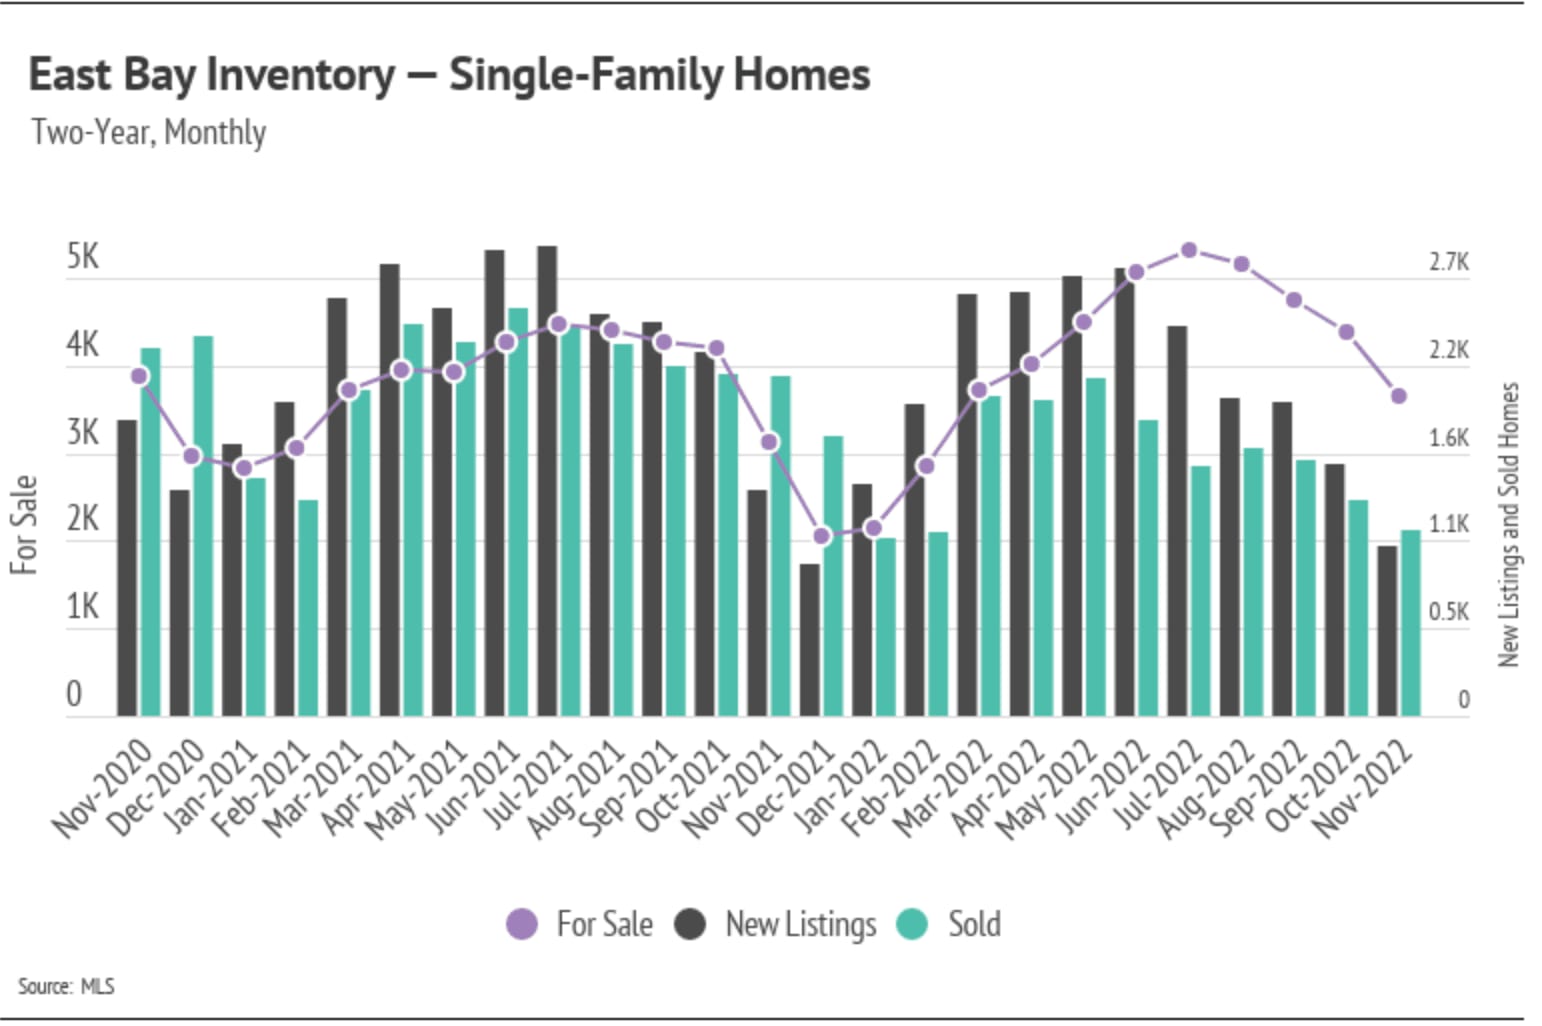
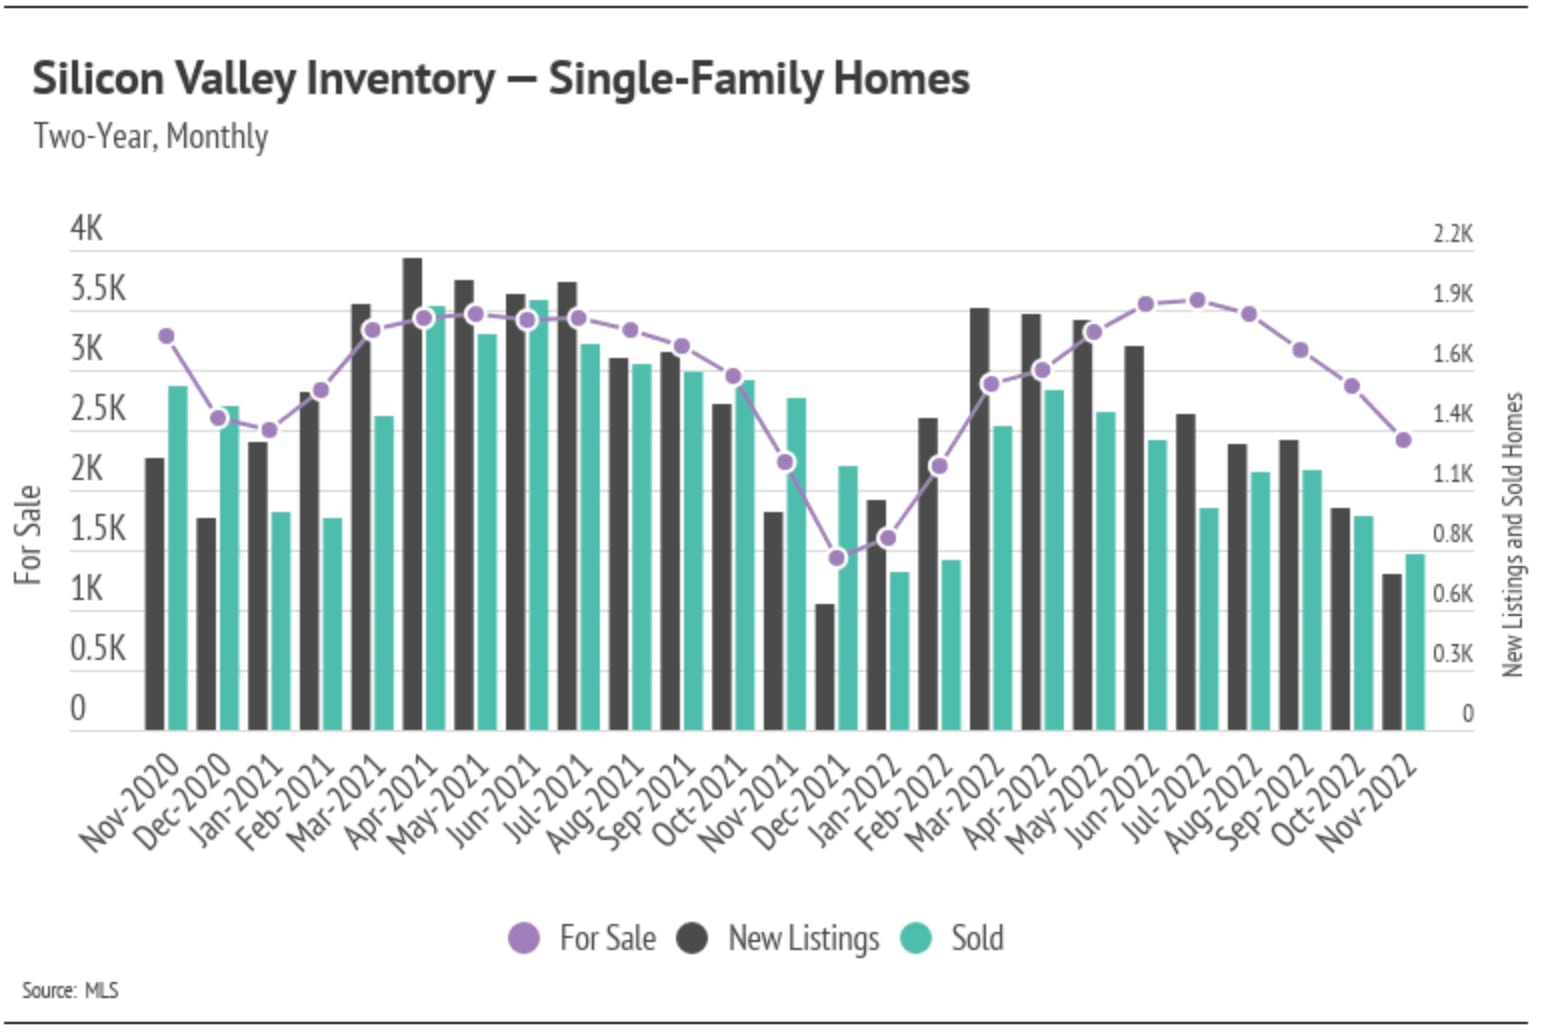
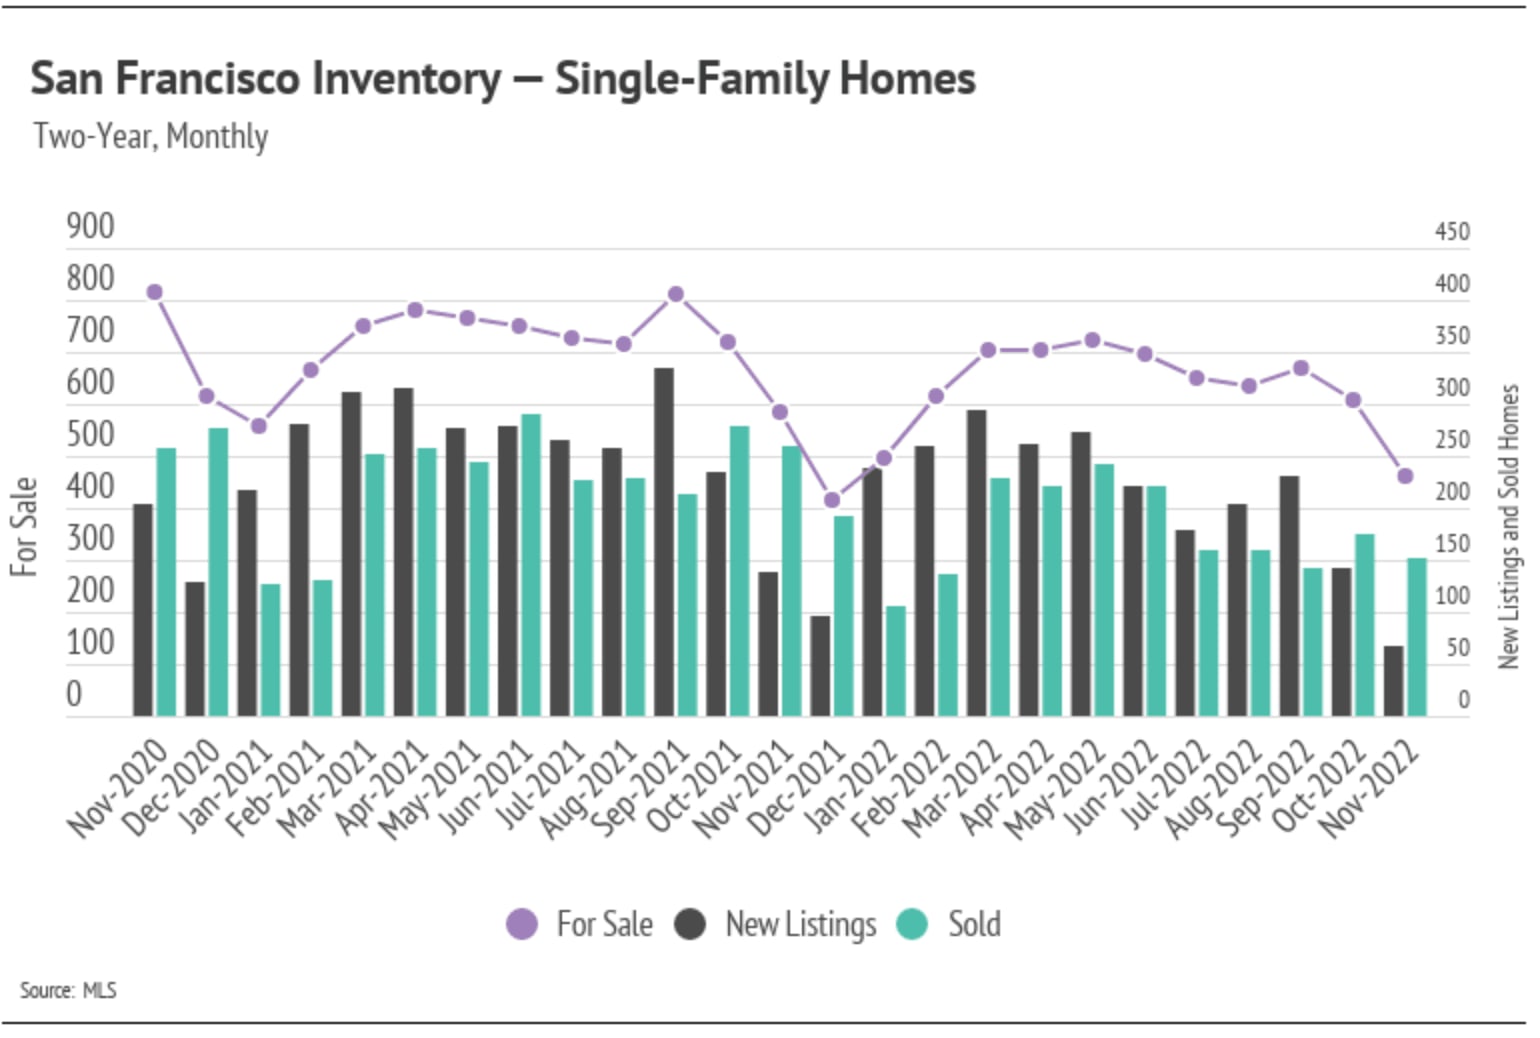
As we mentioned in the Big Story, the market is cooling on both the buy and the sell sides. When there are fewer sellers, there are also fewer buyers, because some buyers are selling their homes to move others in the same market. New listings have declined faster than sales, causing inventory to decline near the all-time low level we experienced last winter. However, the key difference is that fewer buyers are on the market — so, even with low inventory, buyers can still find the home that’s right for them. The low inventory has insulated prices from a major reversal. In fact, the median North Bay condo price reached an all-time high in November. Although prices have contracted across most of the Bay Area, especially single-family homes in Silicon Valley and San Francisco, they have maintained price gains over the past 24 months.
 
Moving forward, prices will likely contract slightly more through the winter, which is typical. Without any signs of interest rates dropping, we’re entering a stage of slower, longer-term growth — but still growth. In the short term, however, prices may come down a little more. Real estate has shown itself to be one of the best investments in recent history and is, on average, the largest store of wealth for an individual or family. Price appreciation will likely move to a more normal growth rate of around 5-6% in the coming years, which makes for a much healthier market than what occurred in 2020 and 2021.
 

Inventory continues to decline, following seasonal trends

The Bay Area, along with the rest of the country, has not returned to anywhere near pre-pandemic inventory levels after the buying boom last year. However, we were happy to see more single-family homes come to market in the first half of the year, which drove a much-needed increase in inventory. We can compare home sales and new listings from 2021 to 2022 to see the effects of fewer homes coming to market. Fewer homes and the rising rate environment have dropped demand.
 

Months of Supply Inventory still indicates a sellers’ market for single-family homes

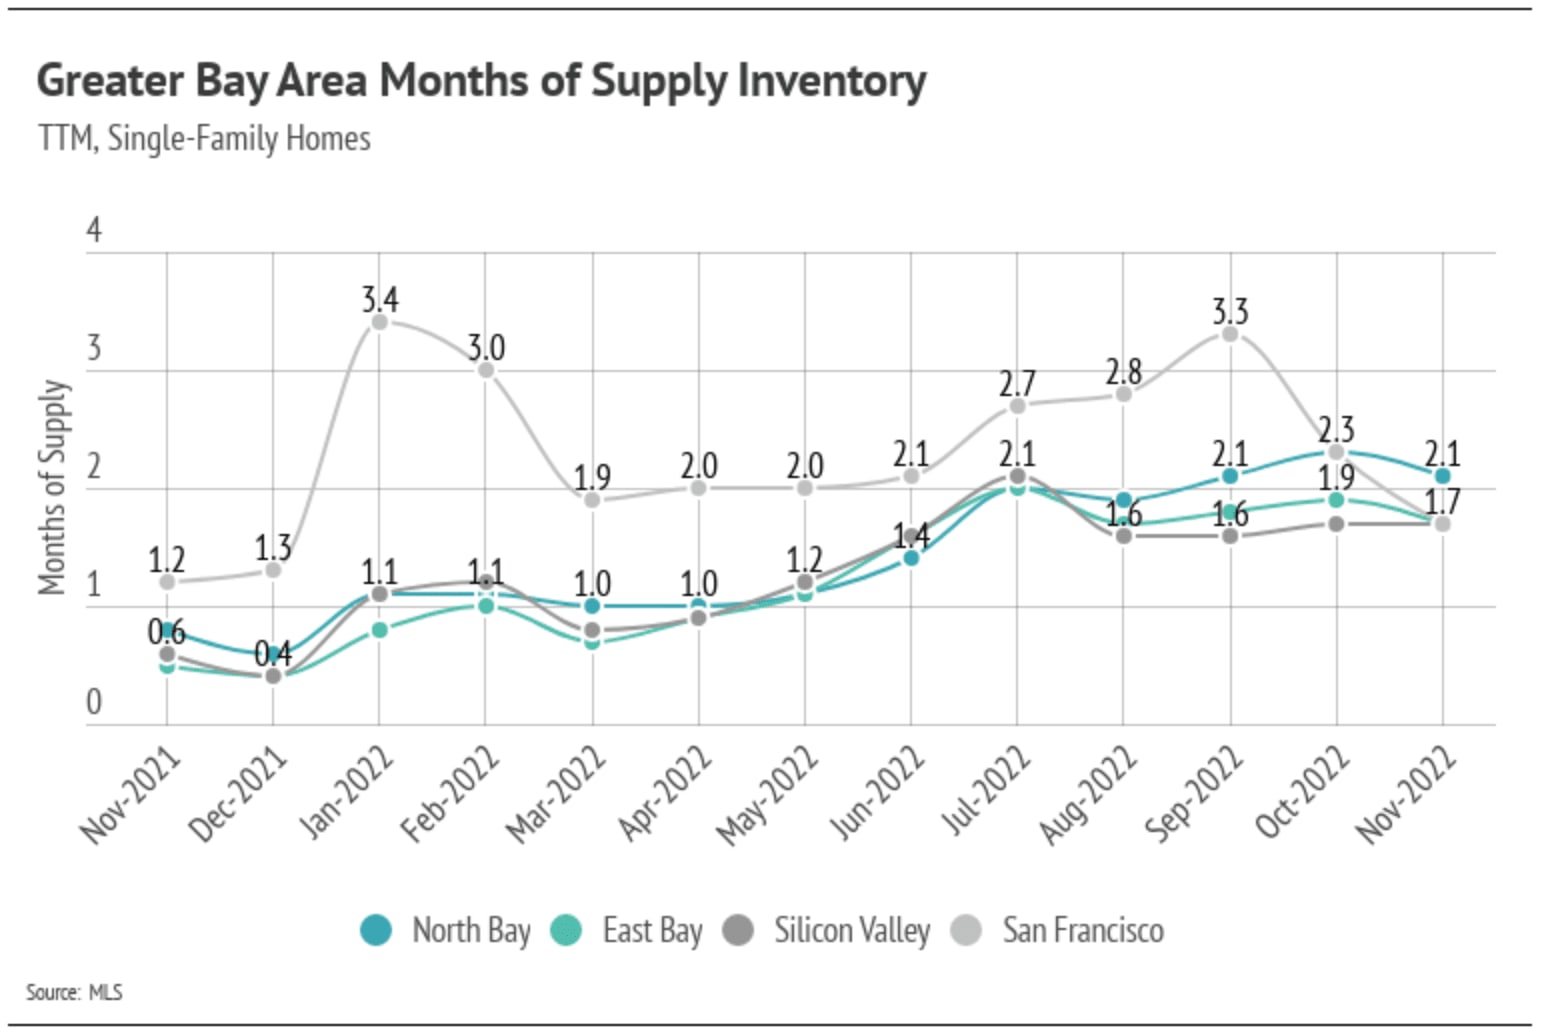
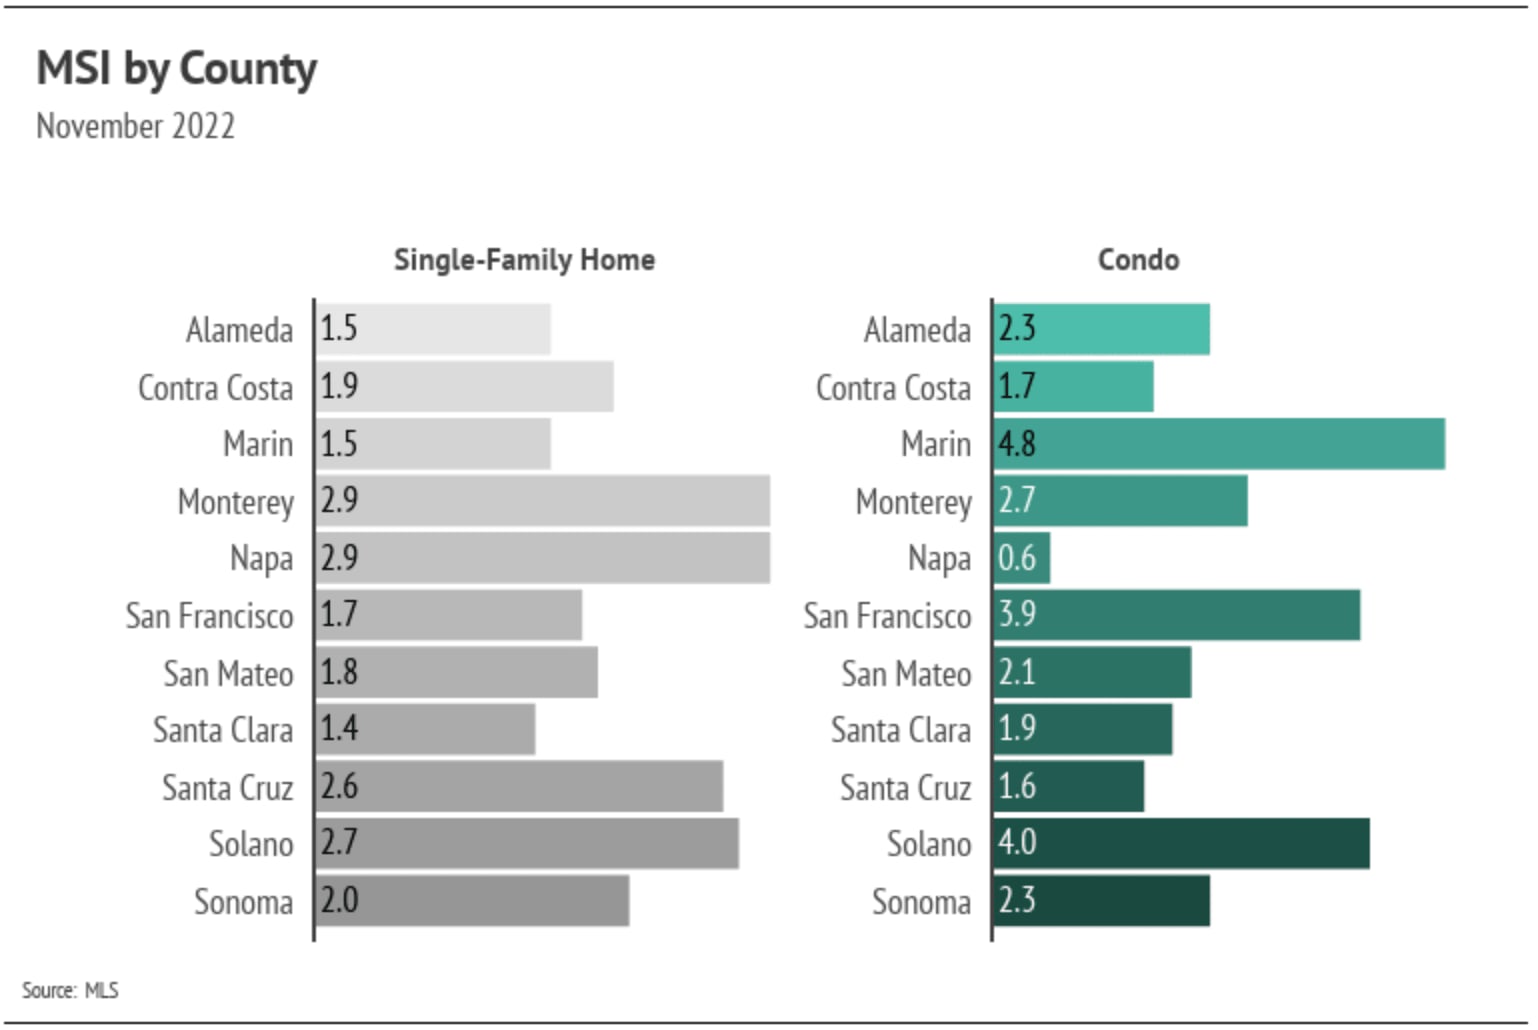
Months of Supply Inventory (MSI) quantifies the supply/demand relationship by measuring how many months it would take for all current homes listed on the market to sell at the current rate of sales. The long-term average MSI is around three months in California, which indicates a balanced market. An MSI lower than three indicates that there are more buyers than sellers on the market (meaning it’s a sellers’ market), while a higher MSI indicates there are more sellers than buyers (meaning it’s a buyers’ market). MSI has trended higher (from a sellers’ market toward balance) since spring, but despite the changing market environment, single-family home MSI still indicates a sellers’ market, but just barely for Monterey and Napa counties. The condo markets still mostly favor sellers, with the exception of the Marin, San Francisco, and Solano markets, which favor buyers.
 

Local Lowdown DataSuburban street lined with detached homes and real estate signs for sale and rent.Suburban homes along a curving street, with real estate signs and hills in the distance.A real estate professional reviews market charts on a tablet at a desk.Suburban neighborhood of two-story homes with leafless trees and several FOR SALE signs.Snow-dusted suburban homes with garages, cars, and FOR SALE signs along a neighborhood street.Suburban neighborhood at dusk with red-tile roofs and several FOR SALE signs.Illustrated suburban neighborhood with autumn trees, curving streets, and hills at dusk.Aerial view of a suburban neighborhood with detached homes along a central road.

Line chart compares monthly single-family home median prices in four Bay Area regions, November 2020–November 2022.Chart of November 2022 home prices and year-over-year changes across 11 Bay Area counties.Chart of monthly median condo prices across four Bay Area regions from November 2020 to November 2022.Chart of November 2022 condo prices and year-over-year changes across 11 counties; Napa rises most, San Francisco falls most.Chart of North Bay single-family home inventory, new listings, and sales from November 2020 to November 2022.Chart of East Bay single-family home listings, sales, and inventory from November 2020 to November 2022.Chart of Silicon Valley single-family home inventory, new listings, and sales from November 2020 to November 2022.Chart of San Francisco single-family home inventory from November 2020 to November 2022, comparing homes for sale, new listings, and sold homes.Greater Bay Area days-on-market chart comparing four regions from November 2021 to November 2022.November 2022 days-on-market chart by county, comparing single-family homes and condos.Greater Bay Area single-family home inventory chart by region, November 2021 to November 2022; San Francisco peaks at 3.4 months.November 2022 county MSI chart comparing single-family homes and condos across 11 counties.Snow-dusted suburban homes with garages, cars, and FOR SALE signs along a neighborhood street.

We Would Love to Meet You!

You’ve got questions and we can’t wait to answer them.