East Bay Real Estate Market Report: December 2020
michelle December 2, 2020

michelle December 2, 2020
Welcome to our December newsletter. This month, we take a look at the ways in which current U.S. economic conditions are affecting local, state, and national real estate markets. In particular, we examine some crucial economic indicators, such as third-quarter Real Gross Domestic Product (GDP)1 and new housing permits. Although California’s COVID-19 cases remain fewer per capita than those of most other states, cases are rising in California, and the United States as a whole is seeing new peaks every day. Even amidst this uncertainty, demand for homes has never been higher. Mortgage rates continue at all-time lows, and buyers are devoting more of their total spending to housing costs. As we make our way through the autumn months, we continue to provide you with the most up-to-date market information so that you feel supported and informed in your buying and selling decisions.
In this month’s newsletter, we cover the following:
–
1 Real GDP is inflation-adjusted GDP. All references to GDP use Real GDP figures.
2 33.1% annualized.
In this issue, we dive into some key economic indicators that tend to affect long-term home prices. GDP and employment together explain much of the economic climate and typically trend with housing prices, but they do not explain the current rise in home prices. We will still go over the ins and outs of these indicators, however, because they have received so much press and may affect home prices in the future.
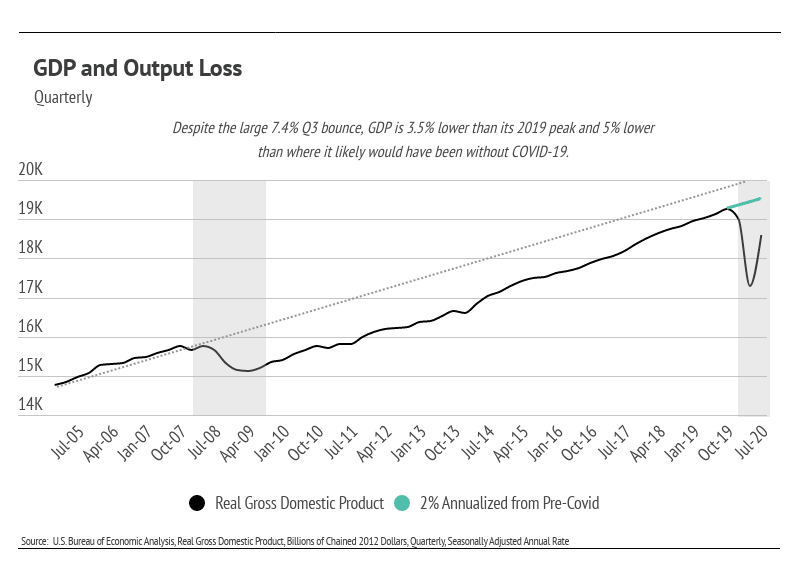
The U.S. Bureau of Economic Analysis reported a 7.4% third-quarter gain to GDP, which is the broadest measure of goods and services produced. During the second quarter of 2020, GDP dropped 9.5% quarter-over-quarter. The second-quarter drop was so sharp that the third-quarter bounce was expected. The long-term effects of the initial drop, however, have yet to be seen. Economists expect lower fourth-quarter GDP growth, which will not make up all the ground lost in the second quarter. Ultimately, the loss in GDP will likely be permanent.
The chart below illustrates the cost of a recession. While it depicts U.S. GDP from 2005 to present, it illustrates economic patterns that occur in all recessions. GDP tends to grow at a fairly consistent rate during economic expansions. The dotted line in the chart represents the predicted GDP had the 2008 financial crisis never happened, and the green line illustrates the expected third-quarter 2020 GDP had the pandemic never happened. As that green line shows, we are 40% below where GDP was expected to be this fourth quarter. In other words, we are still underwater despite the impressive third-quarter 2020 increase in GDP.
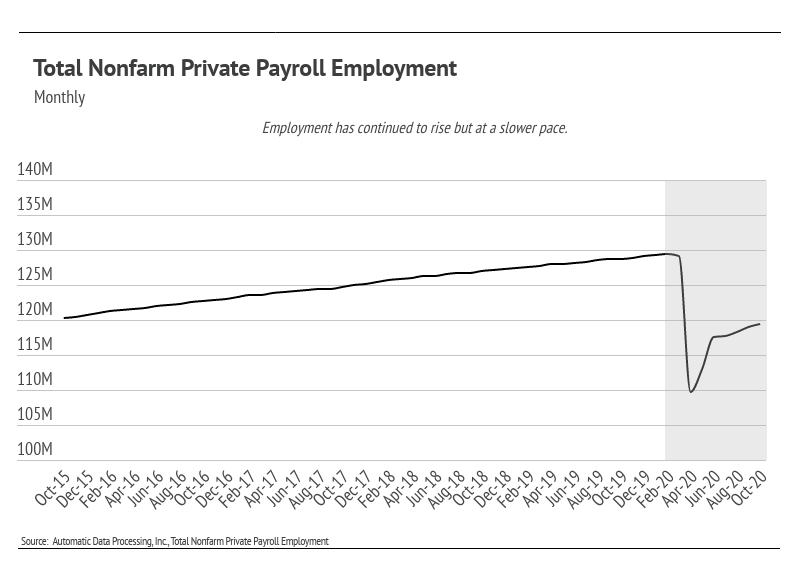
As of October, the Bureau of Labor Statistics reported that 11.1 million workers remained unemployed, which is an unemployment rate of 6.9%. However, the number of out-of-work individuals collecting unemployment insurance has dropped to 7.3 million. In September, the number of unemployed workers and the number of those collecting unemployment insurance were roughly the same. The large number of unemployed workers without government assistance will affect the rental market first, because those working in the hospitality and leisure industries have been most affected by unemployment, and those individuals tend to be renters rather than homeowners.
The employment level does matter in the long term, particularly for the housing market. Disposable personal income and savings, which both dropped in the third quarter, are two of the most important factors when considering whether or not to buy a home. As a result, we will continue to monitor these numbers.
Despite suboptimal major indicators, housing prices have risen considerably. Nationally, home prices have never been higher, and the high demand for single-family homes has dropped the Months of Supply Inventory to the lowest level ever, according to the National Association of Realtors. Months of Supply Inventory is an important marker of real estate market health because it measures how many months it would take for all current homes for sale on the market to sell at the current rate of sales. Low Months of Supply Inventory means that there is a high demand for homes that will push prices higher more rapidly.
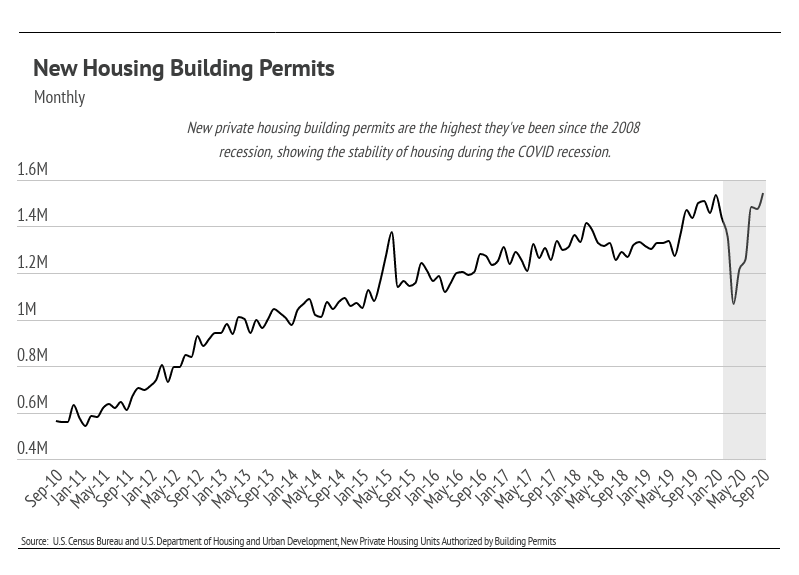
Not only are sales of existing homes up, but so are home building permits. The number of home building permits is the highest it’s been since the housing bubble burst in 2006.
The rise in housing demand and price under the current economic scenario speaks to three factors: (1) the asymmetric effect of the pandemic on personal income; (2) monetary policy (low interest rates); and (3) buyer preference. Many people have not experienced negative financial effects from the pandemic. An average person who did not lose their job may have even gained financially through a decrease in expenses. Less opportunity for travel, entertainment, and leisure activities could result in an increase in savings. At the same time, mortgage rates are historically low (2.78% as of November 5, 2020) and will remain low for the foreseeable future, making financing higher-priced homes more affordable. And finally, because so much time is currently being spent at home, buyers are willing to use more of their income to create nicer living spaces, buying larger homes, luxury furniture, and new appliances.
In both the short and long terms, housing is one of the best investments one can make.
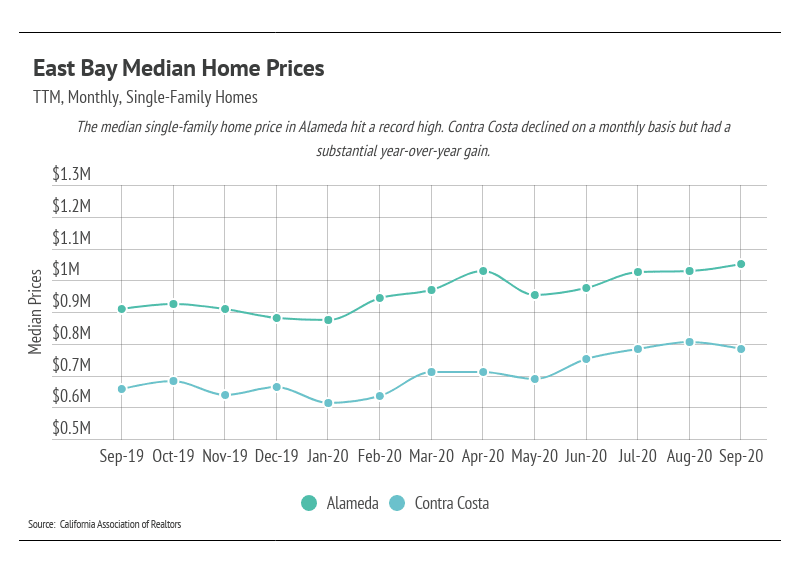
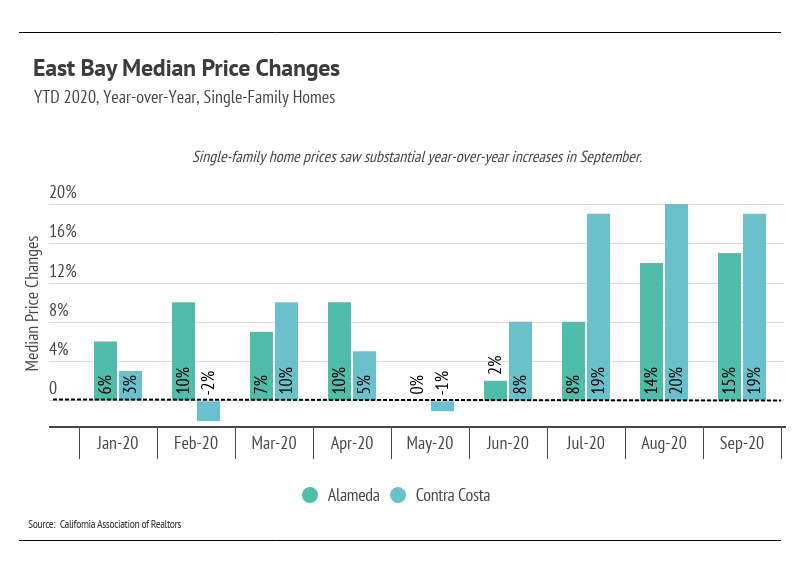
Median single-family home prices continued to substantially increase year-over-year with a median home price of $1.05 million in Alameda, an all-time high, and $783,000 in Contra Costa.
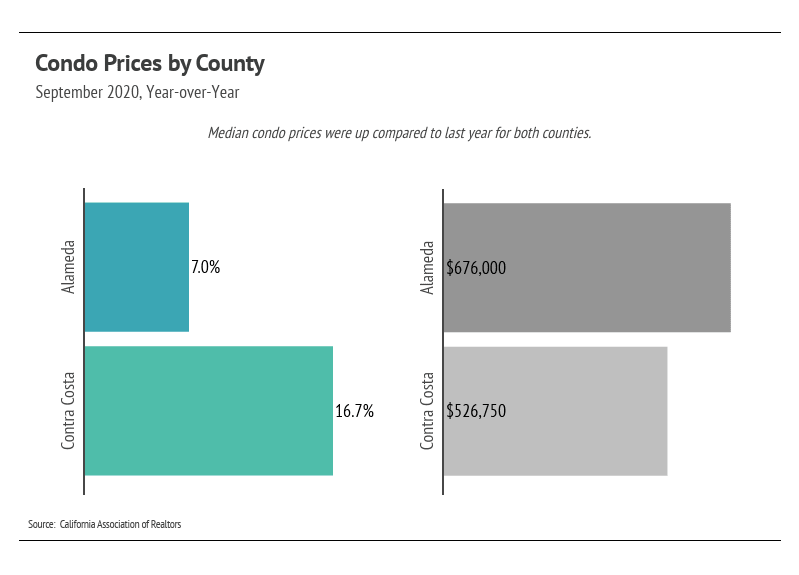
Year-over-year, median single-family home and condo prices were substantially up in both counties.
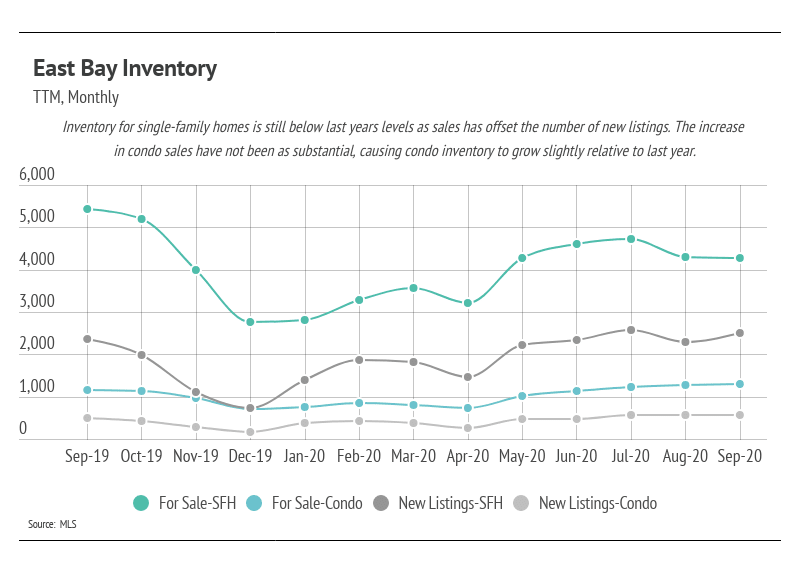
Total inventory continued to decline as the number of sold homes rose, far outpacing the new listings that came to market. Like the rest of the country, demand is outpacing new supply, which buoys East Bay home prices. Single-family home inventory is noticeably lower, and is likely to decline as we make our way into the winter months.
The number of condos on the market has increased fairly consistently since May. The demand for condos and new condos coming to market have stayed about the same each month since May with slightly more condos coming to market than bought, which has caused inventory to rise. Condo inventory is 14% higher than last year. However, demand for condos is still high.
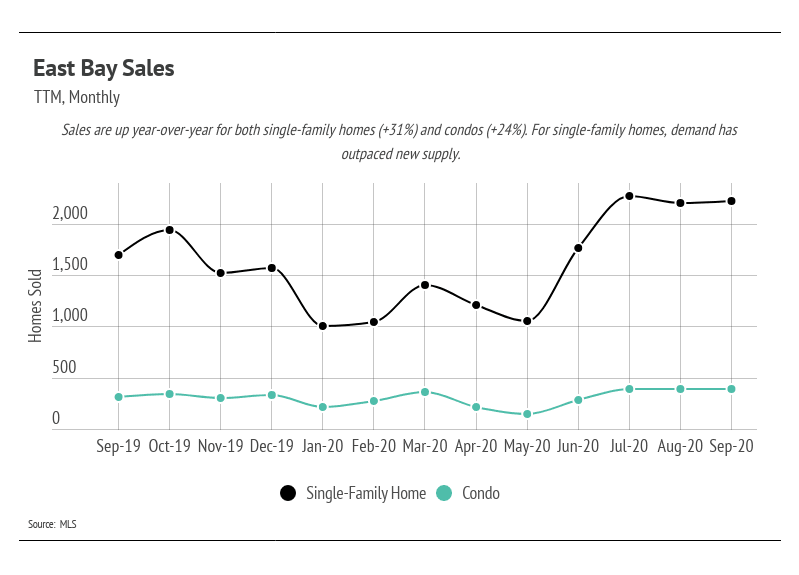
Single-family home sales have climbed since the initial months of the pandemic (March through May). Generally, buyers and sellers left the market in April and May, causing pent-up demand. Sales increased and are still near the highest level this year for single-family homes. Usually, we expect sales to decline in the autumn and winter months, but this year’s summer selling season was delayed and seems to be spilling into autumn.
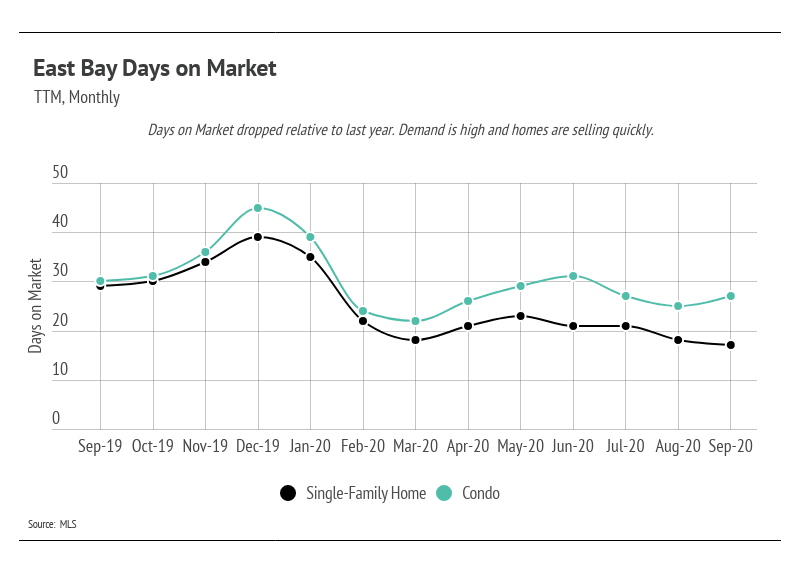
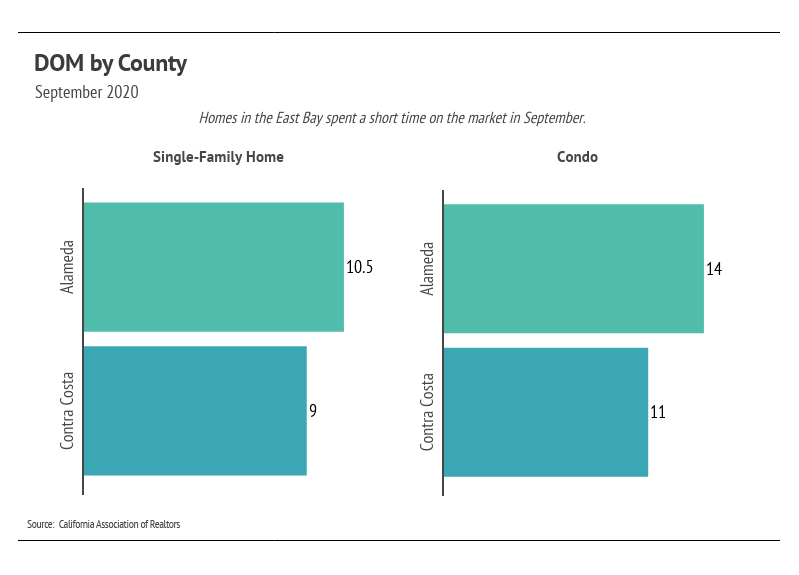
The Days on Market (DOM) is lower year-over-year. Months of Supply Inventory has continued to stay low because of the inventory decline and faster pace of sales.
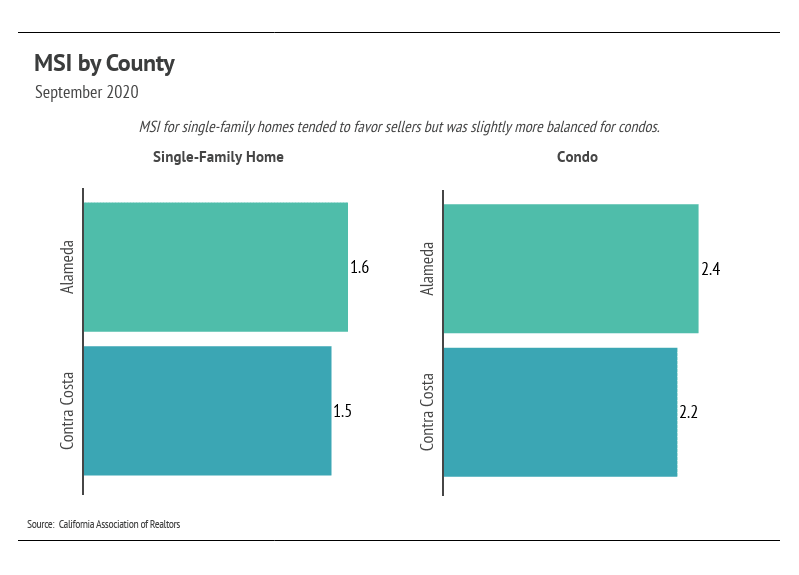
We can use Months of Supply Inventory (MSI) as a metric to judge whether the market favors buyers or sellers. The average MSI is three months in California, which indicates a balanced market. An MSI lower than three means that buyers dominate the market and there are relatively few sellers (i.e., it’s a sellers’ market), while a higher MSI means there are more sellers than buyers (i.e., it’s a buyers’ market). The MSI remained at 0.8 for single-family homes and 1.9 for condos, both favoring sellers.

In summary, the high demand in the East Bay has sustained home prices. Inventory for single-family homes will likely decline further as we enter the winter months with fewer sellers coming to market, potentially lifting prices higher. Overall, the housing market has shown its resilience through the pandemic and remains one of the safest asset classes. Economic indicators are in an anomalous state, meaning that they are out of trend with each other. The data show that housing has remained consistently strong through this period.
We anticipate new listings to slow through the holiday months. Condo prices will likely remain stable with no outsized gains or losses through the winter months. The autumn/winter season tends to see a slowdown in activity, although we may see a new trend this year with higher-than-normal sales.
As always, we remain committed to helping our clients achieve their current and future real estate goals. Our team of experienced professionals are happy to discuss the information we have shared in this newsletter. We welcome you to contact us with any questions about the current market or to request an evaluation of your home or condo.
Stay up to date on the latest real estate trends.

Michelle Kim | June 20, 2026
Answers to the most common home selling questions, from pricing and preparation to marketing, negotiations, and closing with confidence.

Michelle Kim | June 12, 2026
Buying a home? Get answers to the most common questions about financing, home searches, inspections, closing costs, and what to expect throughout the home buying proce… Read more
Michelle Kim | June 5, 2026
A guide to what buyers should evaluate when purchasing an older San Francisco home, from inspections and insurance to historic charm and long-term ownership.

Michelle Kim | May 31, 2026
Quick Take: Median home sale prices bounced back in a big way in April, as the spring selling season kicked into gear with nearly a 1% year-over-year increase. Invento… Read more

Michelle Kim | May 31, 2026
Quick Take: Median sale prices gained ground in Sonoma and Marin Counties, with year-over-year increases of 2.35% and 4.38%, respectively, while Solano and Napa Counti… Read more
Michelle Kim | May 31, 2026
Quick Take: Single-family home prices softened slightly in both counties, while the condo market remains split with Alameda declining and Contra Costa rebounding. Inve… Read more
You’ve got questions and we can’t wait to answer them.