The Local Lowdown: September 2025

Michelle Kim  |  October 1, 2025

The Local Lowdown: September 2025

The Local Lowdown

Quick Take:
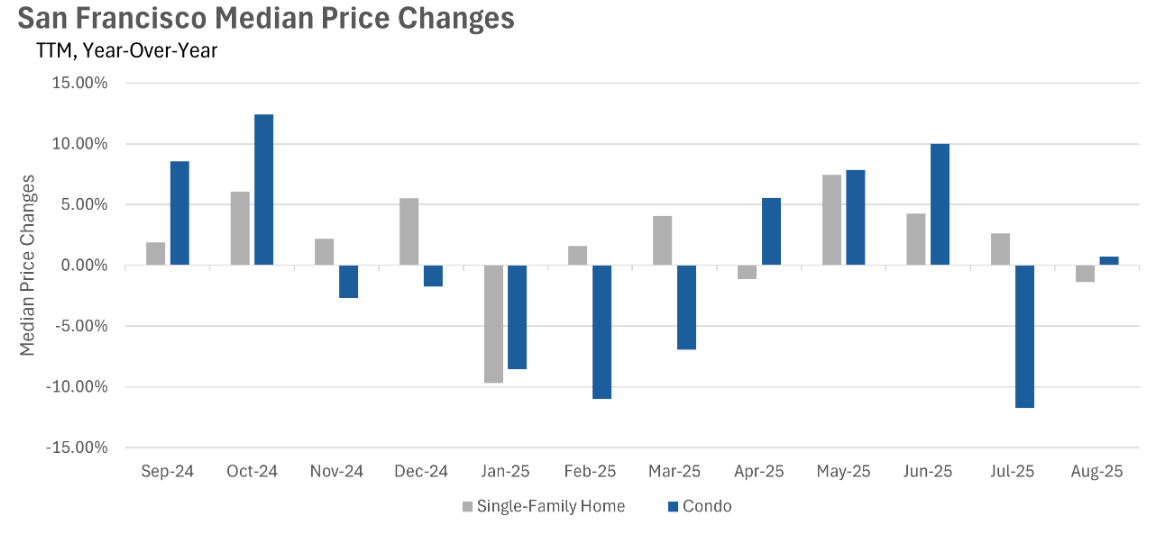
  • Median sale prices remained roughly flat on a year-over-year basis in San Francisco.
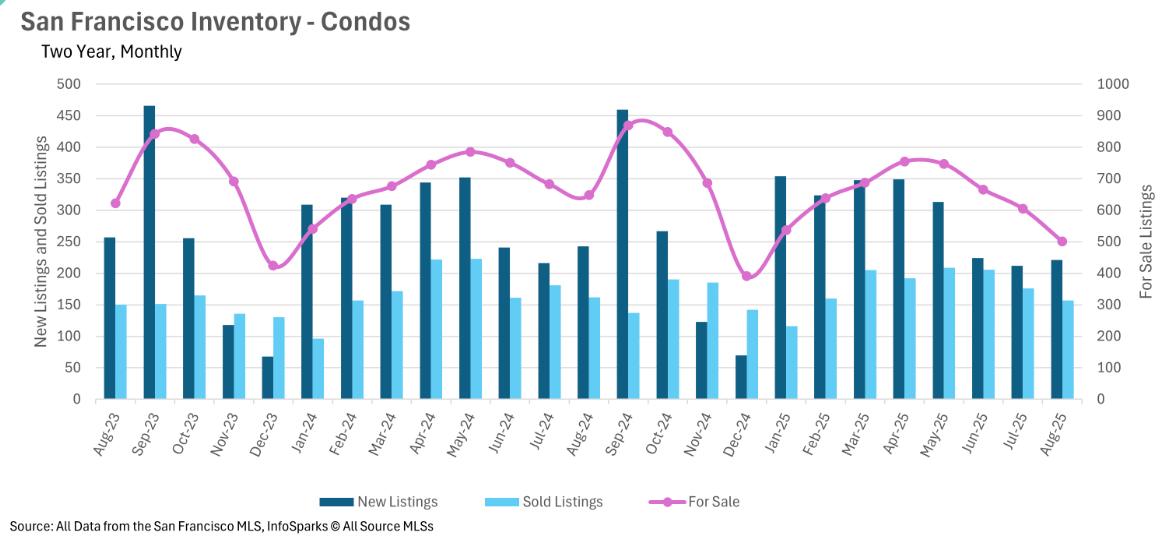
  • Inventory levels continue to creep lower in both the single-family home and condo markets.
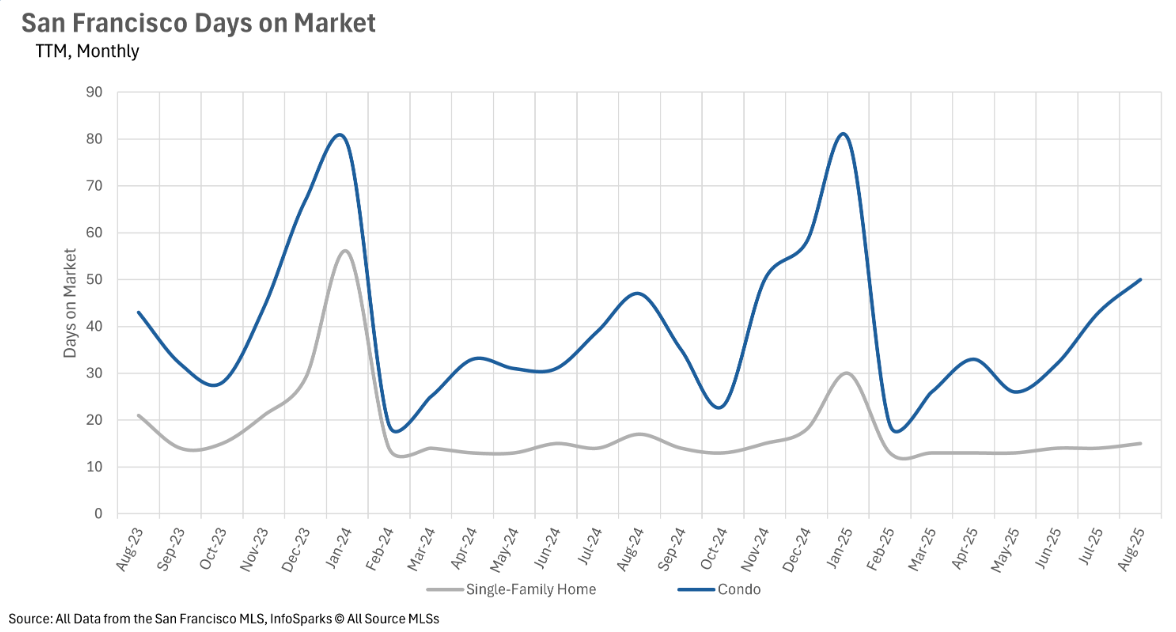
  • Condos are actually spending more time on the market on a year-over-year basis.

Median sale prices stagnate in San Francisco

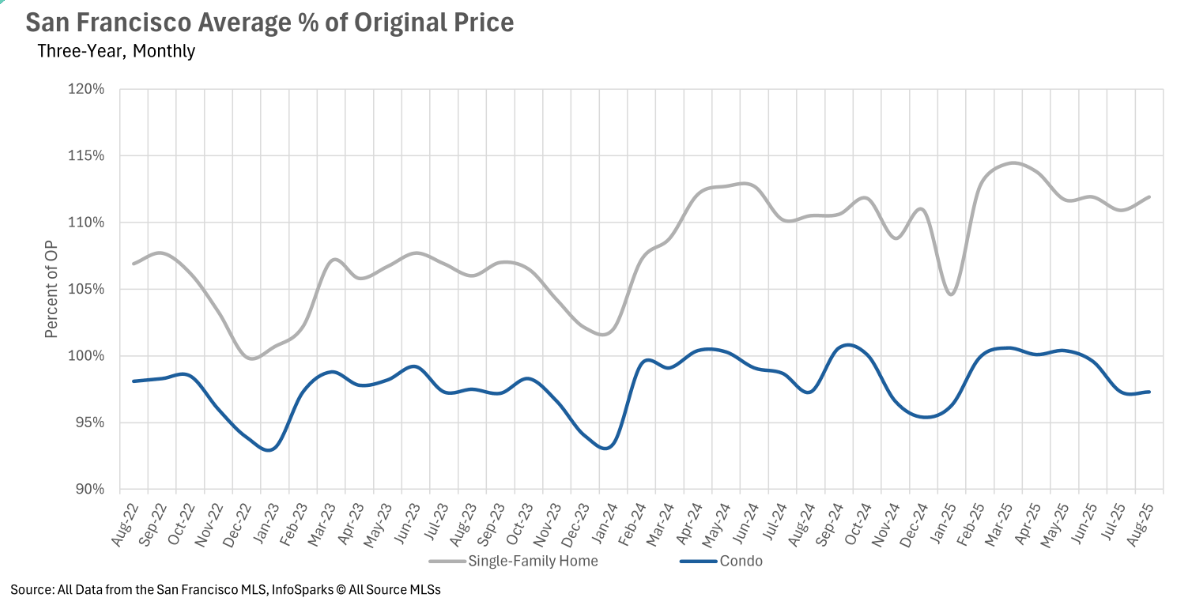
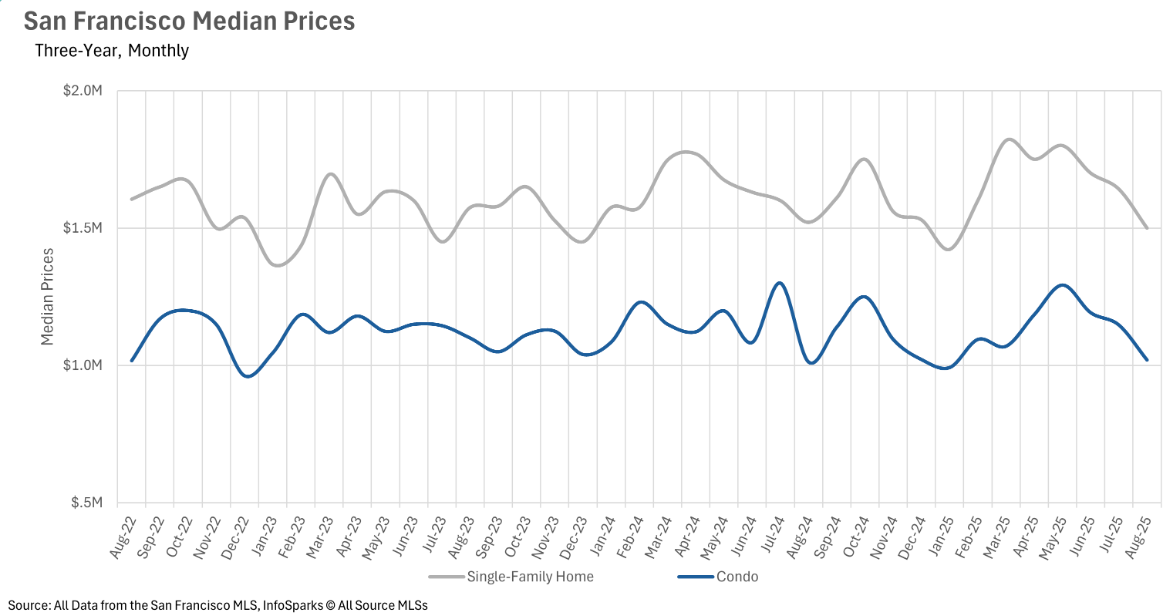
The San Francisco market has traditionally been a fairly volatile market. However, in August, the volatility was muted. The median sale price for a single-family home decreased by 1.38% on a year-over-year basis, while the median sale price for a condo increased by 0.74%. This is a relatively strange phenomenon, as year-over-year swings of 2- 3%+ have become quite normal in San Francisco recently. It is worth noting, though, that the average single-family home is still selling for 111.9% of the original listing price, while the average condo sells for 97.3% of its original listing price.
 

The downtrend continues for inventories in San Francisco

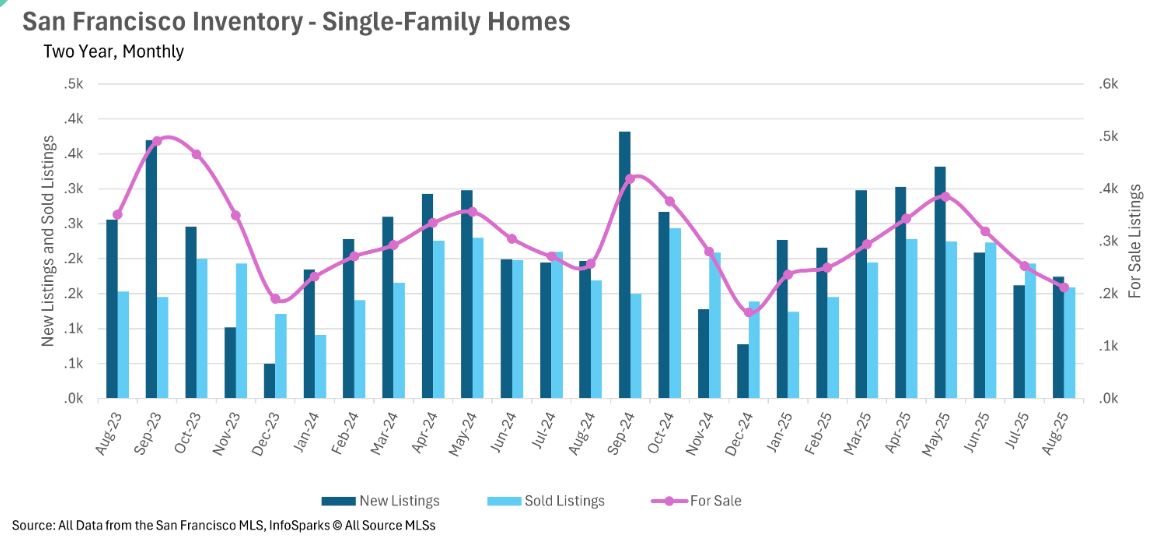
The inventory problem is nothing new in San Francisco. While many other counties saw ballooning inventories throughout the spring and early summer, inventories in San Francisco continued their decline. This trend continued in August, with the single-family home market recording 17.51% fewer active listings on a year-over-year basis, and the condo market recording 22.69% fewer active listings. This trend continues to be concerning, but unfortunately, there’s no end in sight!
 

Despite incredibly low inventories, condos still take some time to sell

While you might assume that lower inventories mean that listings are spending less time on the market, you’d only be partially right when we look at San Francisco. The average single-family home is being scooped up incredibly quickly, spending just 15 days on the market. However, when we turn to the condo market, the average condo is spending 50 days on the market, representing a 6.38% increase year-over-year.
 

Both the single-family home and condo markets are sellers’ markets

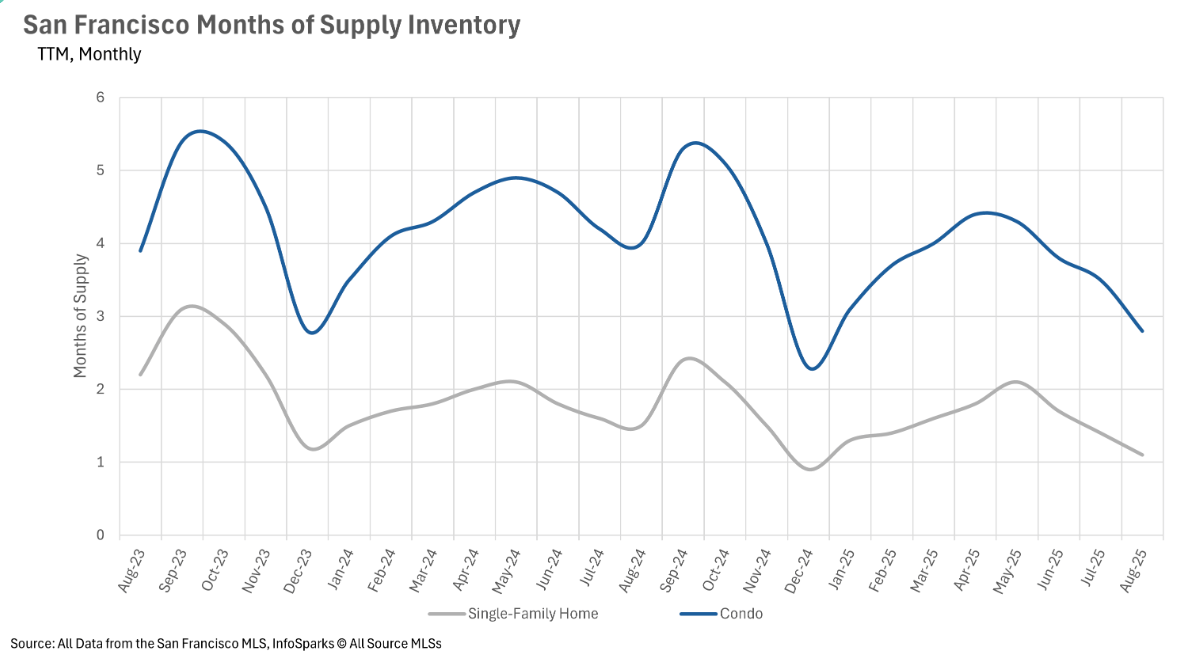
When determining whether a market is a buyers’ market or a sellers’ market, we look to the Months of Supply Inventory (MSI) metric. The state of California has historically averaged around three months of MSI, so any area with at or around three months of MSI is considered a balanced market. Any market that has lower than three months of MSI is considered a seller’s market, whereas markets with more than three months of MSI are considered buyers’ markets.
 
This past month, we saw some of the lowest levels of inventory ever in terms of months' worth of supply in the San Francisco area. Both the single-family home and condo markets are fierce seller's markets, with the single-family home market having just 1.1 months' worth of inventory on the market, and the condo market having just 2.8 months of inventory.
 

Local Lowdown Data

San Francisco year-over-year median price changes for single-family homes and condos, September 2024–August 2025.San Francisco condo inventory chart comparing new listings, sold listings, and homes for sale from August 2023 to August 2025.San Francisco chart of original-price percentages for single-family homes and condos, August 2022 to August 2025.San Francisco days-on-market chart comparing single-family homes and condos, August 2023 to August 2025.Chart comparing San Francisco monthly median prices for single-family homes and condos, August 2022–August 2025.Chart comparing San Francisco condo and single-family home months of supply from August 2023 to August 2025.San Francisco single-family home inventory chart comparing new listings, sold listings, and homes for sale, August 2023–August 2025.

We Would Love to Meet You!

You’ve got questions and we can’t wait to answer them.