The Local Lowdown: September 2025
Michelle Kim | October 1, 2025
Michelle Kim | October 1, 2025
Stay up to date on the latest real estate trends.
Michelle Kim | May 22, 2026
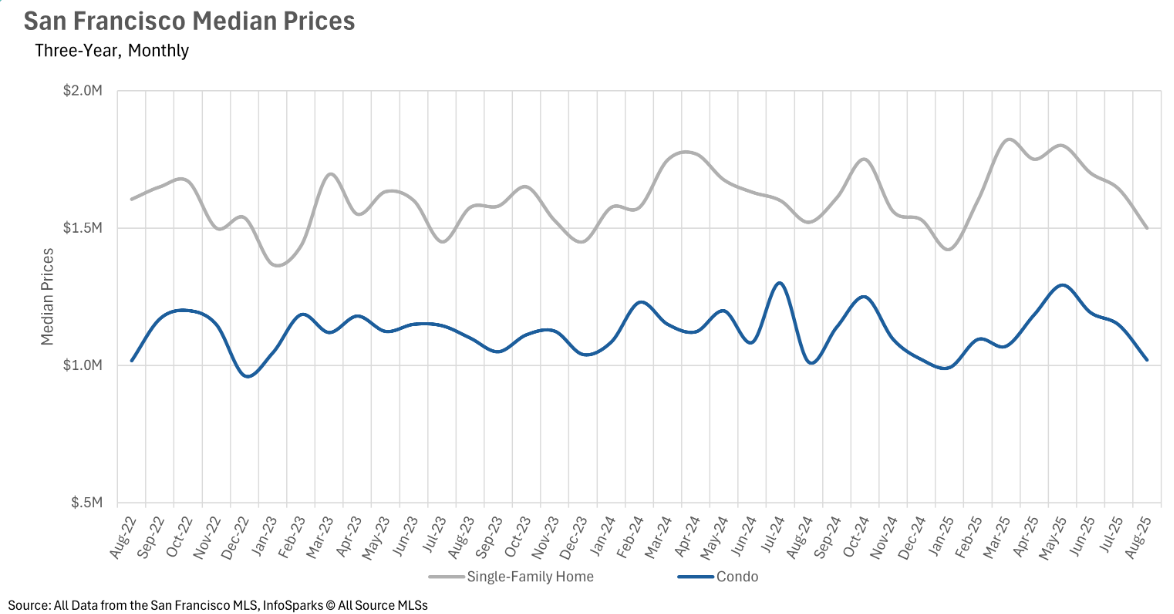
A closer look at how buyers are comparing condos and single-family homes in the 2026 San Francisco housing market based on lifestyle, budget, and long-term goals.

Michelle Kim | May 15, 2026
A closer look at why San Francisco buyers continue to prioritize neighborhoods near Golden Gate Park for outdoor access, walkability, and long-term livability.

Michelle Kim | May 8, 2026
A look at how Mosaik Real Estate supports Bay Area buyers and sellers through multilingual communication and local market expertise.

Michelle Kim | May 1, 2026
A closer look at San Francisco housing market trends in 2026 and what buyers and sellers should expect moving forward.

Michelle Kim | May 1, 2026
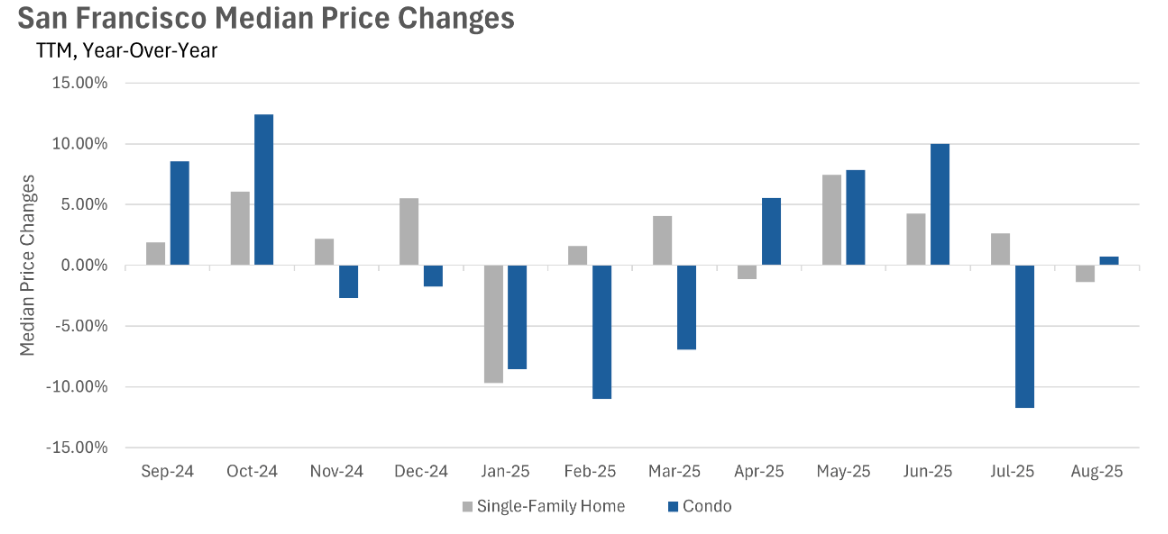
Quick Take: Median home sale prices ticked up slightly on both a month-over-month and year-over-year basis in February, continuing the holding pattern we've seen in re… Read more

Michelle Kim | May 1, 2026
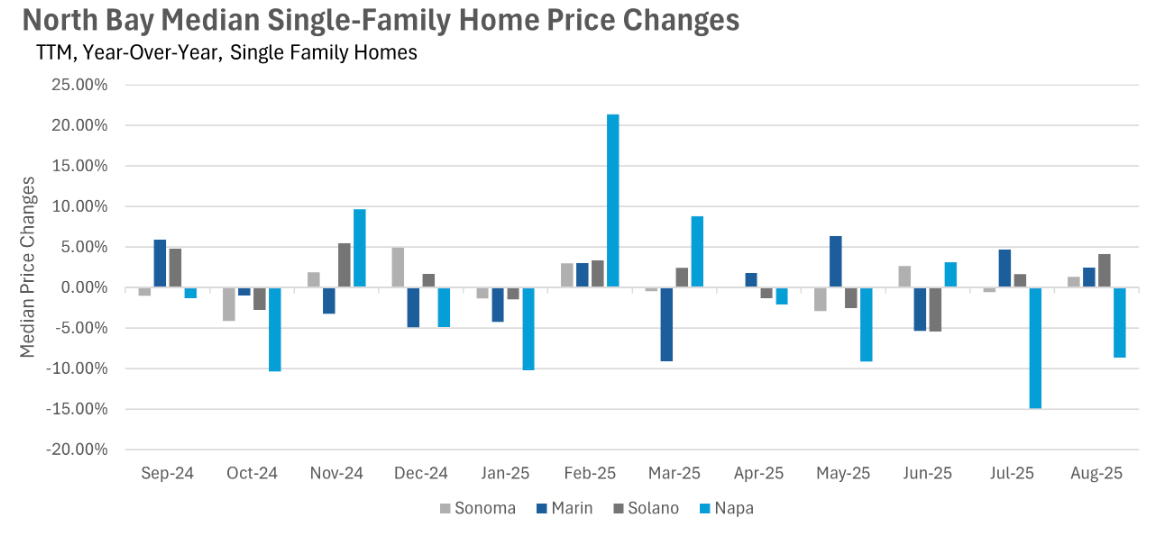
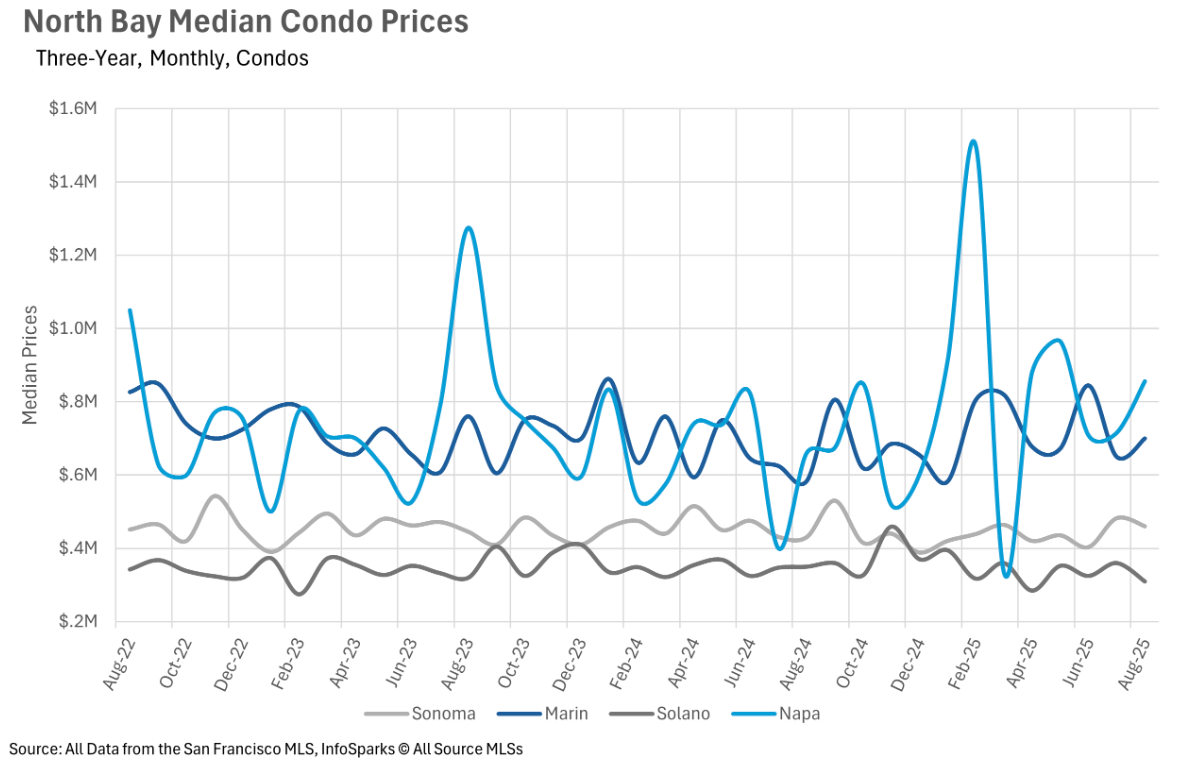
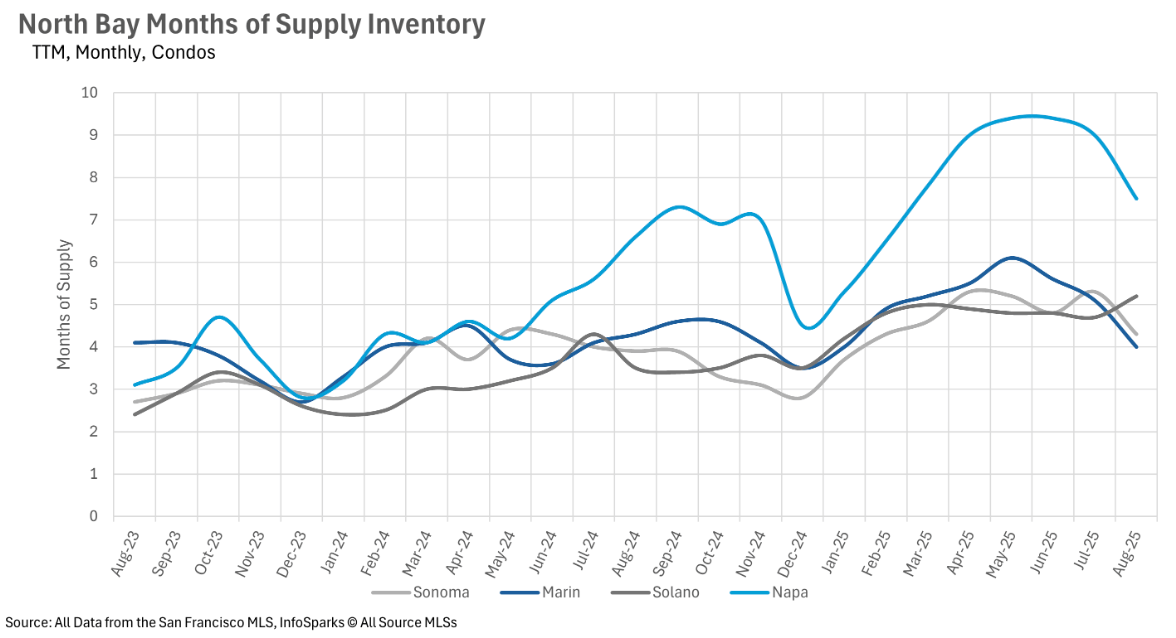
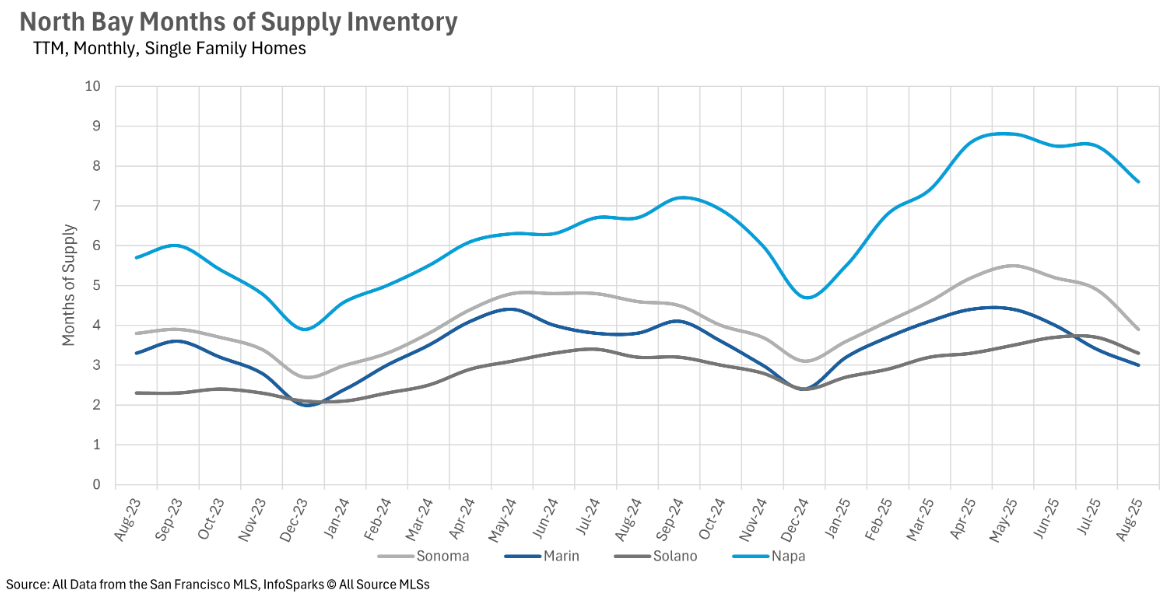
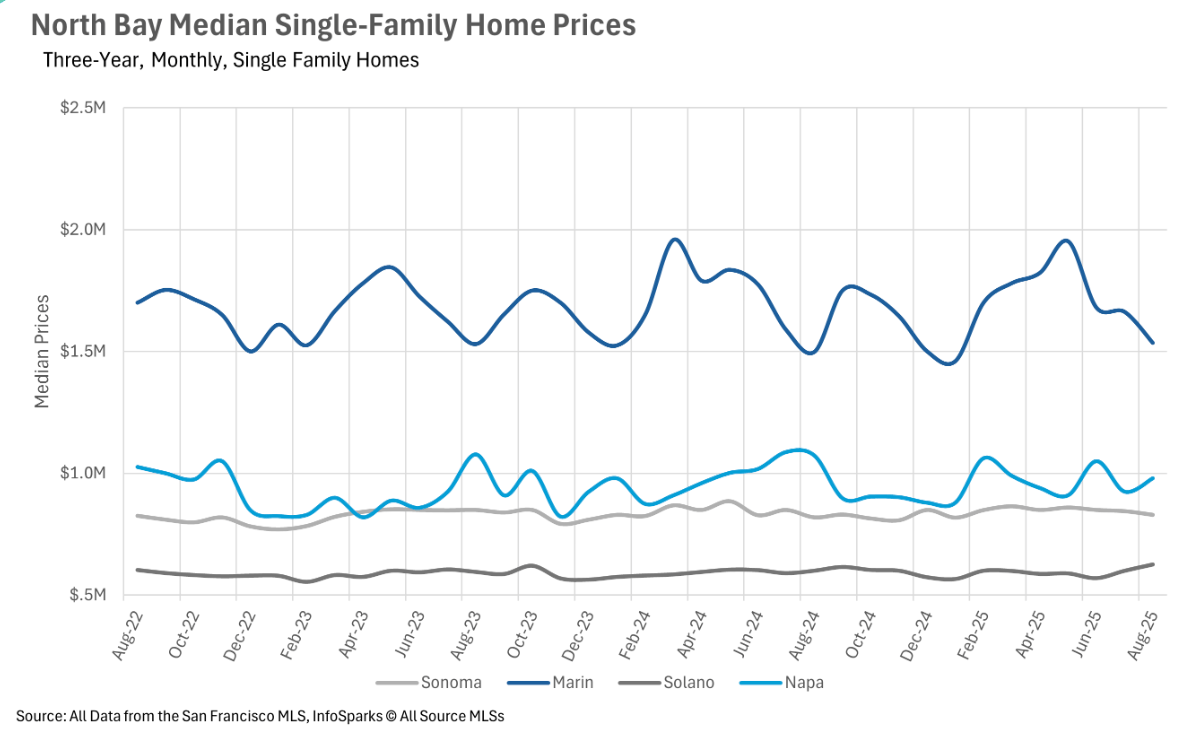
Quick Take: Median sale prices rebounded in Sonoma County with a 1.16% year-over-year gain, while Napa County continued to struggle with a 10.61% decline. Inventory re… Read more
You’ve got questions and we can’t wait to answer them.