The Local Lowdown: March 2023
Michelle Kim | March 1, 2023

Michelle Kim | March 1, 2023
Stay up to date on the latest real estate trends.
Michelle Kim | June 5, 2026
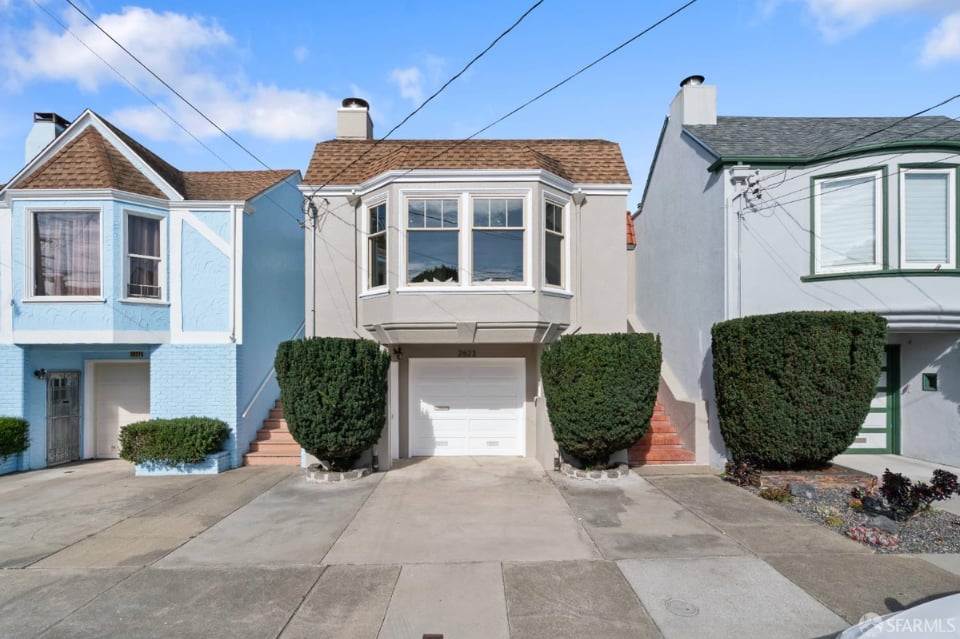
A guide to what buyers should evaluate when purchasing an older San Francisco home, from inspections and insurance to historic charm and long-term ownership.

Michelle Kim | May 31, 2026
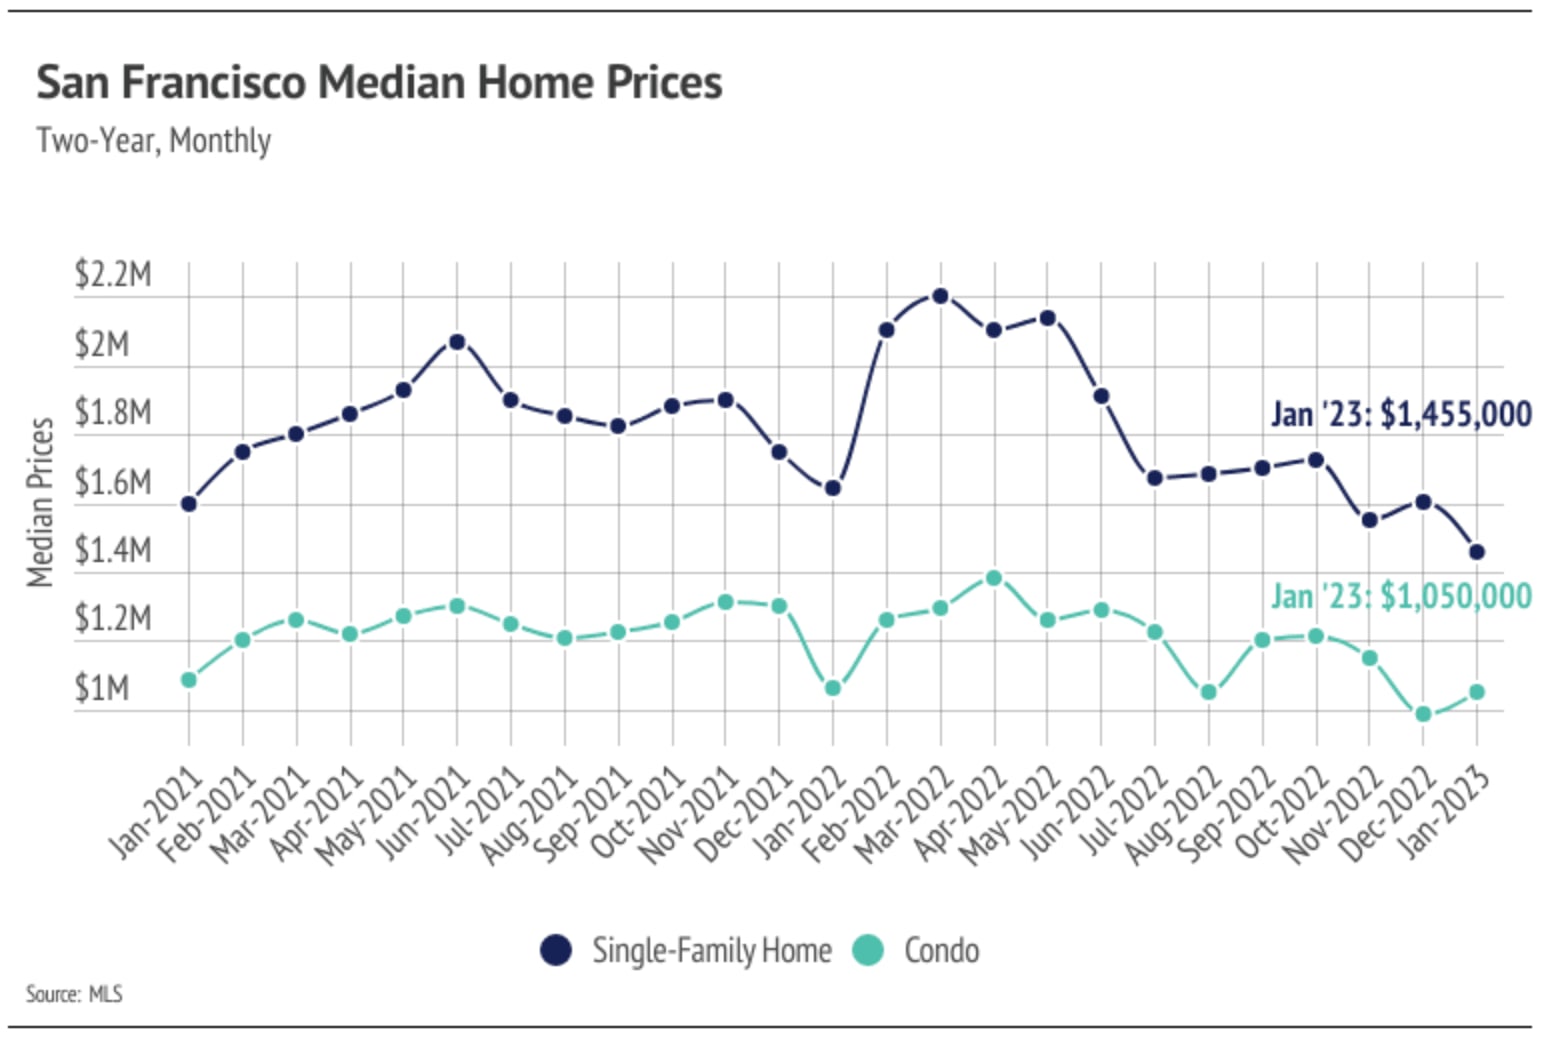
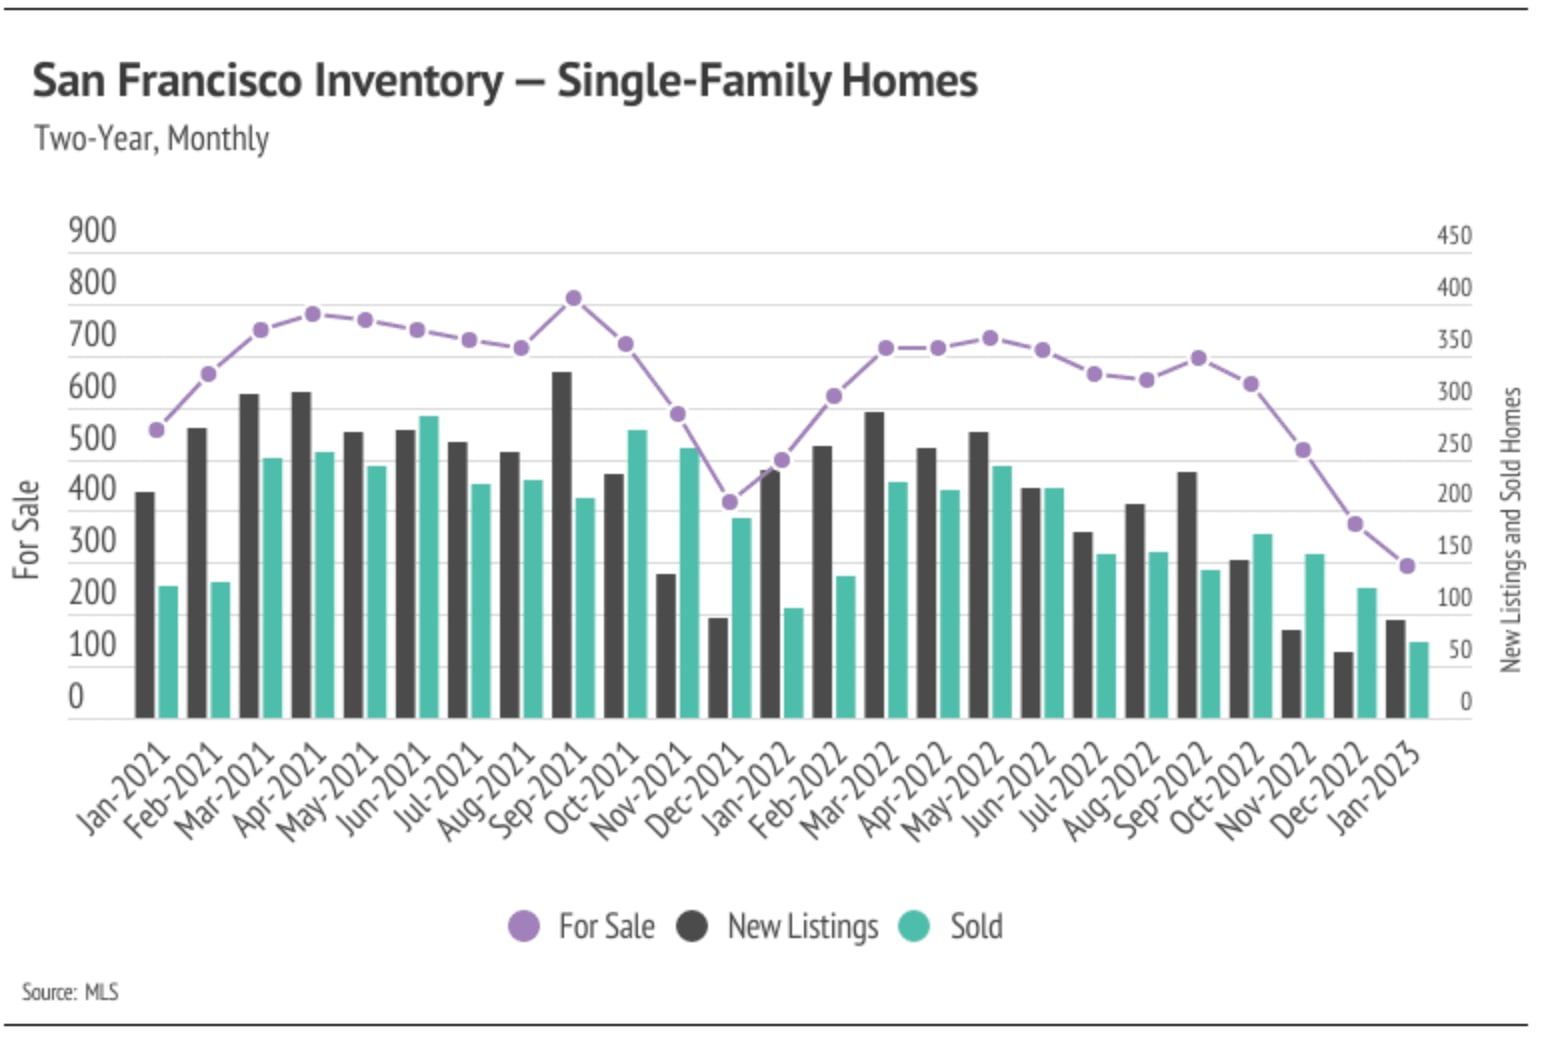
Quick Take: Median home sale prices bounced back in a big way in April, as the spring selling season kicked into gear with nearly a 1% year-over-year increase. Invento… Read more

Michelle Kim | May 31, 2026
Quick Take: Median sale prices gained ground in Sonoma and Marin Counties, with year-over-year increases of 2.35% and 4.38%, respectively, while Solano and Napa Counti… Read more
Michelle Kim | May 31, 2026
Quick Take: Single-family home prices softened slightly in both counties, while the condo market remains split with Alameda declining and Contra Costa rebounding. Inve… Read more

Michelle Kim | May 31, 2026
Quick Take: Single-family median sale prices showed gains across the board in April, with San Mateo and Santa Cruz Counties posting year-over-year increases while Sant… Read more
Michelle Kim | May 31, 2026
Quick Take: Median sale prices continue their remarkable ascent, with single-family homes up more than 21% and condos up more than 18% year-over-year. Inventory levels… Read more
You’ve got questions and we can’t wait to answer them.