The Local Lowdown: August 2025

Michelle Kim  |  September 1, 2025

The Local Lowdown: August 2025

The Local Lowdown

Quick Take:
  • Median sale prices show mixed performance across the Bay Area, with Silicon Valley maintaining strength while the East Bay experiences six consecutive months of declines.
  • Inventory dynamics vary dramatically by region - San Francisco faces severe shortages while most other areas see rising inventory levels.
  • Despite varying inventory conditions, listings are spending significantly more time on the market across nearly all Bay Area markets.
  • Market conditions range from highly competitive sellers' markets in core Silicon Valley to more balanced or buyer-friendly conditions in outlying areas.

Regional price performance reveals a tale of two markets

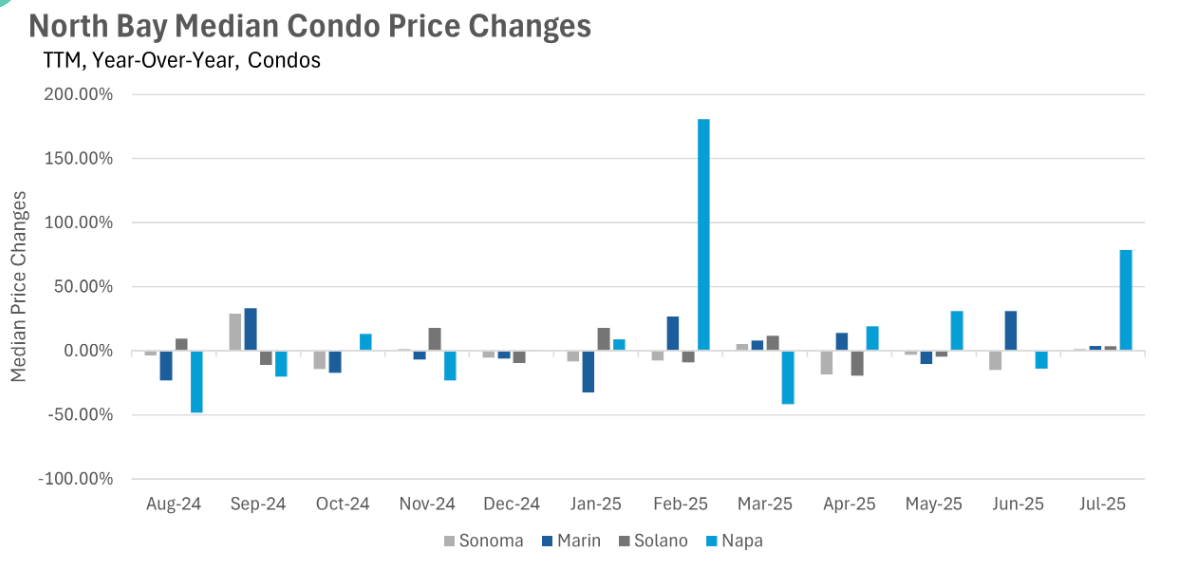
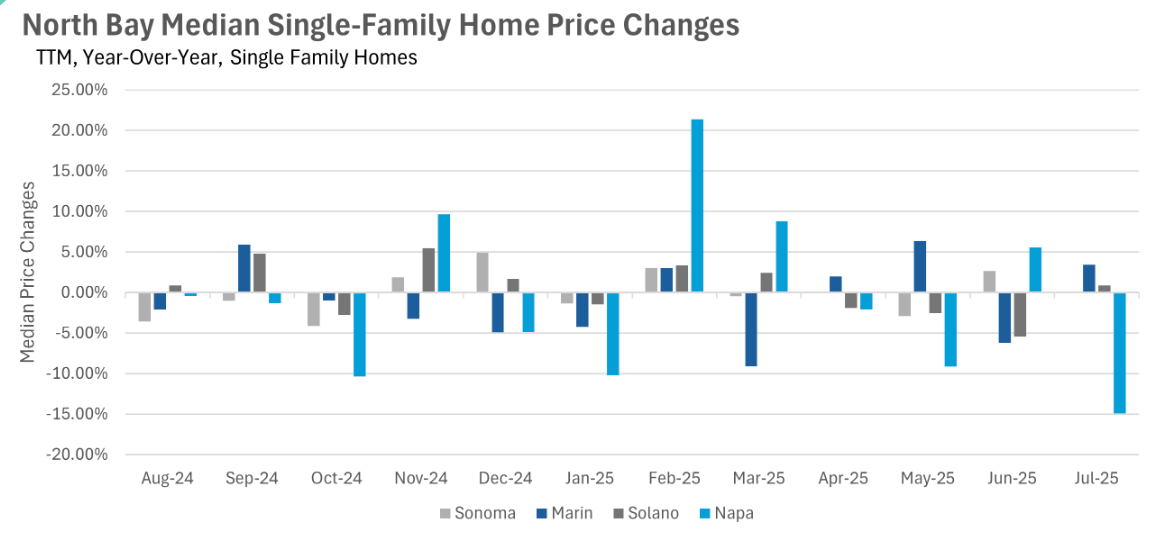
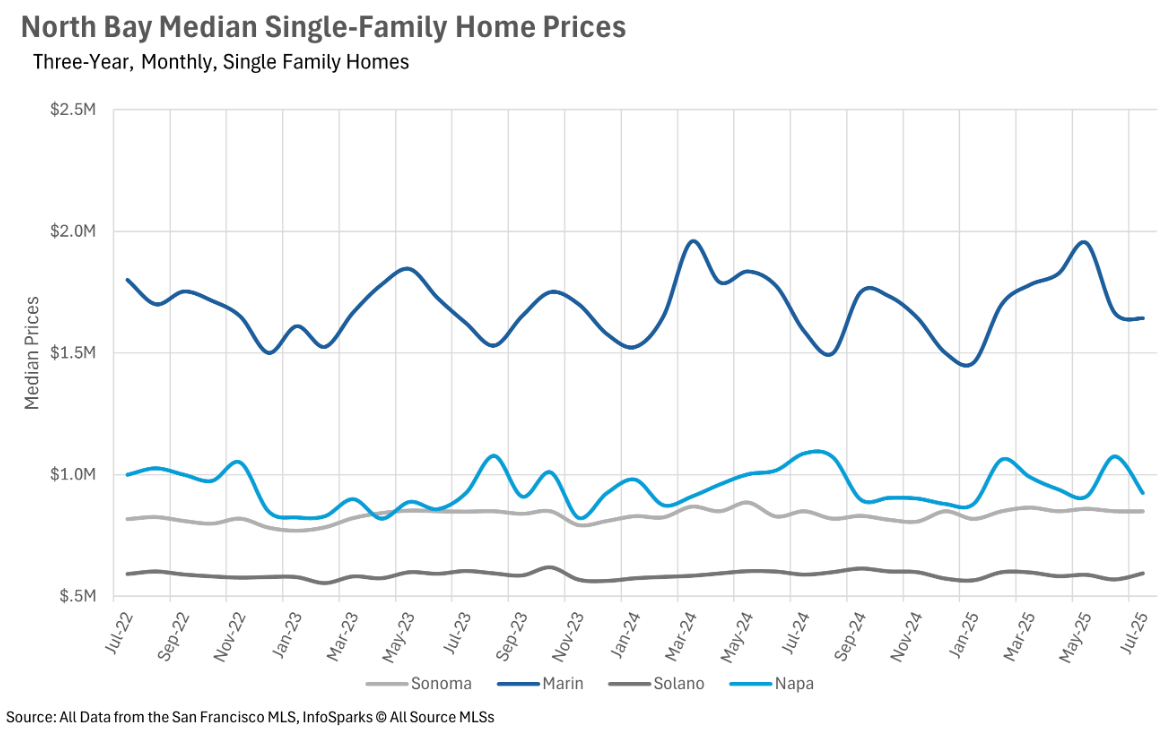
The Bay Area's real estate market is displaying stark regional differences in price performance. Silicon Valley continues to demonstrate remarkable resilience, with Santa Clara County single-family homes maintaining their impressive growth streak for over 12 months without a single year-over-year decline. In contrast, the East Bay has experienced six consecutive months of median sale price decreases, with single-family homes down 2.08% and 6.56% year-over-year in Alameda and Contra Costa Counties respectively. San Francisco and the North Bay fall somewhere in between, with San Francisco single-family homes up 2.34% year-over-year and relatively stable conditions across most North Bay counties, though Napa County stands out with a notable 14.94% decline in single-family home prices.
 

Inventory shortages persist in San Francisco while most regions see supply increases

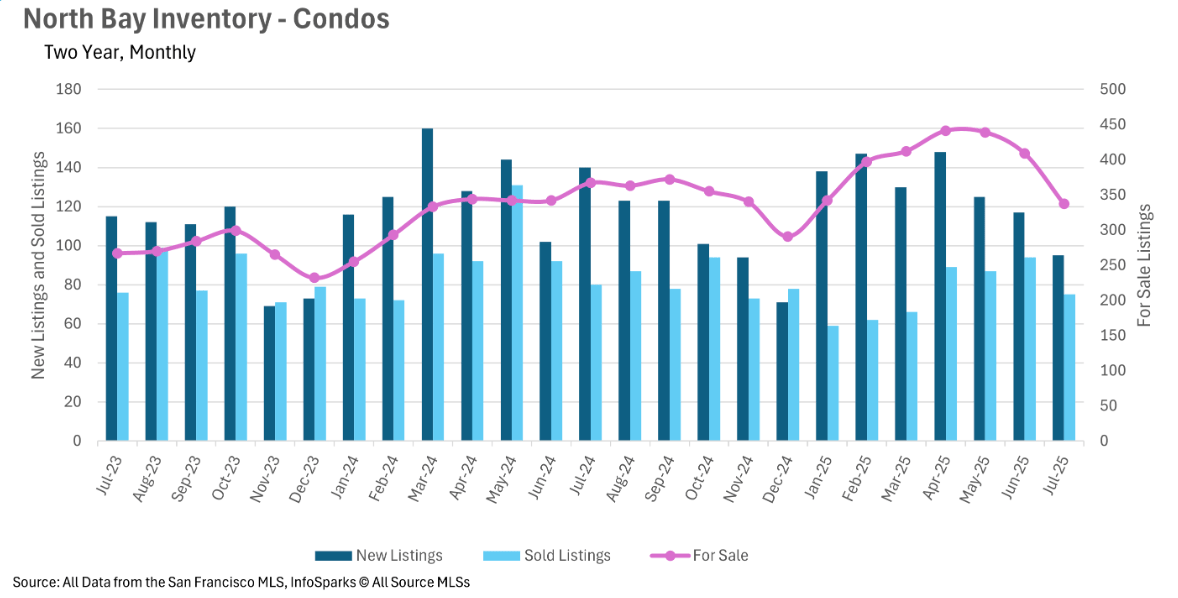
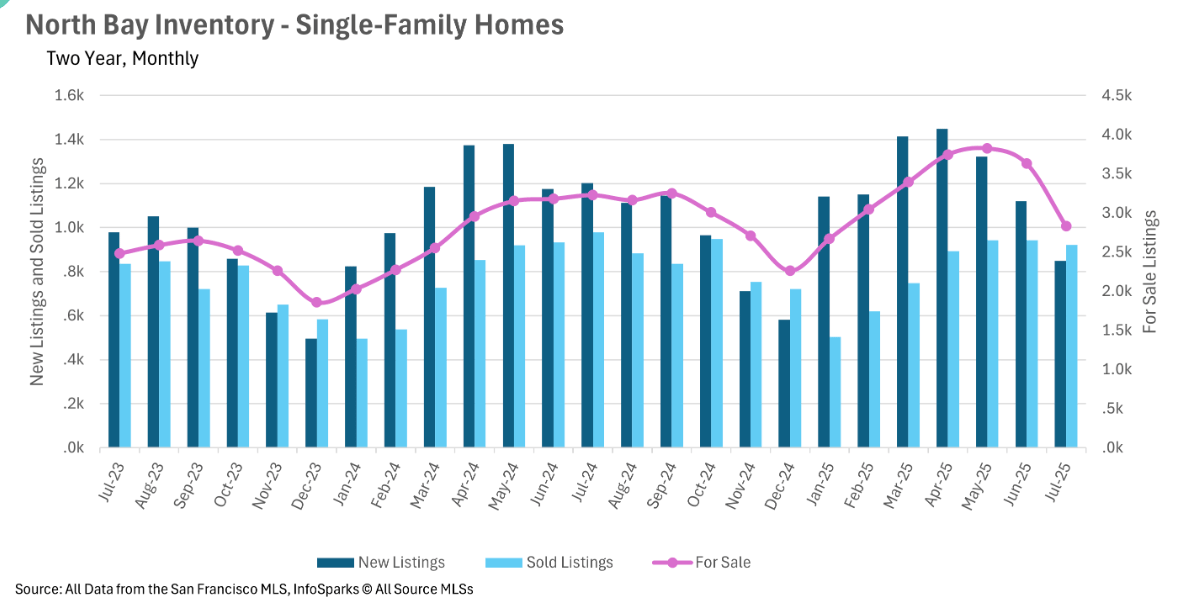
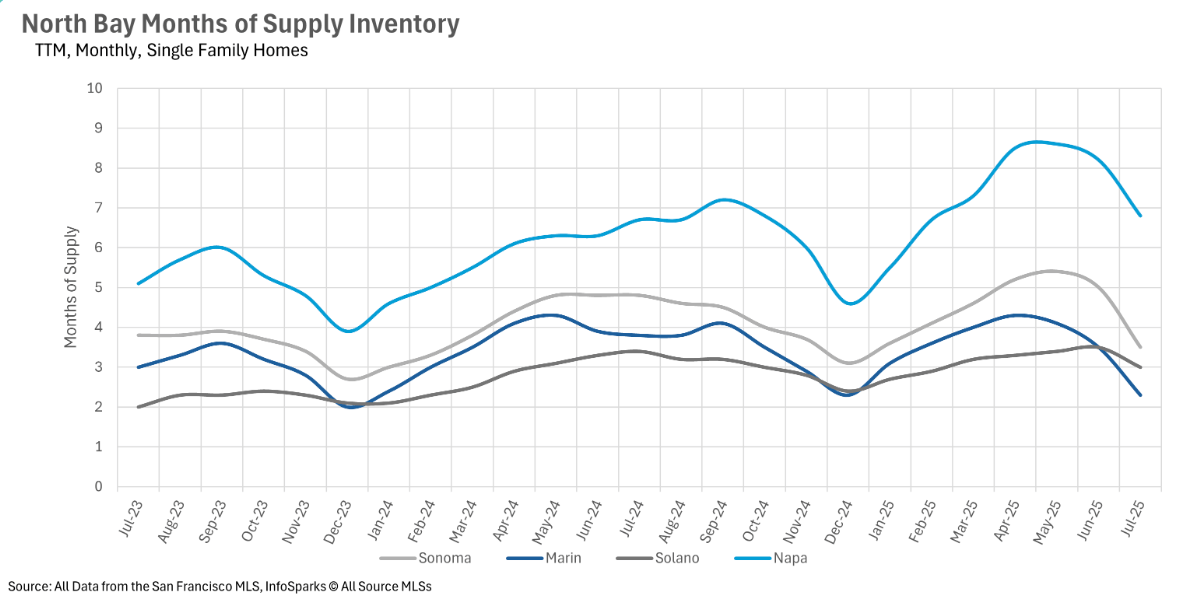
San Francisco's inventory crisis continues to deepen, with 15.93% less single-family inventory and 19.91% fewer condos available compared to last year. This stands in sharp contrast to Silicon Valley, where inventories have grown 7.63% for single-family homes and 25.86% for condos year-over-year. The East Bay is experiencing similar inventory growth with a 15.68% increase in active single-family listings, while the North Bay has seen dramatic month-over-month inventory drops of 21.98% for single-family homes, largely attributed to record-low levels of new listings in July.


Extended time on market becomes the new normal across regions

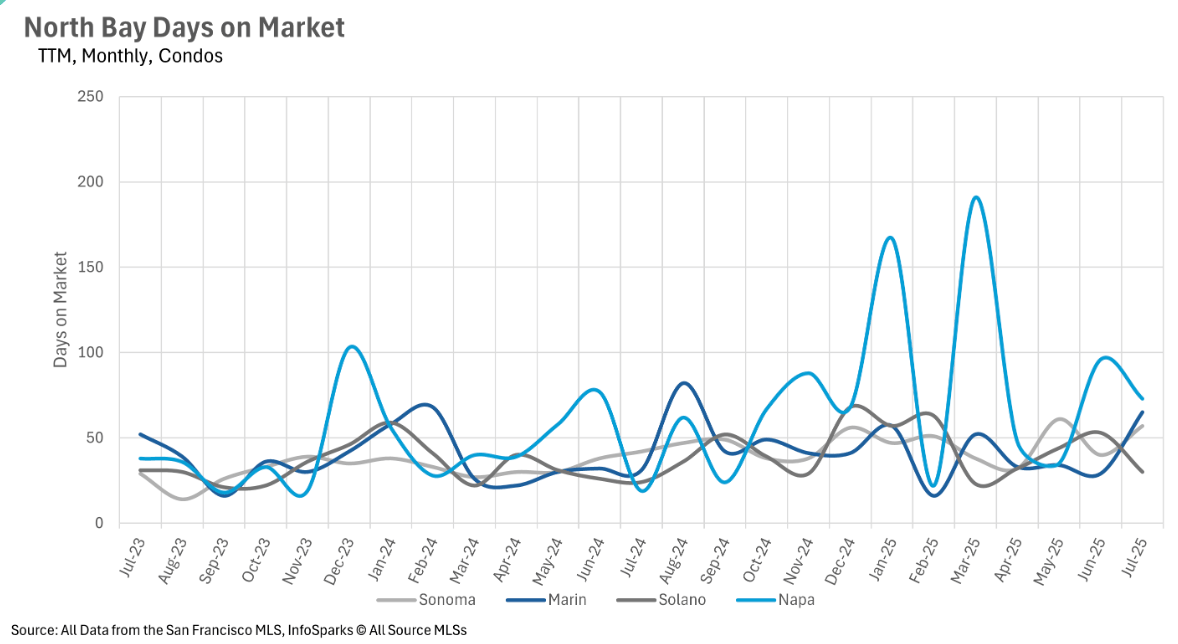
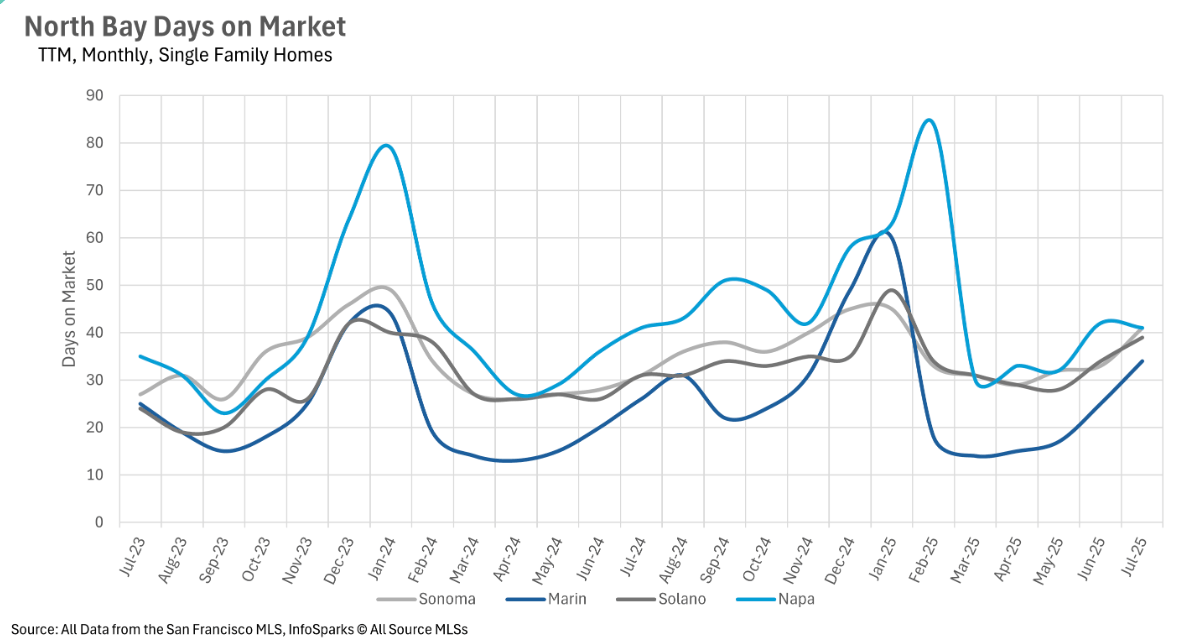
Despite varying inventory conditions, one consistent trend emerges across the Bay Area: homes are taking longer to sell. The East Bay has seen particularly dramatic increases, with single-family homes now spending 16-18 days on market compared to 13 days last year, while condos are taking 31-35 days versus 19-24 days in 2024. Silicon Valley homes are still selling quickly at under 2.5 weeks, but even this represents an increase from last year. The North Bay is experiencing 20-30% longer listing periods in most markets, with some areas like Marin and Napa County condos seeing dramatic increases of 109.68% and 284.21% respectively.
 

Market dynamics shift toward more balanced conditions

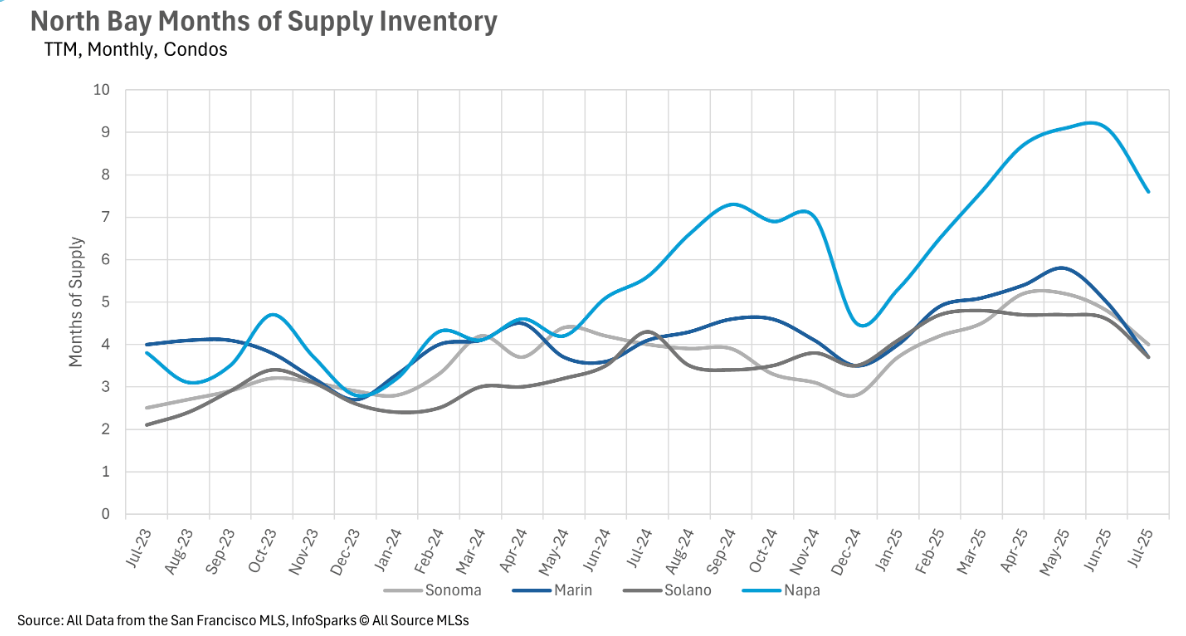
The changing inventory and pricing dynamics are reshaping market competitiveness across the Bay Area. San Mateo and Santa Clara Counties remain fiercely competitive sellers' markets with just 1.7 and 1.5 months of supply respectively. However, other areas are trending toward more balanced conditions, with Marin County's single-family market flipping to a sellers' market at 2.3 months of supply, while San Francisco's condo market is approaching balance at 3.1 months. The East Bay maintains sellers' market conditions for single-family homes despite falling prices, while condo markets across most regions have shifted to buyer-friendly conditions with 3.4 to 5.7 months of supply available.
 

Local Lowdown Data

Line chart comparing monthly condo days on market in Alameda and Contra Costa, July 2023–July 2025.East Bay condo inventory chart comparing monthly new listings, sold listings, and listings for sale from July 2023 to July 2025.Bar chart comparing year-over-year condo price changes in Alameda and Contra Costa counties, August 2024–July 2025.Line chart comparing monthly East Bay single-family home days on market in Alameda and Contra Costa.Chart comparing year-over-year single-family home price changes in Alameda and Contra Costa, August 2024 to July 2025.Chart comparing monthly median condo prices in Alameda and Contra Costa from July 2022 to July 2025.Chart of East Bay single-family home listings, sales, and inventory from July 2023 to July 2025.Chart of East Bay single-family home prices, comparing Alameda and Contra Costa from July 2022 to July 2025.Chart of East Bay condo inventory: Alameda and Contra Costa months of supply, July 2023–July 2025.Line chart comparing monthly single-family home supply in Alameda and Contra Costa counties, July 2023–July 2025.Line chart of North Bay condo days on market, July 2023–July 2025; Napa shows the largest fluctuations.North Bay single-family home days-on-market chart, July 2023–July 2025, comparing Sonoma, Marin, Solano, and Napa.North Bay condo inventory chart comparing monthly new listings, sold listings, and homes for sale from July 2023 to July 2025.Chart of North Bay condo price changes by county, August 2024 to July 2025, with a sharp Napa spike in February.North Bay single-family home inventory chart comparing monthly new listings, sold listings, and listings for sale, July 2023–July 2025.Chart of North Bay single-family home price changes by county, August 2024 to July 2025.Line chart of North Bay condo prices by county, July 2022–July 2025; Napa prices fluctuate most.Line chart of North Bay monthly home prices, comparing Sonoma, Marin, Solano, and Napa from July 2022 to July 2025.Line chart of North Bay condo inventory by county, July 2023–July 2025; Napa peaks above nine months in June 2025.Line chart comparing monthly single-family home inventory in Sonoma, Marin, Solano, and Napa counties, July 2023–July 2025.San Francisco monthly original-price trends for single-family homes and condos, July 2022 to July 2025.Chart comparing San Francisco condo and single-family home days on market, July 2023–July 2025.San Francisco condo inventory chart with monthly new listings, sold listings, and for-sale totals, July 2023–July 2025.San Francisco year-over-year median price changes, comparing single-family homes and condos from August 2024 to July 2025.Line chart comparing San Francisco monthly median prices for single-family homes and condos, July 2022–July 2025.San Francisco monthly inventory chart comparing months of supply for condos and single-family homes, July 2023–July 2025.Chart of San Francisco single-family home listings and sales from July 2023 to July 2025.Chart comparing monthly condo days on market in San Mateo, Santa Clara, and Santa Cruz from July 2023 to July 2025.Silicon Valley condo inventory chart comparing monthly new listings, sold listings, and homes for sale from July 2023 to July 2025.Silicon Valley condo median price changes year over year, August 2024 to July 2025.Line chart comparing monthly days on market for San Mateo, Santa Clara, and Santa Cruz from July 2023 to July 2025.Line chart of monthly median condo prices in San Mateo, Santa Clara, and Santa Cruz, July 2022–July 2025.Chart of year-over-year Silicon Valley single-family home median price changes by county, August 2024 to July 2025.Line chart comparing three years of monthly single-family home prices in San Mateo, Santa Clara, and Santa Cruz.Line chart of monthly condo supply in three counties, July 2023–July 2025; Santa Cruz peaks near 6.5 months in May 2025.Line chart of monthly Silicon Valley home supply, July 2023–July 2025; Santa Cruz remains highest and peaks in June 2025.Chart comparing Silicon Valley single-family home listings, sales, and for-sale inventory from July 2023 to July 2025.

Recent Blog Posts

Stay up to date on the latest real estate trends.
Living in Cow Hollow, San Francisco: A Guide to the Neighborhood Lifestyle

Michelle Kim  |  October 23, 2026

Explore life in Cow Hollow, from historic homes and boutique shopping along Union Street to neighborhood cafés, waterfront recreation, and the charm of everyday San Fr… Read more
Living in NoPa, San Francisco: A Guide to the Neighborhood Lifestyle

Michelle Kim  |  October 19, 2026

Explore life in NoPa, San Francisco, from classic Victorian homes and local dining on Divisadero Street to nearby parks, walkability, and neighborhood charm.
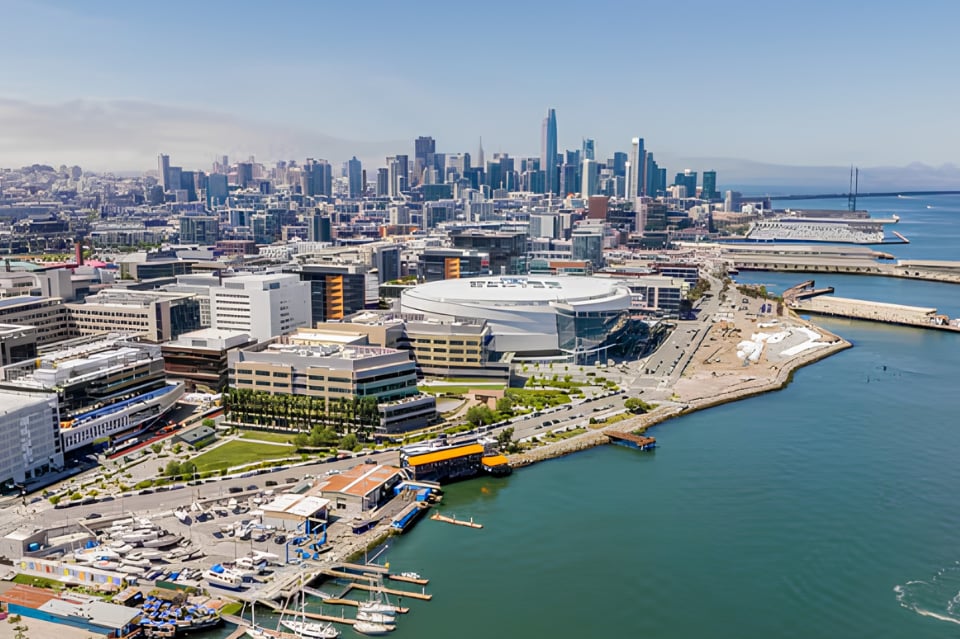
Aerial panorama of San Francisco's downtown skyline and waterfront along the bay.
Living in Mission Bay: A Guide to the Neighborhood Lifestyle

Michelle Kim  |  October 2, 2026

Explore life in Mission Bay, from waterfront parks and modern residences to dining, entertainment, outdoor recreation, and convenient city connections.

The Big Story Market Update
The Local Lowdown: September 2026

Michelle Kim  |  September 30, 2026

Quick Take: Median home sale prices slipped for the second straight month in August, falling to $429,100 from June's peak of $442,800, though they remain slightly abov… Read more

North Bay Market Update
The Local Lowdown: September 2026

Michelle Kim  |  September 30, 2026

Quick Take: Marin County dominated August, with the median single-family home selling for $1,778,000, a 15.83% jump over last August, while Sonoma, Solano, and Napa Co… Read more

East Bay Market Update
The Local Lowdown: September 2026

Michelle Kim  |  September 30, 2026

Quick Take: Single-family prices are holding firm year over year, with Alameda County up slightly and Contra Costa County up nearly 3%, while the condo picture has spl… Read more

We Would Love to Meet You!

You’ve got questions and we can’t wait to answer them.