San Francisco Real Estate Market Report: October 2021
robyn October 2, 2021

robyn October 2, 2021
Welcome to our October newsletter, where we’ll discuss residential real estate trends in San Francisco and across the nation. This month, we’ll examine the state of the U.S. housing market now that more supply has come to the market and explore the impact of iBuyers and fin-tech companies’ influences on the housing market.
From 2012 through 2019, the seasonality of the housing market was incredibly stable. For seven years, we consistently saw fewer sales in the winter months and higher sales in the spring and summer months. In 2020, however, we saw a shift. The usual seasonality gave way to super-high demand that remained consistent throughout the year, even after the initial pandemic shock from April to June 2020 faded. Then, in winter 2020 and early spring 2021, inventory decreased to historically low levels. Now we are far enough into summer to comfortably see pre-2020 seasonal trends return.
Demand for homes has remained quite high, which has increased the use of all-cash offers that often serve as differentiators for sellers who receive multiple offers. The National Association of Realtors (NAR) reports that cash sales rose from 16% to 23% year-over-year in July. The increase in cash offers often pushes out first-time homebuyers who don’t have hundreds of thousands (or millions) of dollars on hand. At the same time, we are seeing fin-tech iBuyers (algorithmic instant cash buyers), which is still in its infancy, targeting first-time buyers as a means to stay competitive by making them all-cash buyers. This dynamic could drive demand even higher if fewer buyers are priced out of the market.
As we navigate this period of high buyer demand and low supply, we remain committed to providing you with the most current market information so you feel supported and informed in your buying and selling decisions. In this month’s newsletter, we cover the following:
Key Topics and Trends in October
Housing inventory started falling steadily in April 2020 in response to the pandemic, and the steady seasonal norms in supply vanished completely. As you can see from the chart below, we are starting to see a hint of seasonality return with the inventory increase over the summer months, albeit at a much lower level. As inventory crossed below the 600,000 level, sales began to slow; there simply weren’t enough homes to meet buyer demand, which created a hyper-competitive market for buyers. We are pleased to see inventory increase to alleviate some of the extreme demand.

The chart below, which illustrates sales over the last 12 months, reveals that sales often trend with inventory, but with a one-month lag. In other words, more sales are recorded when more inventory comes online during the previous month. For most of 2021, even though we were on pace to have a record number of home sales, the rate of sales was slowing. That deceleration, however, has reversed as more homes have come to the market.

The last year has taught us that uncertainty around the pandemic has positively correlated to home sales. People are spending more time at home, and the Federal Reserve is expected to keep mortgage rates low. As shown in the chart below, we’re currently hovering at historically low mortgage rates, which will likely remain for the rest of the year. Low-rate financing incentivizes buying, which has been one reason for the high demand over the last 18 months.

The housing market’s competitiveness has increased the number of all-cash purchases to the highest level we’ve seen in the last 10 years. In July 2021, NAR reported that 23% of home sales were cash purchases, which marks a 7% increase from 2020. The competitive nature of the current market has priced out many first-time homebuyers, but we could see that shift with the emergence of iBuyers, who can quickly purchase a home in cash. The speed with which buyers need to secure financing is often part of the problem for first-time buyers. iBuyers can offer the speed and financing necessary for a competitive offer.
With such low supply and high demand for homes, we could see the market become even more competitive if fewer buyers are priced out of the market. Currently, a low percentage of sales involve iBuyers; however, if iBuyers become more common, supply could trend even lower than it already is.

While the market remains competitive for buyers, conditions are making it an exceptional time for homeowners to sell. Lower inventory means sellers will receive multiple offers with fewer concessions. Because sellers are often selling one home and buying another, it’s essential that sellers work with the right agent to ensure that the transition goes smoothly.
October Housing Market Updates for San Francisco
During August 2021, in San Francisco, the median single-family home price declined for the second month in a row, moving further from the peak reached in June. Condo prices declined, as well, despite fewer condos on the market. However, year-over-year, single-family home prices increased meaningfully, up 12%, while condo prices declined 6%.


Single-family home inventory has declined significantly over the last four months and is now even below pre-pandemic levels. To fully understand current inventory, we must look at it in the context of last year. In 2020, single-family home inventory increased to its highest level since 2011. From May to October 2020 (five months), inventory exploded. Despite such a meteoric rise, inventory fell even faster than it rose, which speaks to the desirability of San Francisco. By January 2021, inventory had declined to lower levels than in January 2020, then ticked up slightly from February to April before going lower from May to August 2021. As you can see from the chart, sales outpaced new listings in June, July, and August, dropping inventory below pre-pandemic levels. Higher and higher prices have done nothing to curb demand. June had the second-highest number of sales in a month over the last 24 months with record high prices. Sales in August are still quite high given that fewer homes are on the market. With such a consistently high level of demand and fewer homes for sale, prices will likely continue to appreciate throughout 2021.

The number of condos on the market fell in July, continuing the trend toward pre-pandemic levels. Demand for condos has come back strong, and sales outpaced new listings in June, July, and August. Sales in August 2021 significantly outpaced sales in both August 2020 and August 2019.

Both single-family homes and condos spent slightly less time on the market in August 2021 than they did in August of last year. As we’ll see, the pace of sales has contributed to the low Months of Supply Inventory (MSI) over the past several months.

We can use MSI as a metric to judge whether the market favors buyers or sellers. The average MSI is three months in California, which indicates a balanced market. An MSI lower than three means that there are more buyers than sellers on the market (that is, it’s a sellers’ market), while a higher MSI means there are more sellers than buyers (that is, it’s a buyers’ market). In August 2021, single-family home MSI fell below one month of supply, while condo MSI fell below two months of supply. Both condo and single-family home MSI indicate that the market strongly favors sellers.

In summary, the high demand and low supply in San Francisco have driven home prices up over the last year, but the huge price appreciation is slowing. Inventory will likely remain historically low this year with the sustained high demand in the area. Overall, the housing market has shown its value through the pandemic and remains one of the most valuable asset classes. The data show that housing has remained consistently strong throughout this period.
We expect the number of new listings will continue to increase in the remaining summer months. The current market conditions, however, can withstand a high number of new listings, and more sellers may also enter the market to capitalize on the high buyer demand. As we navigate the summer season, we expect the high demand to continue, and new houses on the market to sell quickly.
As always, we remain committed to helping our clients achieve their current and future real estate goals. Our team of experienced professionals are happy to discuss the information we’ve shared in this newsletter. We welcome you to contact us with any questions about the current market or to request an evaluation of your home or condo.
Stay up to date on the latest real estate trends.
Michelle Kim | October 23, 2026
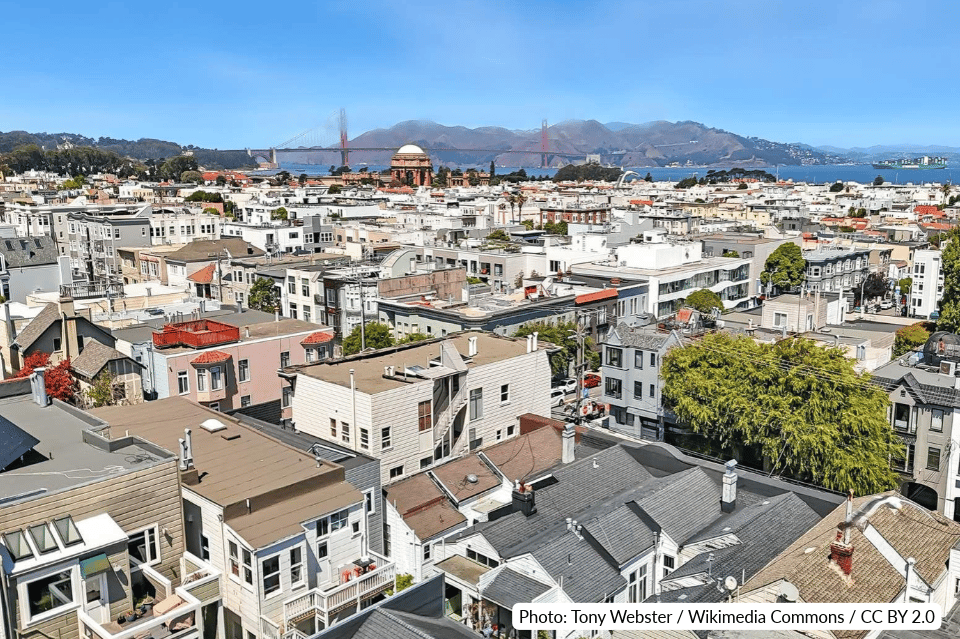
Explore life in Cow Hollow, from historic homes and boutique shopping along Union Street to neighborhood cafés, waterfront recreation, and the charm of everyday San Fr… Read more

Michelle Kim | October 19, 2026
Explore life in NoPa, San Francisco, from classic Victorian homes and local dining on Divisadero Street to nearby parks, walkability, and neighborhood charm.
Michelle Kim | October 2, 2026
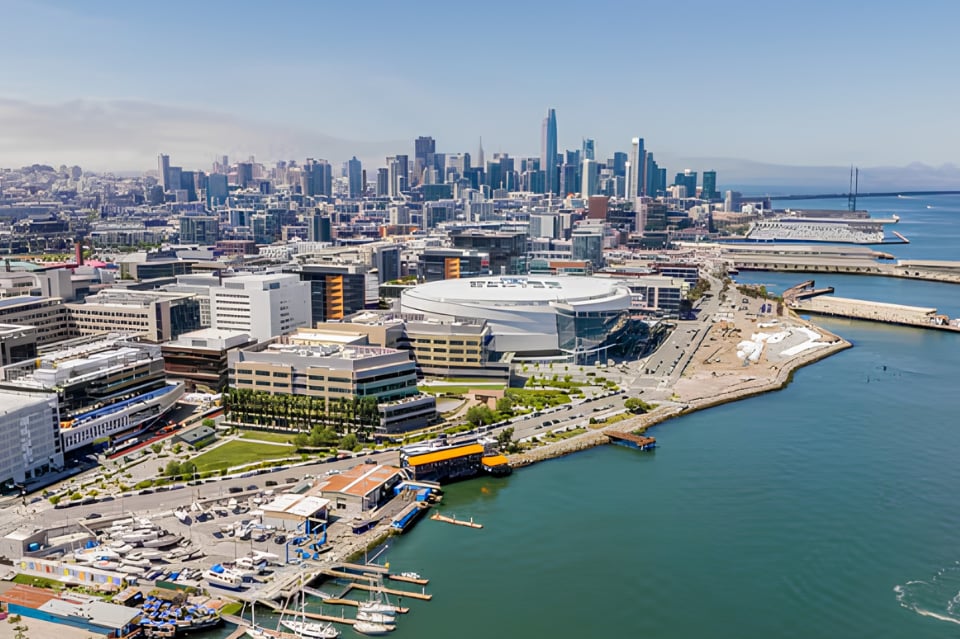
Explore life in Mission Bay, from waterfront parks and modern residences to dining, entertainment, outdoor recreation, and convenient city connections.
Michelle Kim | September 30, 2026
Quick Take: Median home sale prices slipped for the second straight month in August, falling to $429,100 from June's peak of $442,800, though they remain slightly abov… Read more

Michelle Kim | September 30, 2026
Quick Take: Marin County dominated August, with the median single-family home selling for $1,778,000, a 15.83% jump over last August, while Sonoma, Solano, and Napa Co… Read more
Michelle Kim | September 30, 2026
Quick Take: Single-family prices are holding firm year over year, with Alameda County up slightly and Contra Costa County up nearly 3%, while the condo picture has spl… Read more
You’ve got questions and we can’t wait to answer them.