East Bay Real Estate Market Report: January 2022
robyn January 3, 2022
robyn January 3, 2022
Quick Take:
Note: You can find the charts & graphs for the Big Story at the end of the following section.
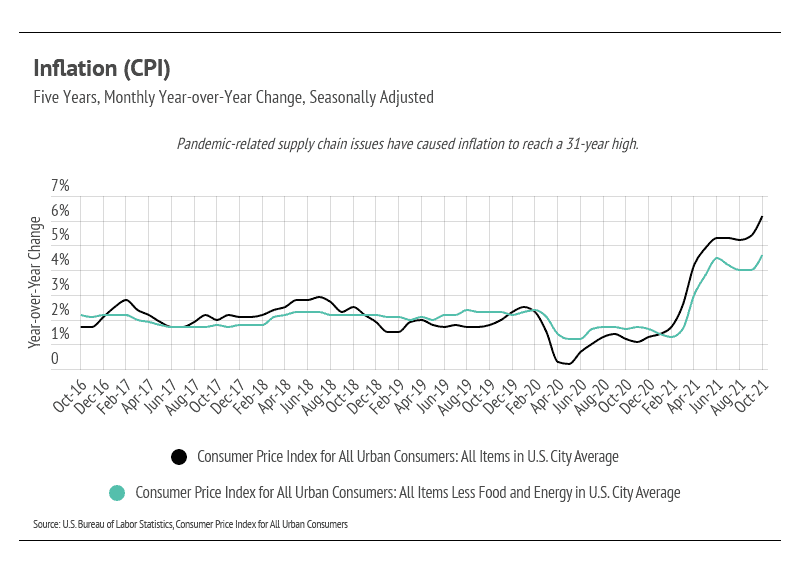
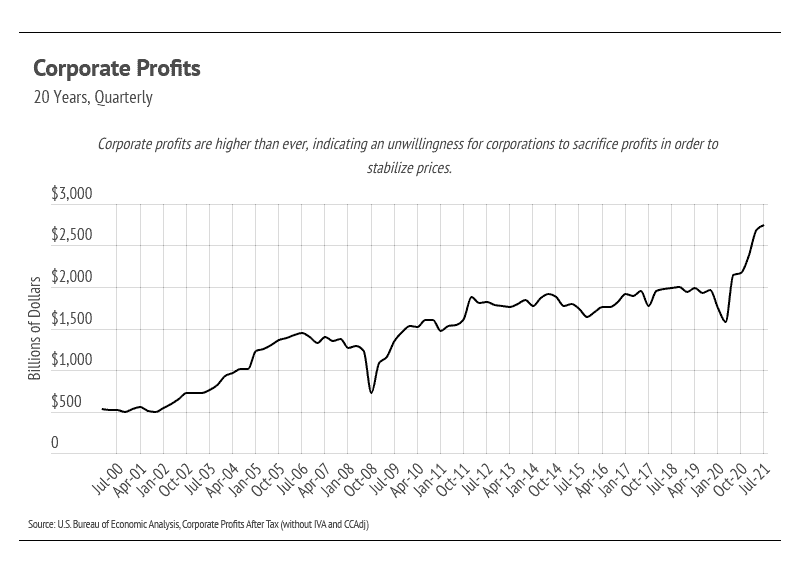
By now, you’ve likely run across a headline regarding the large inflation jump we’ve experienced over the past six months. Even if you haven’t, you’ve probably noticed a general increase in prices for things like gas and food over the past couple of months. The last significant long-term inflationary period was in the 1970s when inflation expectations created a feedback loop largely because unions were common and had more bargaining power. As prices rose, union workers demanded higher pay, which increased operating costs and fueled rising prices. But 2020-21 is quite different from the 1970s. Currently, companies are using inflation as a mostly bad-faith excuse to raise prices during a time of record corporate profits, which will benefit companies as consumers bear the burden of rising costs. This is likely the unfortunate feedback loop we will see during the next six months. All that to say, as consumer costs rise, we might see demand for housing decline. With fewer experiences to spend money on during the pandemic, savings shot up, allowing potential homebuyers to reach their down payment goals far more quickly than expected. Inflation will cut into our ability to save.
Unlike a normal business cycle, the pandemic is still disrupting the global supply chain, with fewer dock/port workers and truck drivers as well as continued international travel restrictions. This is compounded by the pandemic-related shifts in consumer preferences: consumers are choosing physical goods rather than services. The demand for physical goods isn’t unique to the U.S., either — the whole world is trying to recover economically with a move toward physical goods, which is stressing the supply chain. The good news, however, is that inflation will likely fall around summer 2022 and shouldn’t mimic the decade-long inflationary period of the 1970s. The bad news is that it isn’t coming down today.
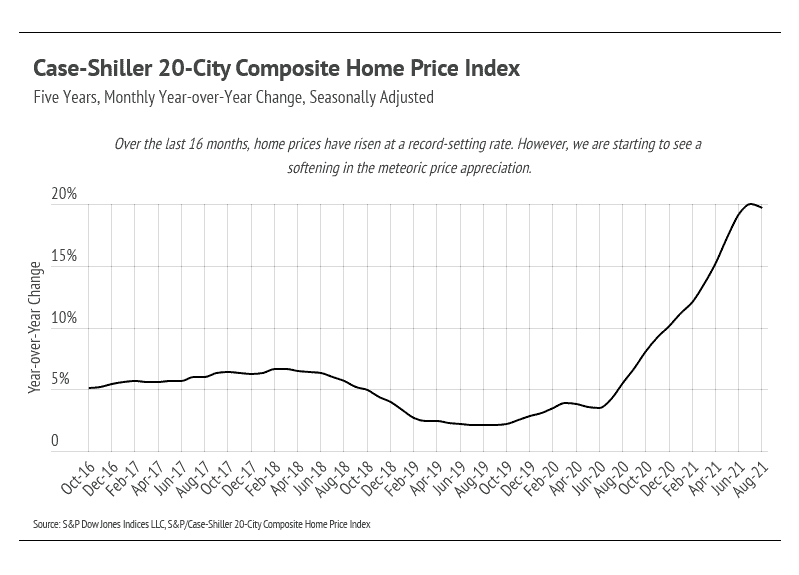
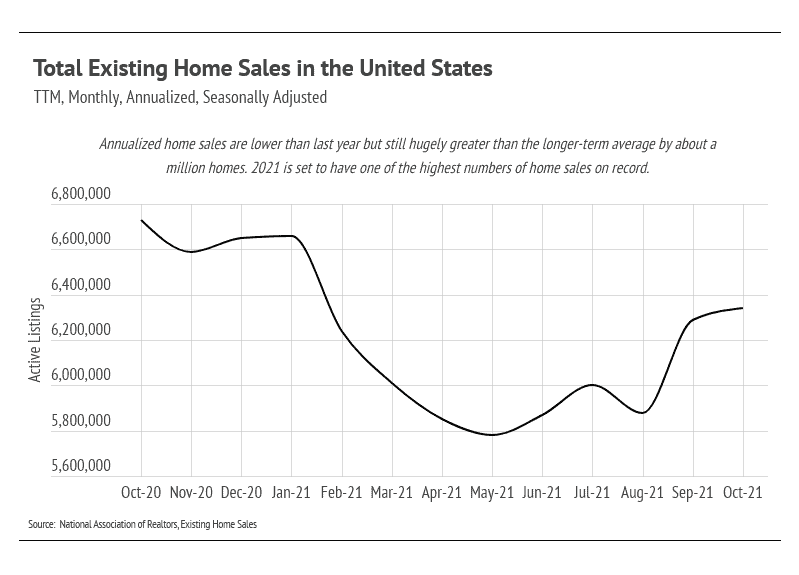
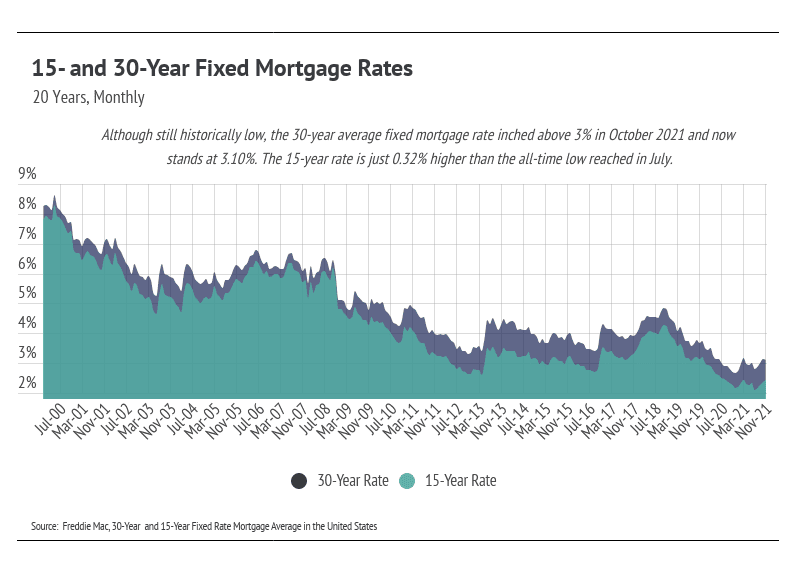
Although not necessarily a strict supply chain issue, the rising cost of housing can definitely be tied to supply. In the U.S., the supply of houses for sale is still near the all-time low reached in April. At the same time, demand remains high for homes, and we are on pace to have around a million more homes sold in 2021 than in a typical year, based on the long-term average. In other words, more homes are selling despite the historically low inventory. Because inflation diminishes the purchasing power of a dollar over time, buyers face pressure to buy sooner rather than later, further increasing demand for homes. Coupling inflation with historically low mortgage rates creates incentives to buy now even with the run-up in prices.
The market remains competitive for buyers, but conditions are making it an exceptional time for homeowners to sell. Low inventory means sellers will receive multiple offers with fewer concessions. Because sellers are often selling one home and buying another, it’s essential that sellers work with the right agent to ensure the transition goes smoothly.
Quick Take:
Note: You can find the charts/graphs for the Local Lowdown at the end of the following section.
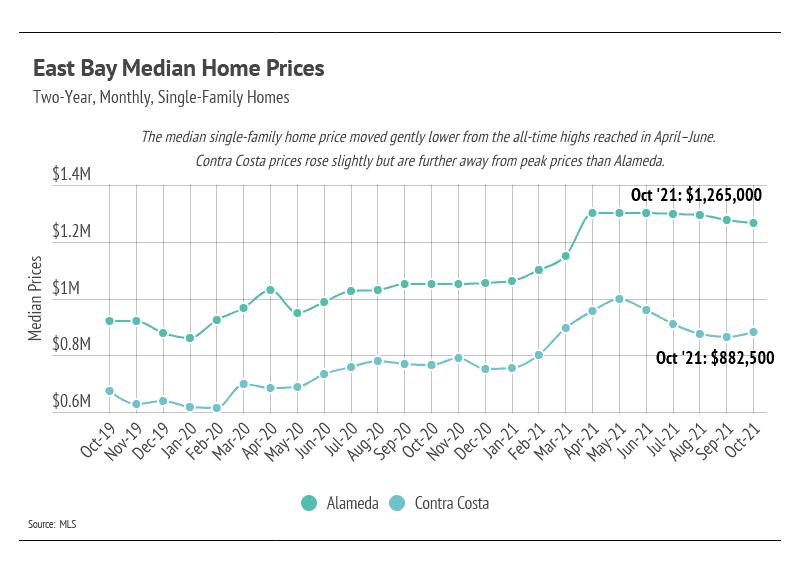
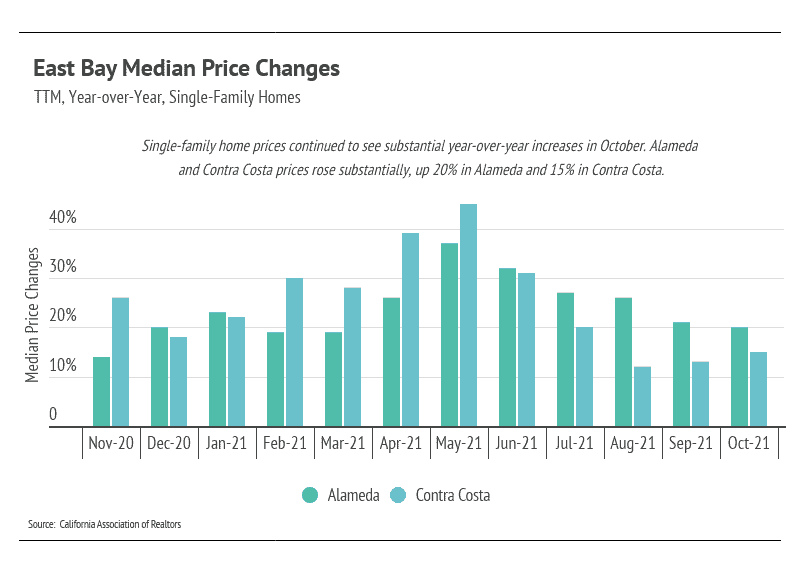
After single-family home prices appreciated significantly in the first half of the year, it makes sense that prices are declining in the third and fourth quarters. Although Alameda home prices have been historically high, they’ve declined slightly over the past four months. Contra Costa home prices experienced a much larger price correction after the May peak, declining 13% from May to September. However, Contra Costa prices increased slightly in October.
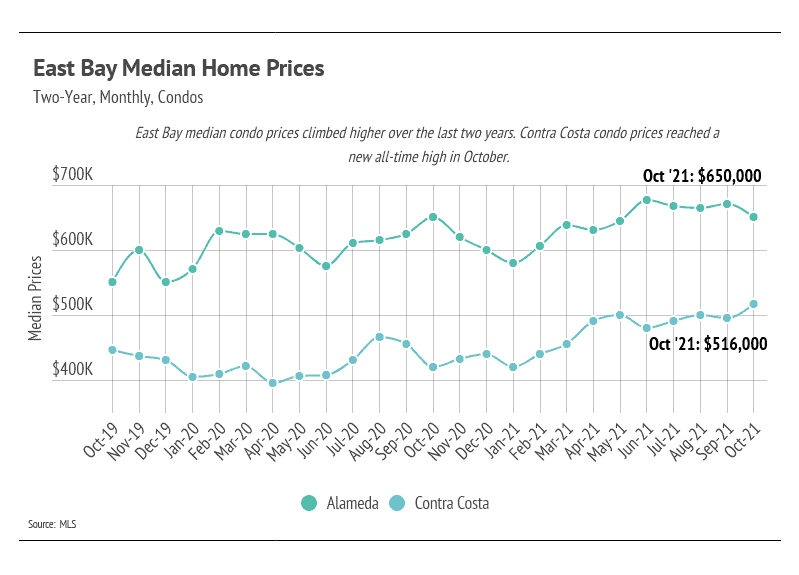
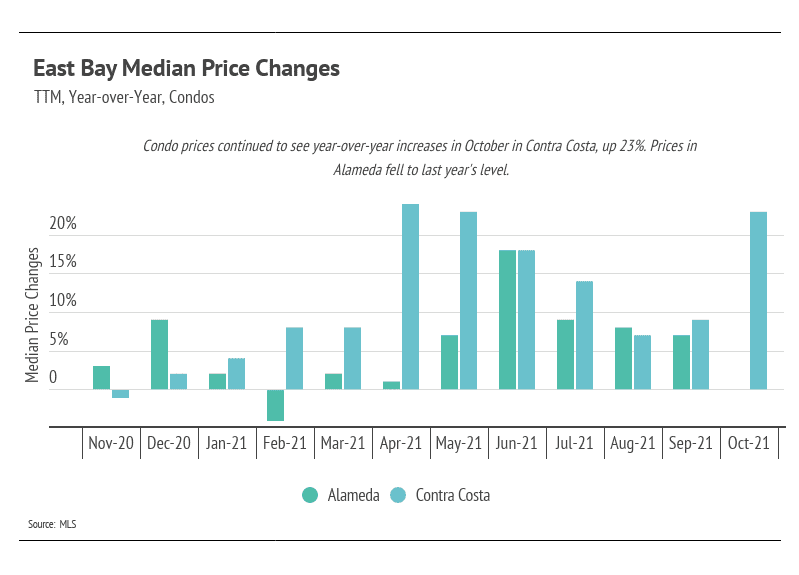
Condo prices reached a new all-time high in Contra Costa and are near the all-time high in Alameda. In the first half of the year, condo prices increased 13% in Alameda and 9% in Contra Costa. From July to October, prices contracted in Alameda, up 8% for the year. Prices climbed even higher in Contra Costa, however, up 18% through October 2021.
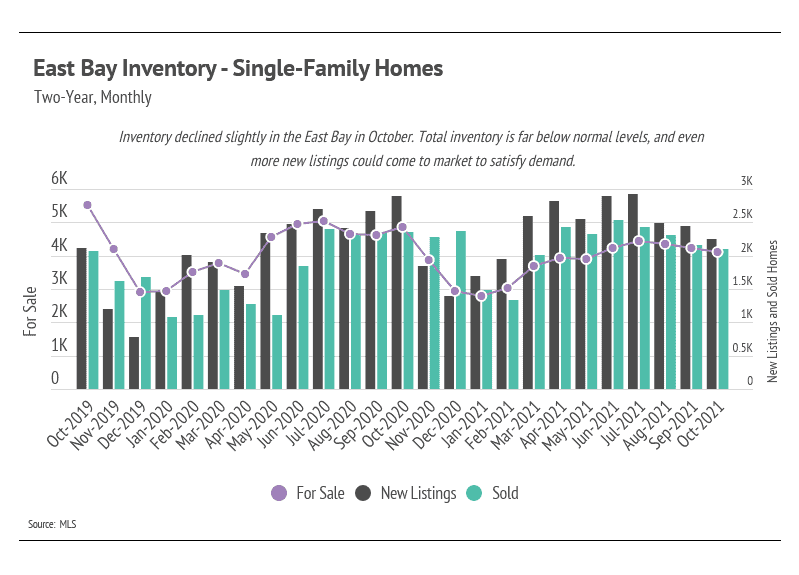
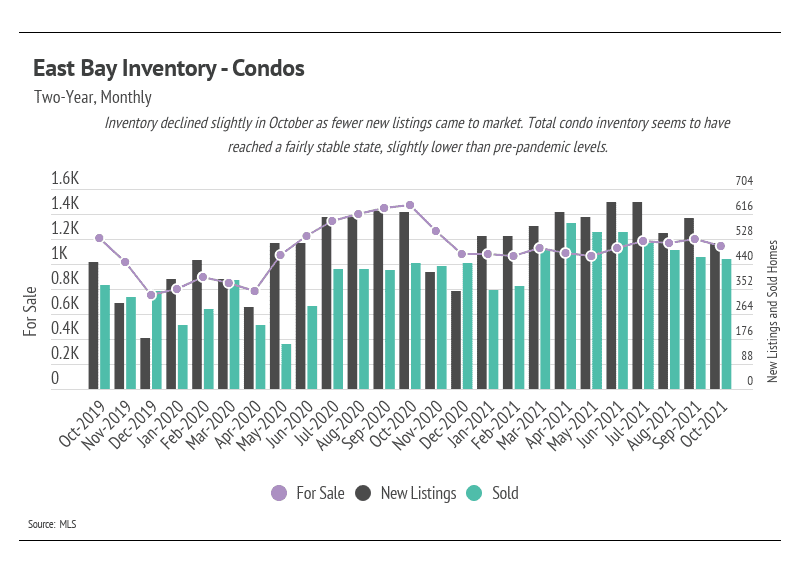
Despite the increase in single-family home inventory in 2021, we’re still at a historic low. August and September are typically the months each year with the highest inventory. In 2021, total inventory didn’t come close to last year’s level and was even further away from pre-pandemic levels. Even though we’re seeing some price correction after the first half of the year, the sustained low inventory will lift prices. Currently, Alameda has more condo inventory than it did pre-pandemic, but Contra Costa doesn’t. This could explain why condo prices pulled back in Alameda but rose in Contra Costa. Sales in the East Bay have been incredibly high, again highlighting demand in the area.
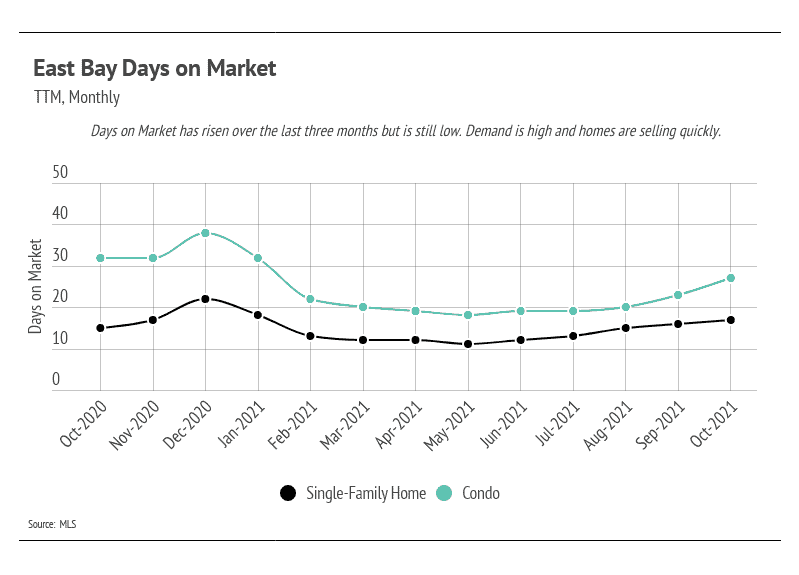
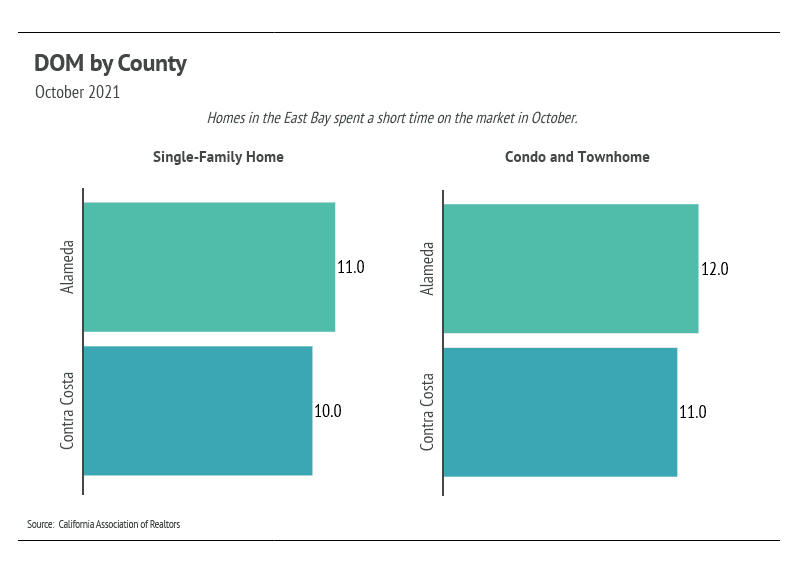
Homes are selling faster than at any point in the past 15 years. The Days on Market reflects the high demand for homes in the East Bay. Buyers must put in competitive offers, which, on average, are 5–10% above the list price of the home.
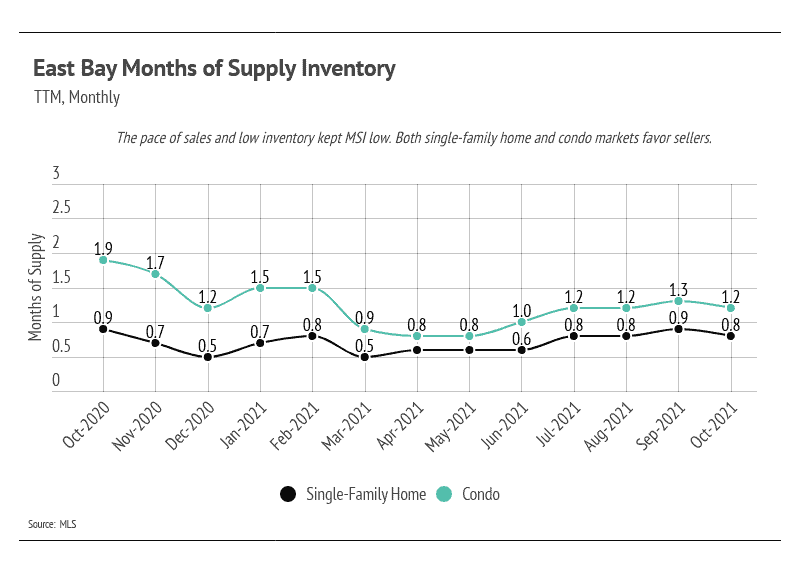
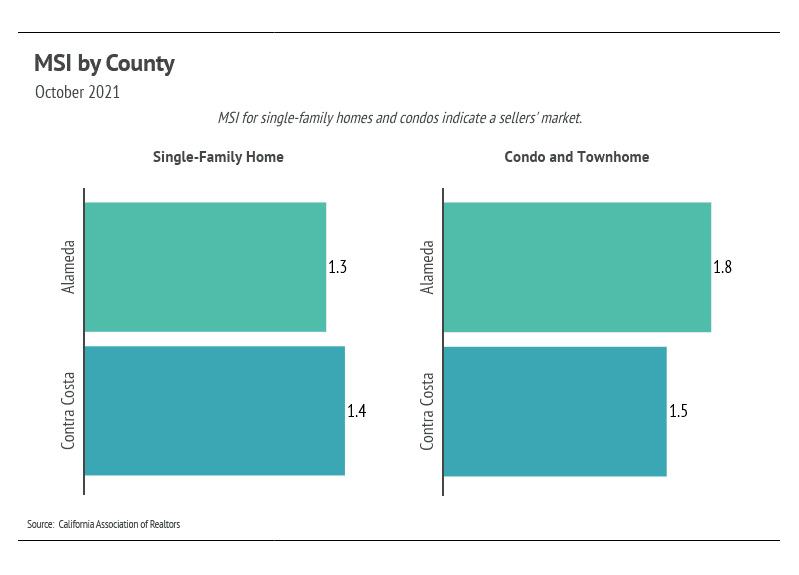
Months of Supply Inventory (MSI) quantifies the supply/demand relationship by measuring how many months it would take for all current homes for sale on the market to sell at the current rate of sales. The average MSI is three months in California, which indicates a balanced market. An MSI lower than three indicates that there are more buyers than sellers on the market (meaning it’s a sellers’ market), while a higher MSI indicates there are more sellers than buyers (meaning it’s a buyers’ market). MSI in the East Bay has indicated a sellers’ market for over five years now. Currently, both single-family home and condo MSIs are historically low, firmly indicating a sellers’ market.
Stay up to date on the latest real estate trends.

Michelle Kim | July 17, 2026
Discover the strategies that help San Francisco homes stand out, attract serious buyers, and maximize value before they even hit the market.

Michelle Kim | July 10, 2026
Avoid the most common mistakes homeowners make before listing their property and learn how preparation, pricing, and marketing can help you achieve a successful home s… Read more

Michelle Kim | July 6, 2026
Learn the key factors that help San Francisco homes attract multiple offers, from strategic pricing and professional marketing to home presentation and buyer demand.
Michelle Kim | July 1, 2026
Quick Take: Prices are rising across much of the Bay Area, with San Francisco single-family homes breaching the $2.2 million mark for the first time and the East Bay p… Read more

Michelle Kim | July 1, 2026
Quick Take: Median sale prices posted gains in three of four counties, with Sonoma County leading the way at 2.33% year-over-year growth, while Marin County saw a 4.70… Read more
Michelle Kim | July 1, 2026
Quick Take: Prices are on the rise across the board, with single-family homes and condos both posting year-over-year gains for the first time in over a year. Inventory… Read more
You’ve got questions and we can’t wait to answer them.